Review
. 2021 May;3(5):604-617.
doi: 10.1038/s42255-021-00389-5. Epub 2021 May 17.

UCP1 governs liver extracellular succinate and inflammatory pathogenesis

Affiliations
Review

UCP1 governs liver extracellular succinate and inflammatory pathogenesis

Evanna L Mills et al. Nat Metab. 2021 May.

Abstract

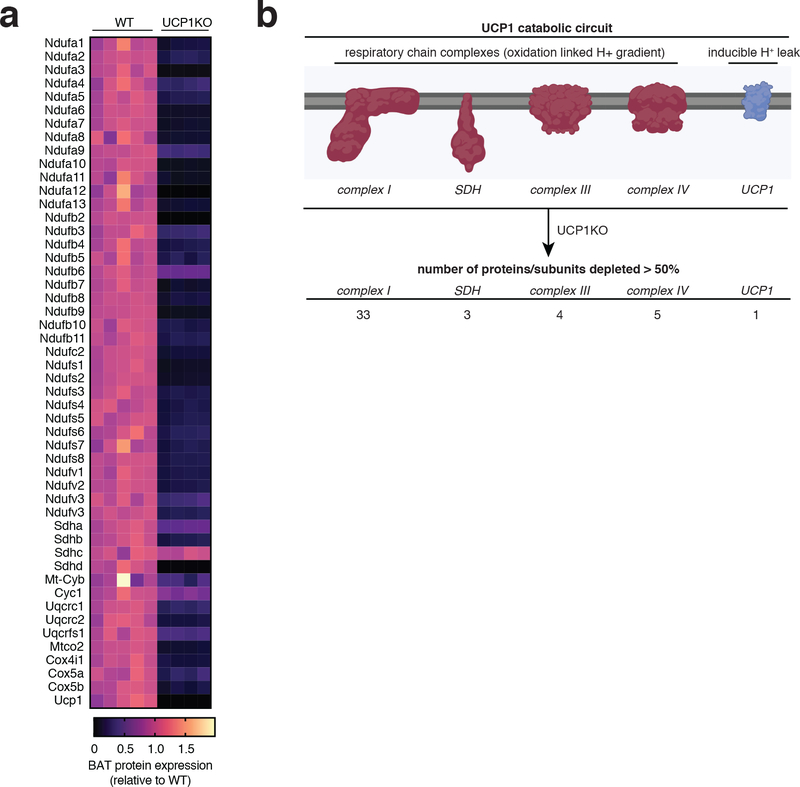
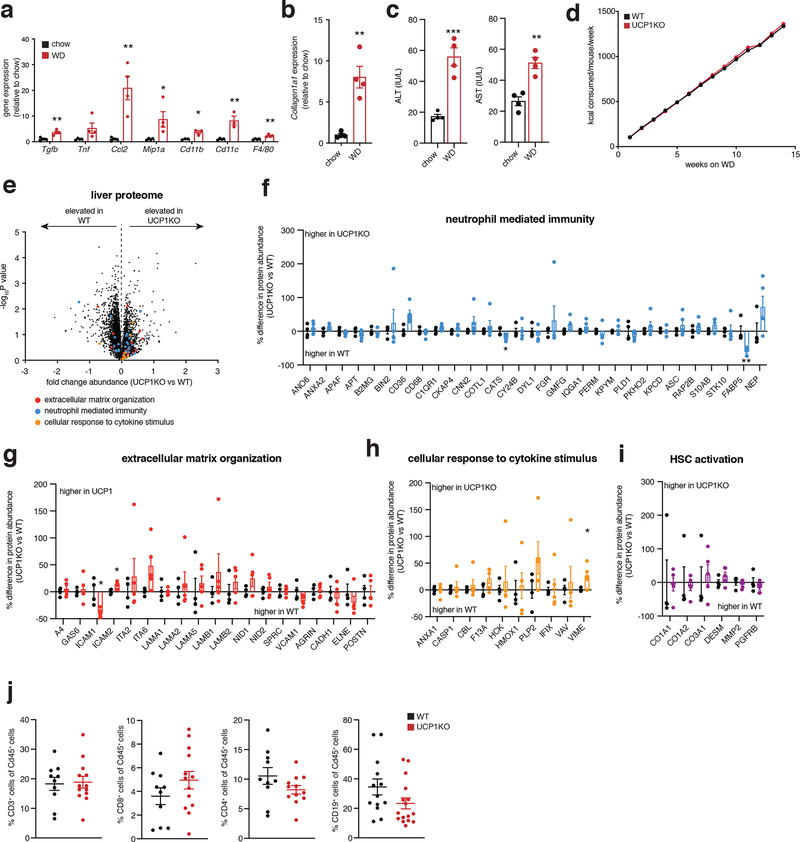
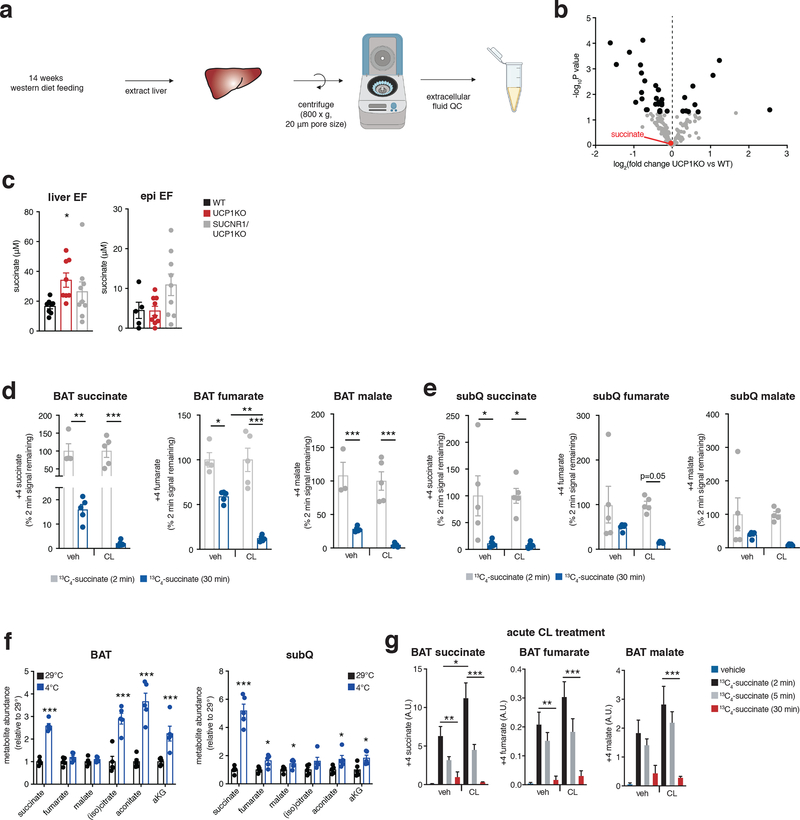
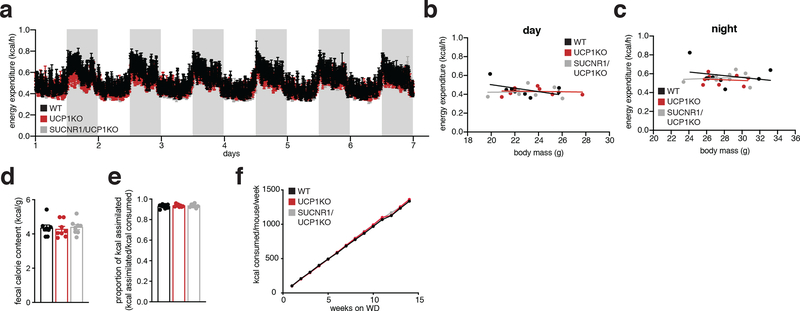
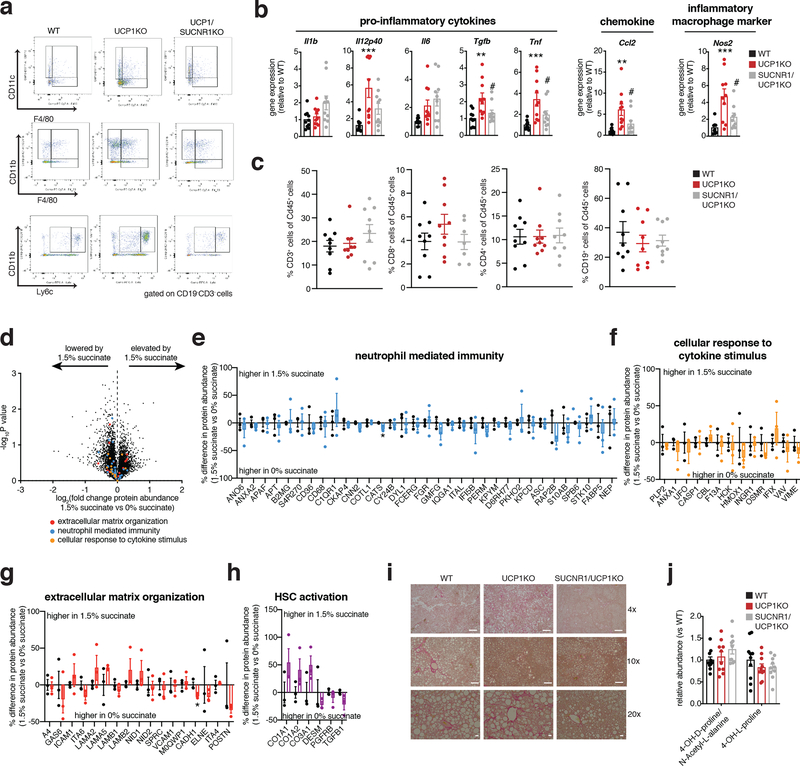
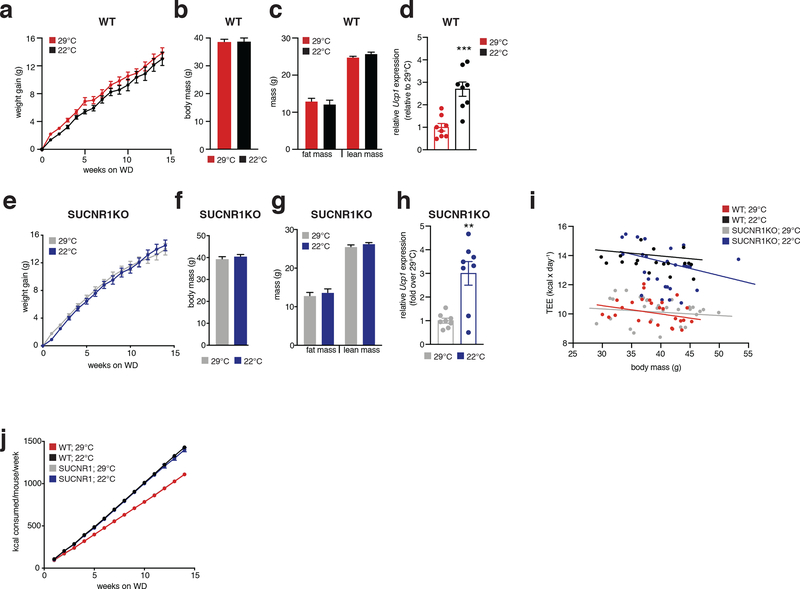
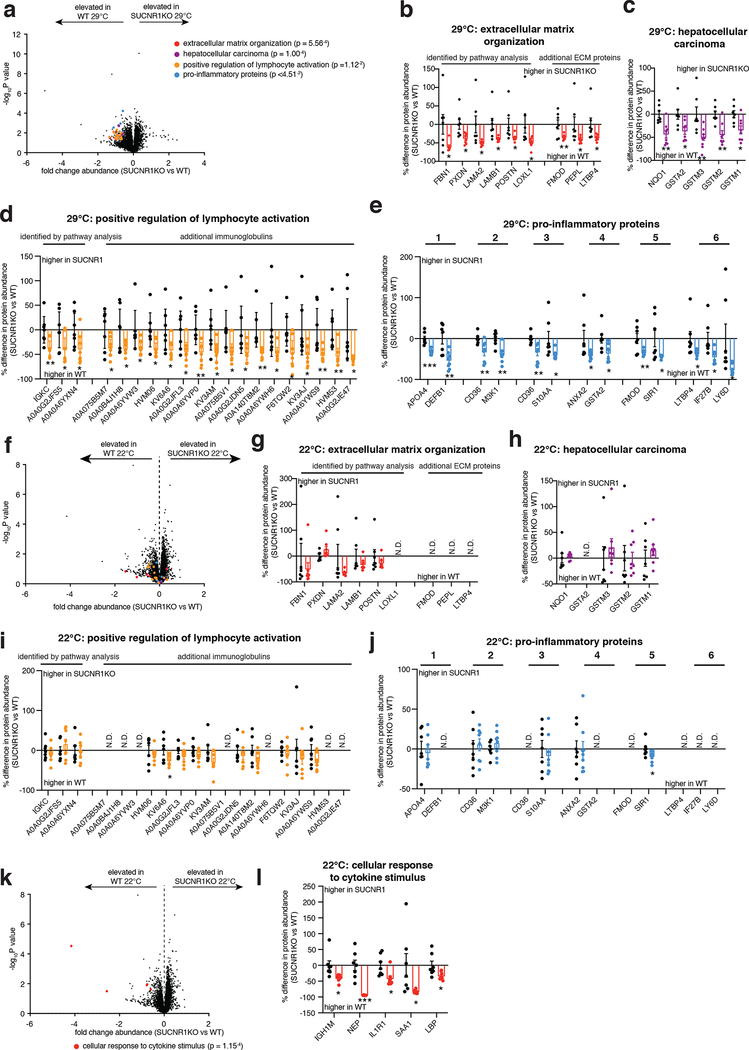
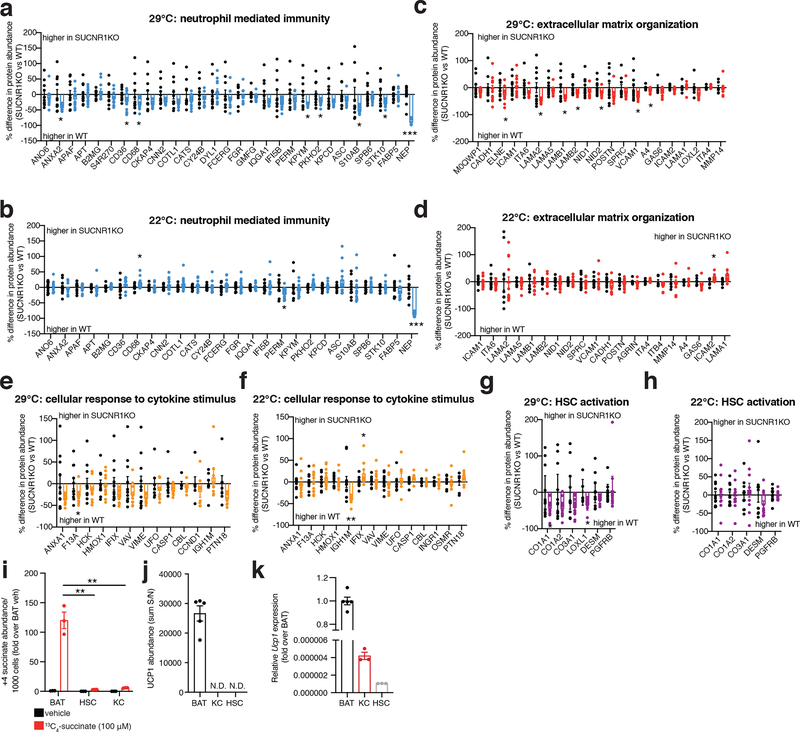
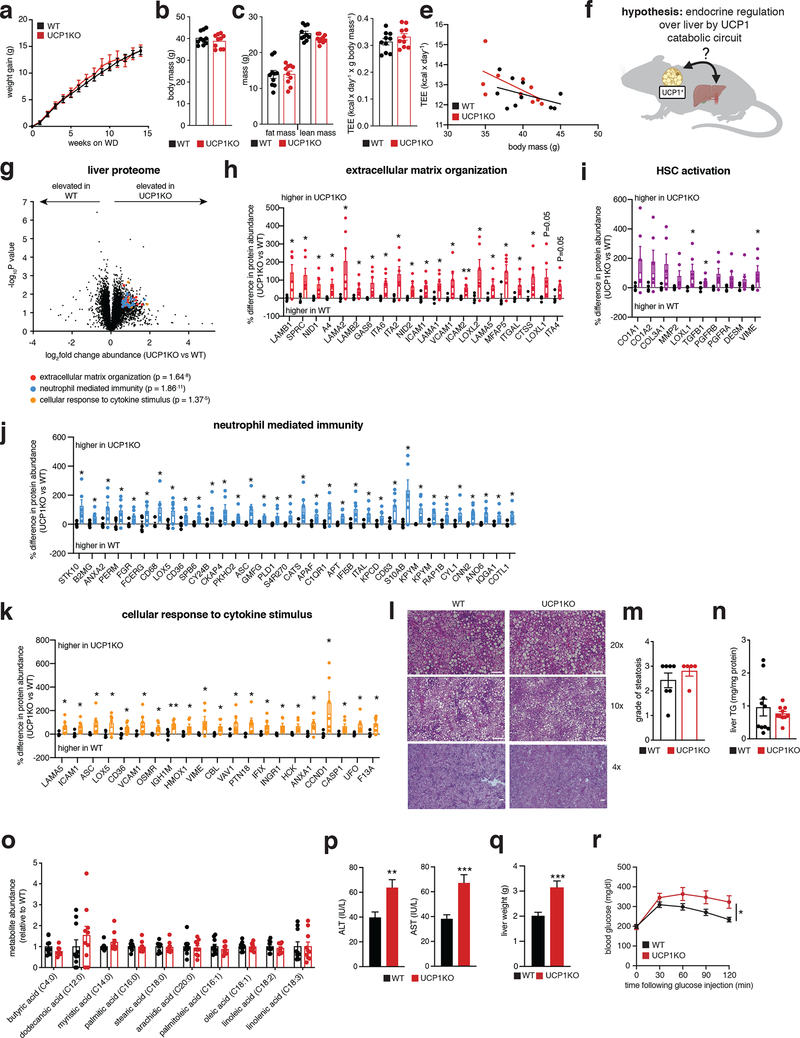
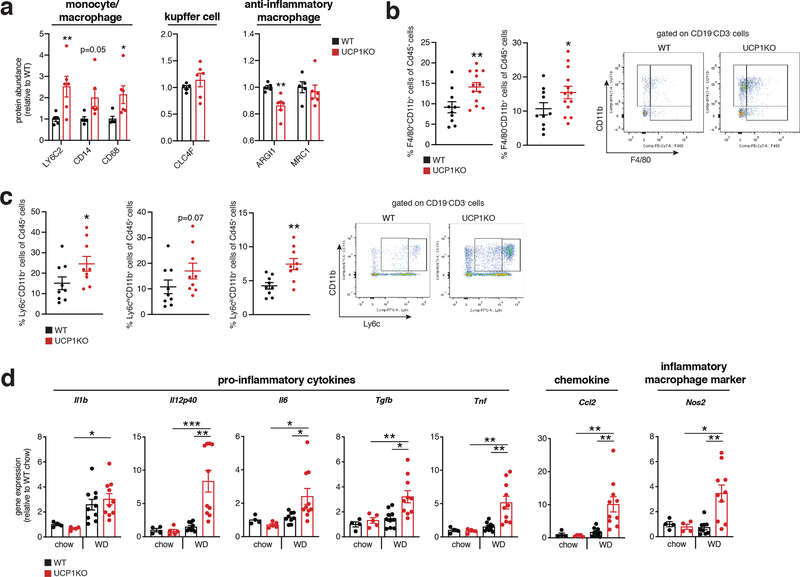
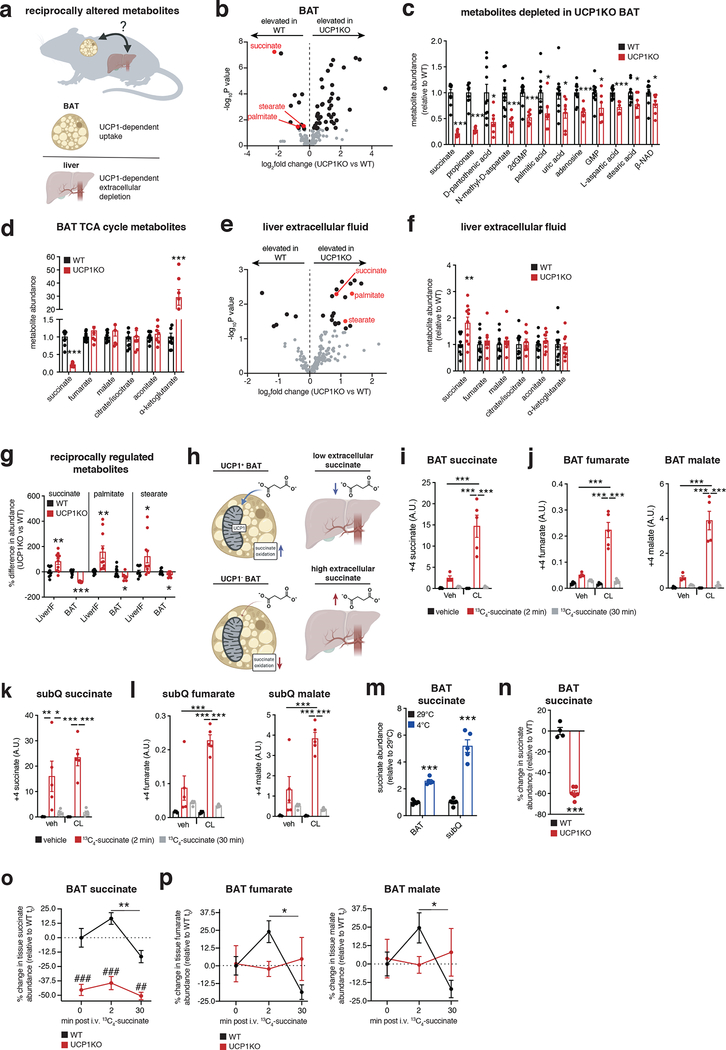
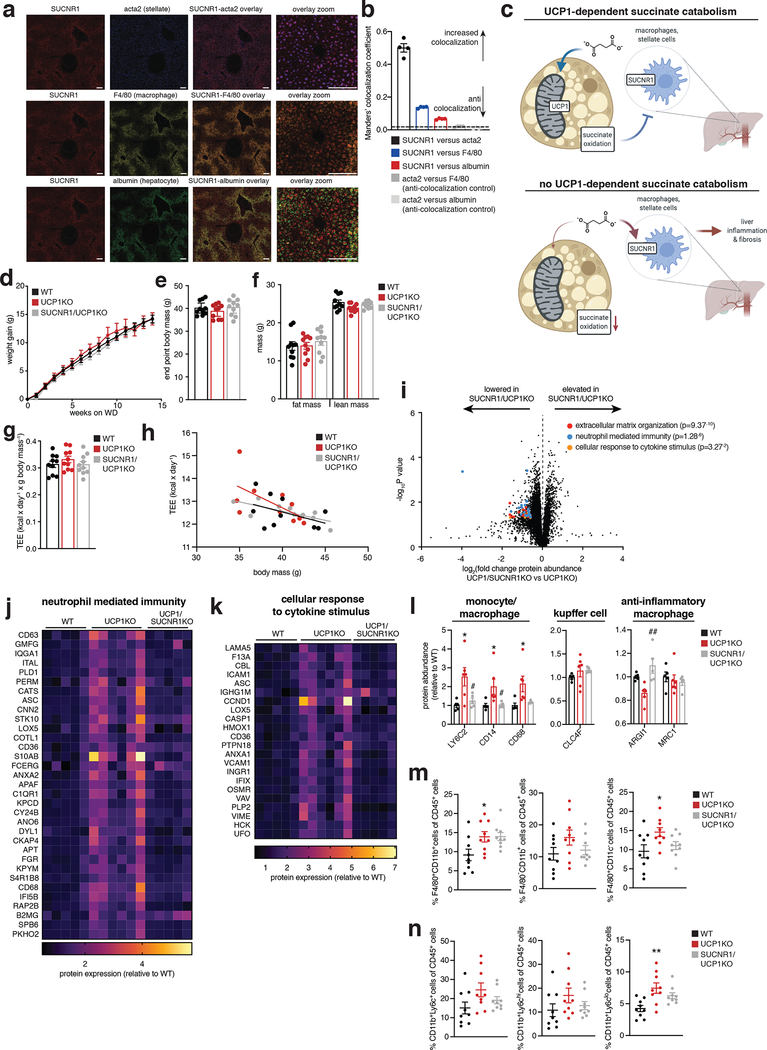
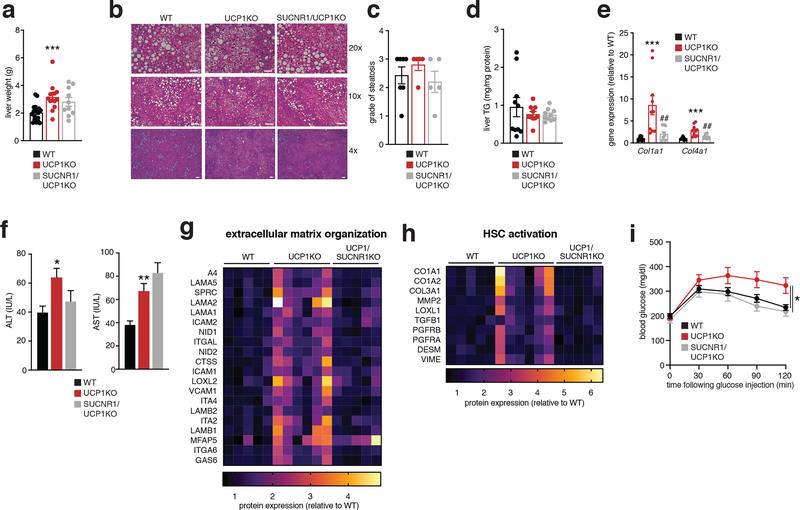
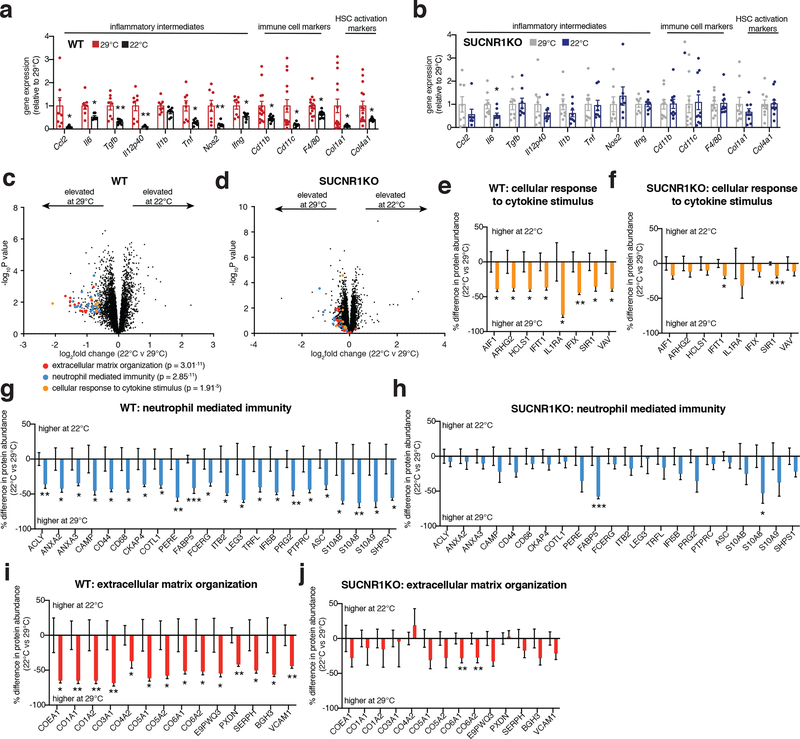
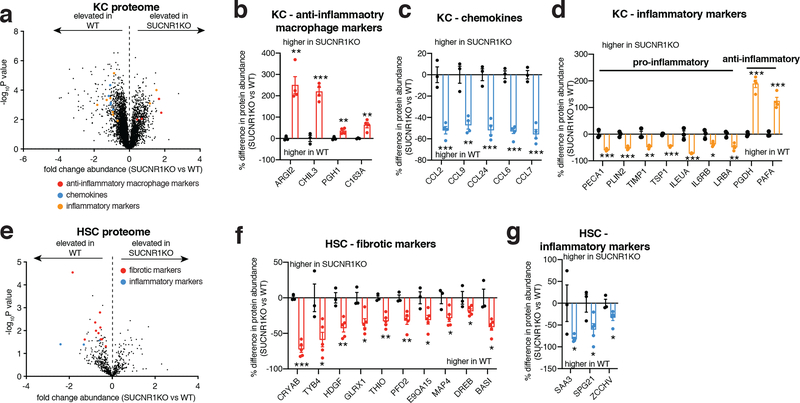
Non-alcoholic fatty liver disease (NAFLD), the most prevalent liver pathology worldwide, is intimately linked with obesity and type 2 diabetes. Liver inflammation is a hallmark of NAFLD and is thought to contribute to tissue fibrosis and disease pathogenesis. Uncoupling protein 1 (UCP1) is exclusively expressed in brown and beige adipocytes, and has been extensively studied for its capacity to elevate thermogenesis and reverse obesity. Here we identify an endocrine pathway regulated by UCP1 that antagonizes liver inflammation and pathology, independent of effects on obesity. We show that, without UCP1, brown and beige fat exhibit a diminished capacity to clear succinate from the circulation. Moreover, UCP1KO mice exhibit elevated extracellular succinate in liver tissue that drives inflammation through ligation of its cognate receptor succinate receptor 1 (SUCNR1) in liver-resident stellate cell and macrophage populations. Conversely, increasing brown and beige adipocyte content in mice antagonizes SUCNR1-dependent inflammatory signalling in the liver. We show that this UCP1-succinate-SUCNR1 axis is necessary to regulate liver immune cell infiltration and pathology, and systemic glucose intolerance in an obesogenic environment. As such, the therapeutic use of brown and beige adipocytes and UCP1 extends beyond thermogenesis and may be leveraged to antagonize NAFLD and SUCNR1-dependent liver inflammation.


Conflict of interest statement

Competing interests: The authors have no competing interests to declare.

Figures

Extended Data Figure 1:
Extended Data Figure 1:. UCP1KO depletes the UCP1 catabolic circuit in BAT
a, Protein abundance differences between WT and UCP1KO BAT of mitochondrial respiratory chain proteins (WT n = 5; UCP1KO n = 4). b, Depiction of the UCP1 catabolic circuit that includes UCP1 and the mitochondrial respiratory chain components that generate mitochondrial membrane potential, which is subsequently dissipated by UCP1. KO of UCP1 depletes the entire circuit in BAT, as shown in (a). See source data for precise p values.
Extended Data Figure 2:
Extended Data Figure 2:. Validation of western diet as a model of NAFLD, food intake during WD, chow diet liver assessment and lymphoid immune populations.
a, b, Relative gene expression in liver of mice following 14 weeks on chow or western diet (n = 4 except Cd11b chow n = 3, Cd11c WD n = 3). c, Levels of ALT (left) and AST (right) in plasma following 14 weeks chow or WD feeding (n = 4). d, Calories consumed during 14 weeks WD feeding comparing WT and UCP1KO mice (n = 10). e-i, Protein abundance differences of annotated pathways proteins or HSC activation proteins between WT and UCP1KO liver following 14 weeks chow feeding. (WT n = 4, UCP1KO n = 5). Data represent fold over WT. j, Fraction of CD45+ cells for each indicated population from livers of WT and UCP1KO mice following 14 weeks on WD (CD3, CD8 WT n = 10, UCP1KO n = 13; CD4 WT n = 10, UCP1KO n = 12; CD19 WT n = 13, UCP1KO n = 16). *P < 0.05, **P<0.01, ***P<0.001 (two-tailed Student’s t-test for pairwise comparisons). Data are mean ± s.e.m. See source data for precise p values.
Extended Data Figure 3:
Extended Data Figure 3:. The UCP1 catabolic circuit controls liver extracellular succinate levels.
a, Extracellular fluid extraction protocol. b, Liver tissue metabolomics: All annotated metabolites (grey), metabolites significantly changed (black), succinate (red) following 14 weeks on WD (n = 10). c, Absolute succinate concentration in liver and epi EF following 14 weeks on WD (Liver EF: WT, UCP1KO n = 8; SUCNR1/UCP1KO n = 9; Epi EF: WT n = 5; UCP1KO, SUCNR1/UCP1KO n = 9). d, e, BAT succinate catabolism determines as % of 2 min (m + 4) 13C-succinate and downstream (m + 4) 13C-TCA cycle metabolites remaining at 30 mins in BAT (c) and subQ (d) following 10 days daily injection with vehicle or i.p. β-adrenoreceptor agonism with CL-316,243 (1 mg/kg) and subsequent bolus i.v. 13C-succinate (100 mg/kg) for the indicated times (n = 5, except vehicle 2 min n = 4 in d). f, Abundance of succinate in TCA metabolites in BAT (left) and SubQ (right) following either 29°C housing or 2 weeks 4°C exposure (n = 5). g, (m + 4) 13C-succinate and downstream (m + 4) TCA cycle metabolite abundance following pre-treatment with vehicle or i.p. β-adrenoreceptor agonism with CL-316,243 (1 mg/kg; 30 min) and subsequent bolus i.v. 13C-succinate (100 mg/kg) for the indicated times. (Fumarate: 0 min n = 11, 2 min veh n = 11, 5 min veh n = 13, 30 min veh n = 12, 2 min CL n = 11, 5 min CL n = 13, 30 min CL n = 12; malate: 0 min n = 10, 2 min veh n = 11, 5 min veh n = 13, 30 min veh n = 12, 2 min CL n = 11, 5 min CL n = 13, 30 min CL n = 12; succinate: 0 min n = 10, 2 min veh n = 11, 5 min veh n = 13, 30 min veh n = 12, 2 min CL n = 11, 5 min CL n = 12, 30 min CL n = 11). *P < 0.05, **P<0.01, ***P<0.001. (two-tailed Student’s t-test for pairwise comparisons, one-way ANOVA for multiple comparisons involving independent variable, two-way ANOVA for multiple comparisons involving two independent variables). Data are mean ± s.e.m. See source data for precise p values.
Extended Data Figure 4:
Extended Data Figure 4:. Assessment of UCP1/SUCNR1KO energy expenditure, caloric absorption and caloric intake during WD.
a-c, Whole body energy expenditure of mice during 7 days WD feeding for WT, UCP1KO, and UCP1/SUCNR1KO mice (n = 8 except a WT n = 7) as determined by indirect calorimetry. d, e, Caloric absorption (d) and energy assimilation (e) during 7 days WD feeding. Proportion of energy assimilated from diet was determined by subtracting the total calories remaining in mouse feces from the total calories consumed in the same period (n = 8 from one assessment). f, Calories consumed during 14 weeks WD feeding (n = 10). One-way ANOVA for multiple comparisons involving independent variable, two-way ANOVA for multiple comparisons involving two independent variables, ANCOVA for b, c. Data are mean ± s.e.m. Assessments of UCP1/SUCNR1KO mice were performed simultaneously with WT and UCP1KO as depicted in Extended Data Figure 2, so WT and UCP1KO presentations in this figure are from the same underlying data reported in Figure Extended Data Figure 2. See source data for precise p values.
Extended Data Figure 5:
Extended Data Figure 5:. Assessment of UCP1/SUCNR1KO during WD and succinate drinking water experiments.
a, Representative cytofluorimetric dot plots for indicated immune cell populations from livers of WT, UCP1KO and UCP1/SUCNR1KO mice following 14 weeks on WD. b, Relative gene expression in WT, UCP1KO, and UCP1/SUCNR1KO livers following 14 weeks WD feeding (n = 10 except Il6, Nos2 n = 9 in WT and Nos2 n = 9 in UCP1/SUCNR1KO). c, Fraction of CD45+ cells for each indicated gated cell population from livers of WT, UCP1KO and UCP1/SUCNR1KO mice following 14 weeks on WD (n = 9 except CD8 n = 7 in UCP1/SUCNR1KO). d-h, Protein abundance differences of annotated pathways proteins or HSC activation proteins between vehicle and 1.5% succinate-treated UCP1KO liver following 6 weeks HFD (n = 3). Data represent fold over 0%. i, Sirius red staining observed in liver harvested from mice following 14 weeks WD feeding (upper panels 20x magnification, scale bars 100 μm; middle panels, 10x magnification, scale bars 200 μm, lower panels, 4x magnification, scale bars 200 μm; n = 4 biological replicates/genotype imaged). j, Relative abundance of hydroxyproline in plasma following 14 weeks on WD WT (n = 10). *P < 0.05, **P<0.01, ***P<0.001. (two-tailed Student’s t-test for pairwise comparisons, one-way ANOVA for multiple comparisons involving independent variable). Data are mean ± s.e.m. Assessments of UCP1/SUCNR1KO mice were performed simultaneously with WT and UCP1KO as depicted in Figure 2 and Extended Data Figure 2, so WT and UCP1KO presentations in this figure are from the same underlying data reported in Figure 2 and Extended Data Figure 2. See source data for precise p values.
Extended Data Figure 6:
Extended Data Figure 6:. Physiological assessment of WT and SUCNR1KO mice upon WD feeding.
a, b, Change in body mass (a) and final body weight (b) during WD feeding (22°C n = 18, 29°C n = 26). c, Body composition of mice following 14 weeks WD feeding (22°C n = 18, 29°C n = 26). d, Relative Ucp1 gene expression in BAT following 14 weeks on WD (n = 8). e, f, Change in body mass (e) and final body weight (f) of SUCNR1KO mice during 14 weeks WD feeding (22°C n = 27, 29°C n = 30). g, Body composition of mice following 14 weeks WD feeding (22°C n = 27, 29°C n = 30). h, Relative Ucp1 gene expression in BAT following 14 weeks on western diet (n = 8). i, ANCOVA analysis of energy expenditure following 14 weeks WD feeding. (WT 22°C n = 18, WT 29°C n = 27, SUCNR1KO 22°C n = 27, SUCNR1KO 29°C n = 30). j, Calories consumed during 14 weeks WD feeding. (WT 22°C n = 19, WT 29°C n = 26, SUCNR1KO 22°C n = 27, SUCNR1KO 29°C n = 31). **P<0.01, ***P<0.001. (two-tailed Student’s t-test for pairwise comparisons, ANCOVA for i). Data are mean ± s.e.m. See source data for precise p values.
Extended Data Figure 7:
Extended Data Figure 7:. SUCNR1 ablation is protective against liver dysfunction initiated by thermoneutral housing.
a, Protein abundance differences of annotated pathway proteins between WT and SUCNR1KO liver following 14 weeks WD feeding at thermoneutrality. Top pathways enriched in proteins exhibiting > 30% decrease between groups highlighted; (WT n = 7, SUCNR1KO n = 8). b-e, Protein abundance differences of top enriched pathways between WT and SUCNR1KO liver following 14 weeks WD feeding at thermoneutrality. (WT n = 7, SUCNR1KO n = 8). Data represent fold over WT. For (e, j): 1. Innate immune response in mucosa; 2. MyD88-dependent toll-like receptor signaling pathway; 3. Positive regulation of cell-matrix adhesion; 4. Interleukin-12-mediated signaling pathway; 5. Transforming growth factor beta receptor signaling pathway. 6. Additional inflammatory proteins not annotated in pathways. f, Protein abundance differences of annotated pathway proteins between WT and SUCNR1KO liver following 14 weeks WD feeding at room temperature. Top pathways found to be enriched in proteins exhibiting > 30% decrease between WT and SUCNR1KO at thermoneutrality in (a) are highlighted; (WT n = 7, SUCNR1KO n = 8). g-j, Protein abundance differences of annotated pathways proteins between WT and SUCNR1KO liver following 14 weeks WD feeding at room temperature. (WT n = 7, SUCNR1KO n = 8). Data represent fold over WT. k, Protein abundance differences of annotated pathway proteins between WT and SUCNR1KO liver following 14 weeks WD feeding at room temperature. Top pathways found to be enriched in proteins exhibiting > 30% decrease between WT and SUCNR1KO at room temperature are highlighted; (WT n = 7, SUCNR1KO n = 8). l, Protein abundance differences of annotated pathway proteins between WT and SUCNR1KO liver following 14 weeks WD feeding at room temperature. (WT n = 7, SUCNR1KO n = 8). Data represent fold over WT. *P < 0.05, **P<0.01, ***P<0.001. (two-tailed Student’s t-test for pairwise comparisons). Data are mean ± s.e.m. See source data for precise p values.
Extended Data Figure 8:
Extended Data Figure 8:. SUCNR1 ablation limits WD-induced inflammatory and ECM remodelling protein abundance at thermoneutrality but not at room temperature.
a-h, Protein abundance differences of annotated pathways proteins between WT and SUCNR1KO liver following 14 weeks WD feeding at thermoneutrality (a, c, e, g) or room temperature (b, d, f, h). (WT n = 10–11, SUCNR1KO n = 10–12; except A4, GAS6, ICAM2, LAMA1, LOXL2, ITA4, MMP14, WT n = 5–7, SUCNR1KO n = 8). Data represent fold over WT at each temperature. Illustrated proteins are from top pathways found to be enriched in proteins exhibiting > 50% increase between WT and UCP1KO in Figure 2. i, 13C4-succinate uptake into brown adipocytes, KC and HSCs following 2 min incubation with 13C4-succinate (100 μM). Data represent relative signal normalized to cell number (n = 3). Data represent fold over brown adipocytes vehicle. j, UCP1 protein abundance (sum signal to noise ratio) in BAT, KC and HSCs (BAT n = 5; KC, HSC n = 3). k, Relative Ucp1 expression in BAT, KC and HSCs (BAT n = 5; KC, HSC n = 3). Data represent fold over BAT. *P < 0.05, **P<0.01, ***P<0.001. (two-tailed Student’s t-test for pairwise comparisons). Data are mean ± s.e.m. See source data for precise p values.
Figure 1:
Figure 1:. Brown and beige adipose tissues regulate systemic inflammation and liver pathology independent of thermogenesis.
a, b, Change in body mass (a) and final weight (b) during WD feeding (n = 10) c, Body composition of mice following 14 weeks WD feeding (n = 10). d, e, Cumulative whole body energy expenditure of mice over 14 weeks WD feeding, determined as described in Methods (n = 10). f, Hypothesis for thermogenesis-independent role for the BAT UCP1 catabolic circuit in endocrine regulation over liver. g, Protein abundance differences between WT and UCP1KO liver following 14 weeks WD feeding. Top pathways enriched in proteins exhibiting > 50% increase between genotypes highlighted; (WT n = 5; UCP1KO n = 6). h-k, Protein abundance differences of top enriched pathways (h, j, k) or established HSC activation proteins (i) between WT and UCP1KO liver following 14 weeks WD feeding; (WT n = 5; UCP1KO n = 6). l, Representative images of hematoxylin and eosin staining of liver harvested from mice following 14 weeks WD feeding (upper panels 20x magnification, scale bars 100 μm; middle panels, 10x magnification, scale bars 200 μm, lower panels, 4x magnification, scale bars 200 μm; n = 7 (WT); n = 5 (UCP1KO, SUCNR1KO/UCP1KO) biological replicates/genotype imaged). m, Steatosis grade following 14 weeks WD feeding (WT n = 7; UCP1KO n = 5). See methods for grading system. n, Liver triglyceride (TG) content following 14 weeks WD feeding (n = 10). o, Relative abundance of lipid metabolites in liver following 14 weeks on WD (n = 10). p, Levels of ALT (left) and AST (right) in WT and UCP1KO plasma following 14 weeks WD feeding (ALT: WT n = 41; UCP1KO n = 34; AST: WT n = 37; UCP1KO n = 33). q, Liver weights of WT and UCP1KO mice following 14 weeks WD feeding (WT n = 20; UCP1KO n = 14). r, i.p. glucose tolerance test in mice following 14 weeks WD feeding (WT n = 24; UCP1KO n = 15). *P < 0.05, **P<0.01, ***P<0.001 (two-tailed Student’s t-test for pairwise comparisons, two-way ANOVA for multiple comparisons involving two independent variables, ANCOVA for e). Data are mean ± s.e.m. See source data for precise p values.
Figure 2:
Figure 2:. The UCP1 catabolic circuit controls inflammation and myeloid cell populations in the liver.
a, Protein abundance differences between WT and UCP1KO liver immune cell markers following 14 weeks WD feeding (WT n = 5; UCP1KO n = 6). b, c, Cytofluorimetric dot plots (right) and fraction of CD45+ cells for each indicated population (left) from livers of WT and UCP1KO mice following 14 weeks on WD (b: WT n = 10; UCP1KO n = 13; c: n = 9). d, Relative gene expression of cytokine, chemokine, and macrophage markers in WT and UCP1KO livers following 14 weeks WD (n = 10 except Il6, Il12p40, Nos2 n = 9) or chow (n = 5 except Il1, Tnf, Nos2 n = 4) feeding. *P < 0.05, **P<0.01, ***P<0.001 (one- or two-tailed Student’s t-test for pairwise comparisons, one-way ANOVA for multiple comparisons involving two independent variables). Data are mean ± s.e.m. See source data for precise p values.
Figure 3:
Figure 3:. The UCP1 catabolic circuit controls liver extracellular succinate levels.
a, Metabolomics strategy to identify liver extracellular fluid (EF) metabolites regulated by BAT. b, e, BAT (b) and liver EF (e) metabolomics: annotated metabolites (grey), metabolites significantly changed (black), metabolites downregulated in BAT and upregulated in liver EF (red) following 14 weeks on WD; WT (n = 10) and UCP1KO (n = 7 for BAT; n = 10 for liver EF). c, d, f, Significantly downregulated metabolites in UCP1KO BAT (c) or abundance of TCA metabolites in BAT (d) or liver EF (f) following 14 weeks on WD; WT (n = 10) and UCP1KO (n = 7 for BAT; n = 10 for liver EF). g, Metabolites downregulated in BAT and upregulated in liver EF following 14 weeks on WD (n = 10, except BAT UCP1KO n = 7). h, Model for BAT control over succinate levels. i-l, Abundance of (m + 4) 13C-succinate (i, k) and (m + 4) TCA cycle metabolites (j, l) in BAT (i, j) and subQ (k, l) from chow fed mice following 10 days daily injection with vehicle or CL-316,243 (1 mg/kg) and subsequent bolus i.v. 13C-succinate (100 mg/kg) for the indicated times (n = 5, except CL (veh) n = 4 and veh (2 min) n = 4 in j). m, Abundance of succinate in BAT and SubQ adipose tissue from chow fed mice comparing 29°C to 2 weeks 4°C exposure (n = 5). n, Abundance of succinate in BAT of chow fed WT (n = 4) and UCP1KO (n = 6) mice. o, p % change in abundance of total BAT succinate (o) and downstream TCA cycle metabolites (p) in BAT of WT and UCP1KO chow fed mice following bolus i.v. 13C-succinate (100 mg/kg) for the indicated times (WT 0, 30 mins and UCP1KO 30 mins n = 5; WT 2 mins and UCP1KO 0, 2 mins n = 6). *P < 0.05, **P<0.01, ***P<0.001. (two-tailed Student’s t-test for pairwise comparisons, one-way ANOVA for multiple comparisons involving independent variable, two-way ANOVA for multiple comparisons involving two independent variables). Data are mean ± s.e.m. See source data for precise p values.
Figure 4:
Figure 4:. The BAT/beige fat UCP1 catabolic circuit controls liver immune cell infiltration and inflammation via succinate-SUCNR1 signaling.
a, ISH of liver for cellular localization of SUCNR1. SUCNR1 (red), acta2 stellate cell marker (blue), F4/80 macrophage marker (yellow) and albumin hepatocyte marker (green). SUCNR1 exhibits strong colocalization with acta2 and intermediate colocalization with F4/80. Scale bars 10 μm. b, Manders’ colocalization coefficient ISH data from panel a. Coefficients < 0.1 are considered completely anti-colocalized, which is validated by the anti-colocalization controls of distinct cell type markers. (n = 4 histological slice replicates). c, Mechanistic model for the relationship between succinate, UCP1+ BAT, and liver-resident SUCNR1-expressing immune cell populations. d, e, Change in body mass (d) and final weight (e) during WD feeding for WT, UCP1KO, and UCP1/SUCNR1KO mice (n = 10). f, Body composition of mice following 14 weeks WD feeding for WT, UCP1KO, and UCP1/SUCNR1KO mice (n = 10). g, h, Whole body energy expenditure of mice during 14 weeks WD feeding for WT, UCP1KO, and UCP1/SUCNR1KO mice (n = 10). i, Protein abundance differences between UCP1KO and UCP1/SUCNR1KO liver following 14 weeks WD feeding. Top pathways found to be enriched in proteins exhibiting > 50% increase between WT and UCP1KO in Figure 2 are highlighted; (UCP1KO n = 6; UCP1/SUCNR1KO n = 5). j-l, Protein abundance differences of annotated pathways (j, k) or immune cell markers (l) between WT, UCP1KO and UCP1/SUCNR1KO livers following 14 weeks WD feeding; (WT n = 5; UCP1KO n = 6; UCP1/SUCNR1KO n = 5). Data represent fold over WT. m, n, Fraction of CD45+ cells for each indicated gated cell population from livers of WT, UCP1KO and UCP1/SUCNR1KO mice following 14 weeks on WD (n = 9). *P < 0.05, **P<0.01, ***P<0.001. (One-way ANOVA for multiple comparisons involving independent variable, two-way ANOVA for multiple comparisons involving two independent variables, ANCOVA for TEE analysis). Data are mean ± s.e.m. Assessments of UCP1/SUCNR1KO mice were performed simultaneously with WT and UCP1KO as depicted in Figure 1 & 2, so WT and UCP1KO presentations in this figure are from the same underlying data reported in Figure 1 & 2. See source data for precise p values.
Figure 5:
Figure 5:. Liver succinate-SUCNR1 signaling drives liver pathology and glucose intolerance, which is antagonized by the UCP1 catabolic circuit.
a, Liver weights of WT, UCP1KO and UCP1/SUCNR1KO mice following 14 weeks WD feeding (WT n = 20; UCP1KO n = 14; UCP1/SUCNR1KO n = 10). b, Representative images of hematoxylin and eosin staining of liver harvested from mice following 14 weeks WD feeding (upper panels 20x magnification, scale bars 100 μm; middle panels, 10x magnification, scale bars 200 μm, lower panels, 4x magnification, scale bars 200 μm; n = 7 (WT); n = 5 (UCP1KO, SUCNR1KO/UCP1KO) biological replicates/genotype imaged). c, Steatosis grade following 14 weeks WD feeding (WT n = 7; UCP1KO n = 5, UCP1/SUCNR1KO n = 5). See methods for grading system. d, Liver triglyceride content following 14 weeks WD feeding for WT, UCP1KO, and UCP1/SUCNR1KO mice (n = 10). e, Relative Col1a1 and Col4a1 gene expression in WT, UCP1KO, and UCP1/SUCNR1KO livers following 14 weeks WD feeding (n = 10; WT n = 9). f, Levels of ALT (left) and AST (right) in WT, UCP1KO, and UCP1/SUCNR1KO plasma following 14 weeks WD feeding (ALT: WT n = 41; UCP1KO, UCP1/SUCNR1KO n = 33; AST: WT n = 37; UCP1KO, UCP1/SUCNR1KO n = 33). g, h, Protein abundance differences of annotated pathways (g) or established HSC activation proteins (h) between WT, UCP1KO and UCP1/SUCNR1KO liver following 14 weeks WD feeding. (WT n = 5; UCP1KO n = 6; UCP1/SUCNR1KO n = 5). i, i.p. glucose tolerance test in mice following 14 weeks WD feeding (WT n = 24; UCP1KO n = 15; UCP1/SUCNR1KO n = 12). *P < 0.05, **P<0.01, ***P<0.001, (One-way ANOVA for multiple comparisons involving independent variable, two-way ANOVA for multiple comparisons involving two independent variables). Data are mean ± s.e.m. Assessments of UCP1/SUCNR1KO mice were performed simultaneously with WT and UCP1KO as depicted in Figure 1, so WT and UCP1KO presentations in this figure are from the same underlying data reported in Figure 1. See source data for precise p values.
Figure 6:
Figure 6:. Elevation of BAT and beige fat antagonizes NAFLD via SUCNR1.
a, b, Relative gene expression in livers of WT (a) or SUCNR1KO (b) mice following 14 weeks on WD (WT: Ccl2, Il6, Tgfb, Il12p40, Il1b, Tnf, n = 8; Nos2, Ifng, n = 7; Cd11b, Cd11c, Col1a1, Col4a1, n =9, F4/80 n =10; SUCNR1KO: Ccl2, Nos2, n = 7; Il6, Tgfb, Il12p40, Il1b, Tnf, Ifng, n = 8; Cd11b, n = 10; Cd11c, F4/80, Col4a1, n =11, Col1a1 n =9). c, d, Protein abundance differences of annotated pathways proteins between room temperature and thermoneutral housing in WT (c) and SUCNR1KO (d) liver following 14 weeks WD feeding. Top pathways enriched in proteins exhibiting > 30% decrease between groups highlighted; (WT n = 11, SUCNR1KO n = 12). e-j, Protein abundance differences of top enriched pathways (c, d) between room temperature and thermoneutral housing in WT (e, g, i) and SUCNR1KO (f, h, j) liver following 14 weeks WD feeding. (WT n = 11, SUCNR1KO n = 12). Data represent fold over 29°C within each genotype. *P < 0.05, **P<0.01, ***P<0.001, (two-tailed Student’s t-test for pairwise comparisons). Data are mean ± s.e.m. See source data for precise p values.
Figure 7:
Figure 7:. SUCNR1 regulates inflammation and activation in liver resident KC and HSC populations.
a-d, Protein abundance differences of annotated proteins between KCs isolated from WT and SUCNR1KO mice. (WT n = 3, SUCNR1KO n = 4). Data represent fold over WT. e-g, Protein abundance differences of annotated proteins between HSCs isolated from WT and SUCNR1KO mice. (WT n = 3, SUCNR1KO n = 5). Data represent fold over WT. *P < 0.05, **P<0.01, ***P<0.001, (two-tailed Student’s t-test for pairwise comparisons). Data are mean ± s.e.m. See source data for precise p values.

Comment in

References

    1. Younossi ZM Non-alcoholic fatty liver disease - A global public health perspective. J Hepatol 70, 531–544, doi:10.1016/j.jhep.2018.10.033 (2019). - DOI - PubMed
    1. Lefere S & Tacke F Macrophages in obesity and non-alcoholic fatty liver disease: Crosstalk with metabolism. JHEP Rep 1, 30–43, doi:10.1016/j.jhepr.2019.02.004 (2019). - DOI - PMC - PubMed
    1. Pfeifer A & Hoffmann LS Brown, beige, and white: the new color code of fat and its pharmacological implications. Annu Rev Pharmacol Toxicol 55, 207–227, doi:10.1146/annurev-pharmtox-010814-124346 (2015). - DOI - PubMed
    1. Betz MJ & Enerback S Targeting thermogenesis in brown fat and muscle to treat obesity and metabolic disease. Nat Rev Endocrinol 14, 77–87, doi:10.1038/nrendo.2017.132 (2018). - DOI - PubMed
    1. Mills EL et al. Accumulation of succinate controls activation of adipose tissue thermogenesis. Nature 560, 102–106, doi:10.1038/s41586-018-0353-2 (2018). - DOI - PMC - PubMed

Publication types

MeSH terms