

Sample processing and single cell RNA-sequencing of peripheral blood immune cells from COVID-19 patients
- PMID: 34002169
- PMCID: PMC8114807
- DOI: 10.1016/j.xpro.2021.100582
Sample processing and single cell RNA-sequencing of peripheral blood immune cells from COVID-19 patients
Abstract
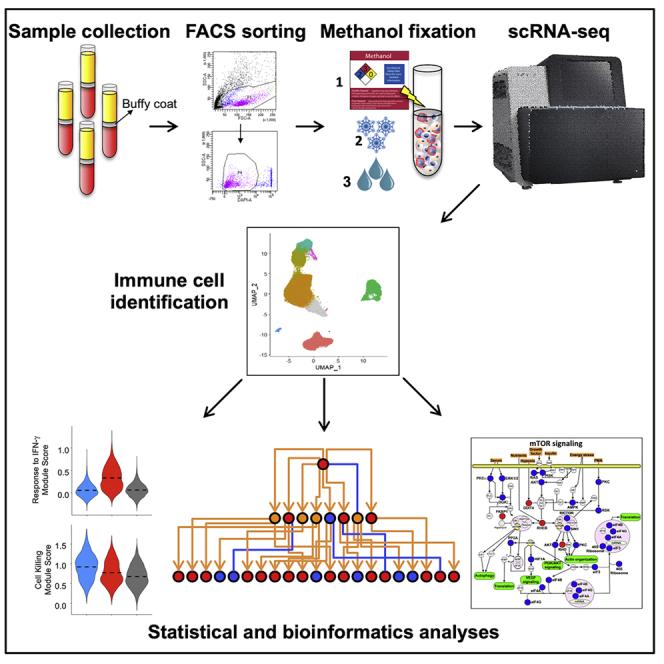
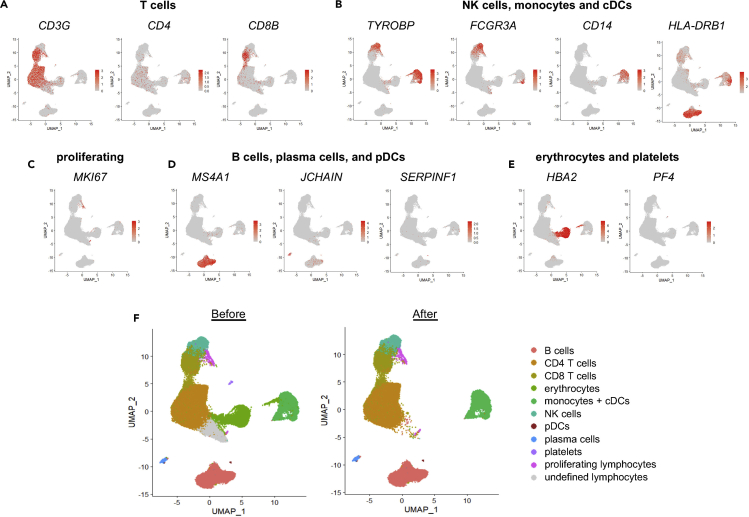
Single-cell RNA sequencing (scRNA-seq) of peripheral blood mononuclear cells (PBMCs) allows in-depth assessment of transcriptional changes in immune cells of patients with COVID-19. However, collecting, processing, and analyzing samples from patients with COVID-19 pose many challenges because blood samples may contain infectious virus, identification of immune cell subtypes can be difficult, and biological interpretation of analytical results is complex. To address these issues, we describe a protocol for sample processing, sorting, methanol fixation, and scRNA-seq analysis of PBMCs from frozen buffy coat samples from patients with COVID-19. For complete details on the use and execution of this protocol, please refer to (Yao et al., 2021).
Keywords: Bioinformatics; Immunology; Sequence analysis.
© 2021 The Authors.
Conflict of interest statement
The authors declare no competing interests.
Figures
Similar articles
-
Protocol for investigating intracellular microbial diversity using single-cell RNA-seq in immune cells of SARS-CoV-2-positive and recovered patients.STAR Protoc. 2025 Mar 21;6(1):103546. doi: 10.1016/j.xpro.2024.103546. Epub 2025 Jan 8. STAR Protoc. 2025. PMID: 39786999 Free PMC article.
-
No detectable alloreactive transcriptional responses under standard sample preparation conditions during donor-multiplexed single-cell RNA sequencing of peripheral blood mononuclear cells.BMC Biol. 2021 Jan 20;19(1):10. doi: 10.1186/s12915-020-00941-x. BMC Biol. 2021. PMID: 33472616 Free PMC article.
-
Single-cell RNA sequencing reveals the sustained immune cell dysfunction in the pathogenesis of sepsis secondary to bacterial pneumonia.Genomics. 2021 May;113(3):1219-1233. doi: 10.1016/j.ygeno.2021.01.026. Epub 2021 Mar 7. Genomics. 2021. PMID: 33691144 Free PMC article.
-
Dissecting viral infections, one cell at a time, by single-cell technologies.Microbes Infect. 2024 Sep-Oct;26(7):105268. doi: 10.1016/j.micinf.2023.105268. Epub 2023 Nov 24. Microbes Infect. 2024. PMID: 38008398 Free PMC article. Review.
-
A Single-Cell Sequencing Guide for Immunologists.Front Immunol. 2018 Oct 23;9:2425. doi: 10.3389/fimmu.2018.02425. eCollection 2018. Front Immunol. 2018. PMID: 30405621 Free PMC article. Review.
Cited by
-
Epigenetic and transcriptomic reprogramming in monocytes of severe COVID-19 patients reflects alterations in myeloid differentiation and the influence of inflammatory cytokines.Genome Med. 2022 Nov 29;14(1):134. doi: 10.1186/s13073-022-01137-4. Genome Med. 2022. PMID: 36443794 Free PMC article.
-
Single-Cell Sequencing Technology in Ruminant Livestock: Challenges and Opportunities.Curr Issues Mol Biol. 2024 May 27;46(6):5291-5306. doi: 10.3390/cimb46060316. Curr Issues Mol Biol. 2024. PMID: 38920988 Free PMC article. Review.
-
Evidence of premature lymphocyte aging in people with low anti-spike antibody levels after BNT162b2 vaccination.iScience. 2022 Oct 21;25(10):105209. doi: 10.1016/j.isci.2022.105209. Epub 2022 Sep 26. iScience. 2022. PMID: 36188190 Free PMC article.
-
Single-cell RNA sequencing reveals rebalancing of immunological response in patients with periodontitis after non-surgical periodontal therapy.J Transl Med. 2022 Nov 3;20(1):504. doi: 10.1186/s12967-022-03702-2. J Transl Med. 2022. PMID: 36329504 Free PMC article.
-
Systems biology models to identify the influence of SARS-CoV-2 infections to the progression of human autoimmune diseases.Inform Med Unlocked. 2022;32:101003. doi: 10.1016/j.imu.2022.101003. Epub 2022 Jul 6. Inform Med Unlocked. 2022. PMID: 35818398 Free PMC article.
References
-
- Browaeys R., Saelens W., Saeys Y. NicheNet: modeling intercellular communication by linking ligands to target genes. Nat. Methods. 2020;17:159–162. - PubMed
Publication types
MeSH terms
Substances
Grants and funding
LinkOut - more resources
Full Text Sources
Other Literature Sources
Medical
