

Evaluating social and spatial inequalities of large scale rapid lateral flow SARS-CoV-2 antigen testing in COVID-19 management: An observational study of Liverpool, UK (November 2020 to January 2021)
- PMID: 34002172
- PMCID: PMC8114854
- DOI: 10.1016/j.lanepe.2021.100107
Evaluating social and spatial inequalities of large scale rapid lateral flow SARS-CoV-2 antigen testing in COVID-19 management: An observational study of Liverpool, UK (November 2020 to January 2021)
Abstract
Background: Large-scale asymptomatic testing of communities in Liverpool (UK) for SARS-CoV-2 was used as a public health tool for containing COVID-19. The aim of the study is to explore social and spatial inequalities in uptake and case-detection of rapid lateral flow SARS-CoV-2 antigen tests (LFTs) offered to people without symptoms of COVID-19.
Methods: Linked pseudonymised records for asymptomatic residents in Liverpool who received a LFT for COVID-19 between 6th November 2020 to 31st January 2021 were accessed using the Combined Intelligence for Population Health Action resource. Bayesian Hierarchical Poisson Besag, York, and Mollié models were used to estimate ecological associations for uptake and positivity of testing.
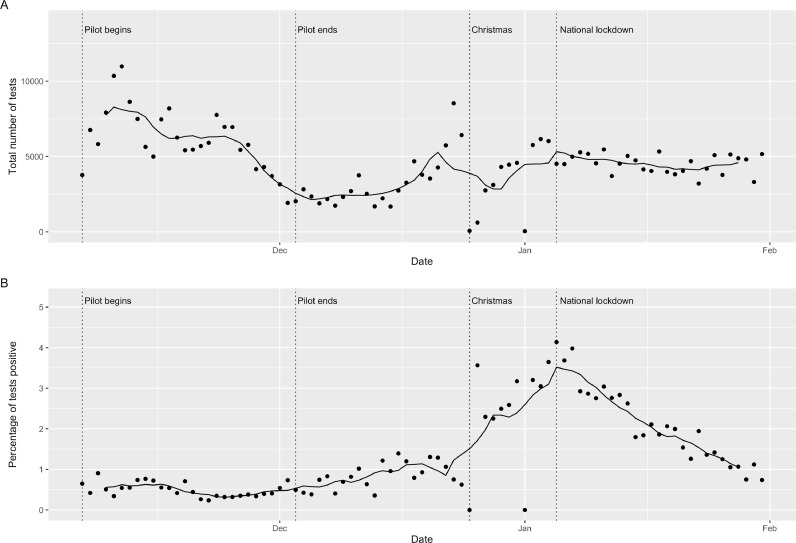
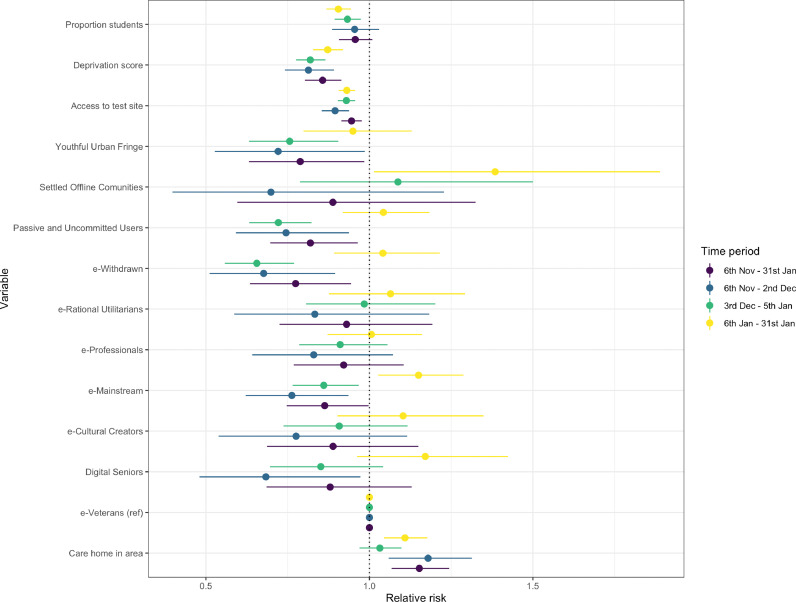
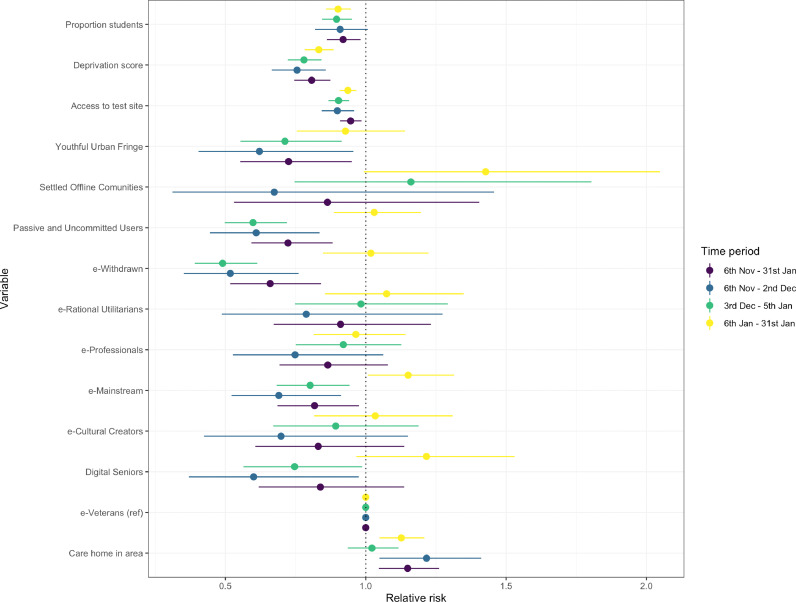
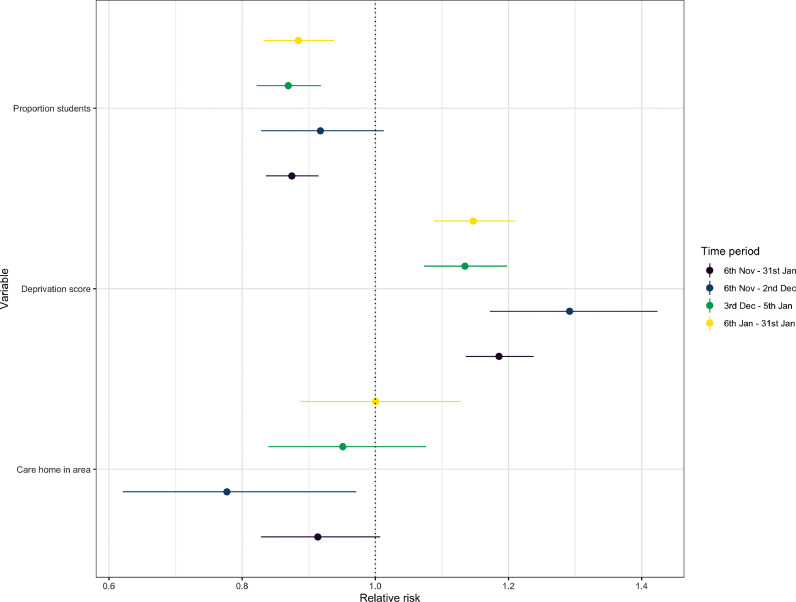
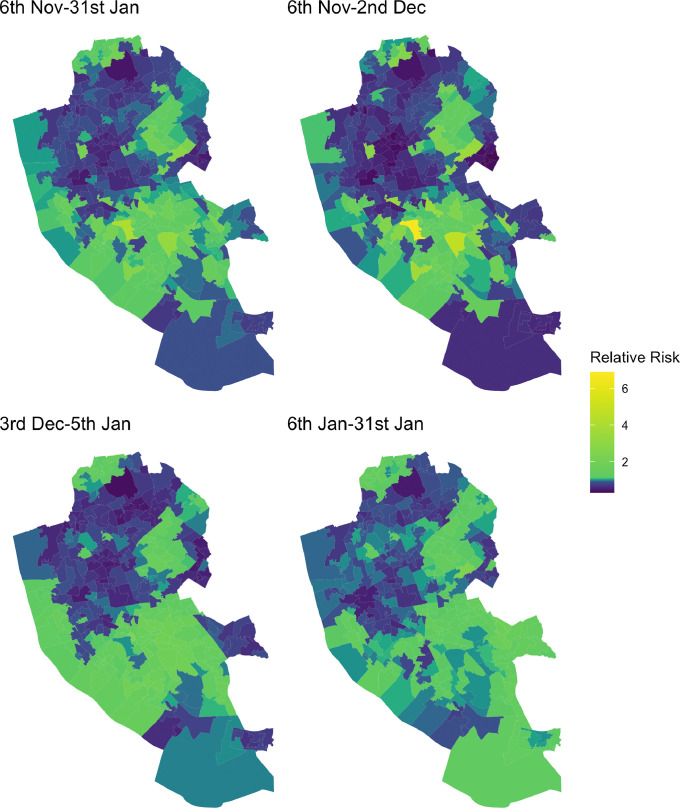
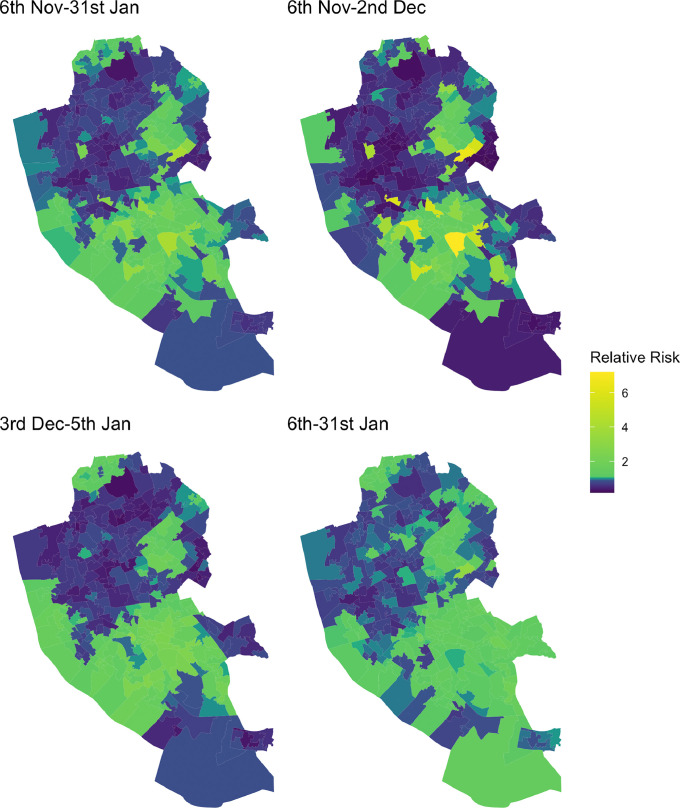
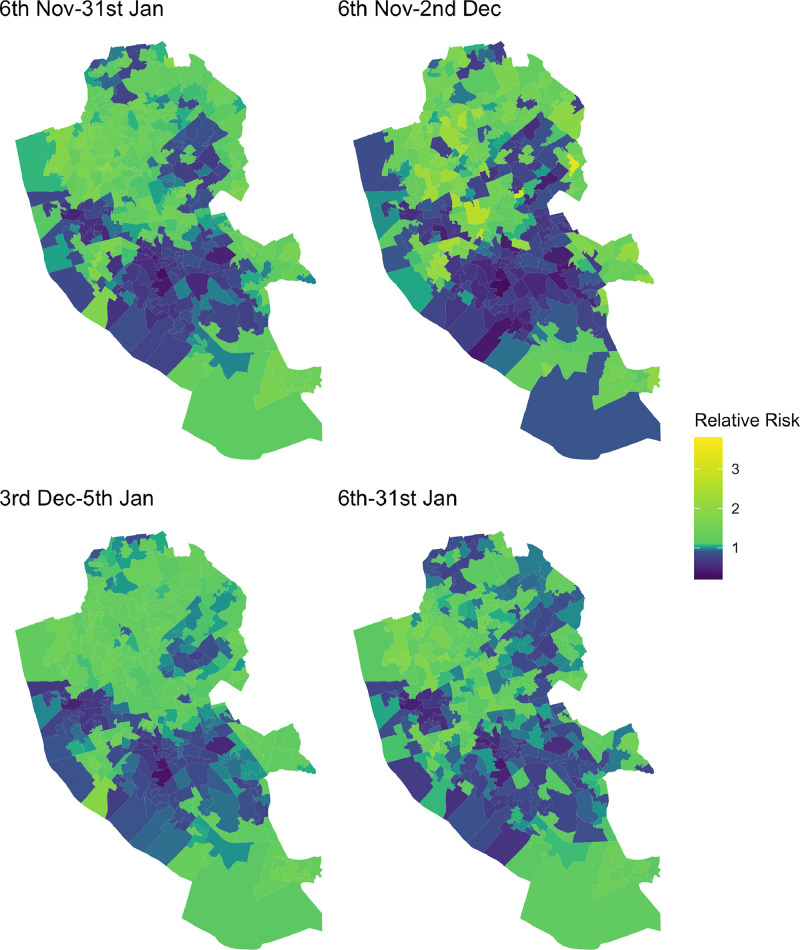
Findings: 214 525 residents (43%) received a LFT identifying 5192 individuals as positive cases of COVID-19 (1.3% of tests were positive). Uptake was highest in November when there was military assistance. High uptake was observed again in the week preceding Christmas and was sustained into a national lockdown. Overall uptake were lower among males (e.g. 40% uptake over the whole period), Black Asian and other Minority Ethnic groups (e.g. 27% uptake for 'Mixed' ethnicity) and in the most deprived areas (e.g. 32% uptake in most deprived areas). These population groups were also more likely to have received positive tests for COVID-19. Models demonstrated that uptake and repeat testing were lower in areas of higher deprivation, areas located further from test sites and areas containing populations less confident in the using Internet technologies. Positive tests were spatially clustered in deprived areas.
Interpretation: Large-scale voluntary asymptomatic community testing saw social, ethnic, digital and spatial inequalities in uptake. COVID-19 testing and support to isolate need to be more accessible to the vulnerable communities most impacted by the pandemic, including non-digital means of access.
Funding: Department of Health and Social Care (UK) and Economic and Social Research Council.
© 2021 The Author(s).
Conflict of interest statement
IB and SS report grants from Department of Health and Social Care during the conduct of the study. IB declares grants from NIHR, personal fees and other from AstraZeneca, outside the submitted work. SS research is supported by a grant from Wellcome Trust. No other interests to declare.
Figures
References
-
- Department of Health and Social Care . 2020. Liverpool to be regularly tested for coronavirus in first whole city testing pilot.https://www.gov.uk/government/news/liverpool-to-be-regularly-tested-for-...
-
- McLaren L, McIntyre L, Kirkpatrick S. Rose's population strategy of prevention need not increase social inequalities in health. Int J Epidemiol. 2010;39:372–377. - PubMed
Grants and funding
LinkOut - more resources
Full Text Sources
Other Literature Sources
Miscellaneous
