

High glucose-induced Smad3 linker phosphorylation and CCN2 expression are inhibited by dapagliflozin in a diabetic tubule epithelial cell model
- PMID: 34003249
- PMCID: PMC8220447
- DOI: 10.1042/BSR20203947
High glucose-induced Smad3 linker phosphorylation and CCN2 expression are inhibited by dapagliflozin in a diabetic tubule epithelial cell model
Abstract
Background: In the kidney glucose is freely filtered by the glomerulus and, mainly, reabsorbed by sodium glucose cotransporter 2 (SGLT2) expressed in the early proximal tubule. Human proximal tubule epithelial cells (PTECs) undergo pathological and fibrotic changes seen in diabetic kidney disease (DKD) in response to elevated glucose. We developed a specific in vitro model of DKD using primary human PTECs with exposure to high D-glucose and TGF-β1 and propose a role for SGLT2 inhibition in regulating fibrosis.
Methods: Western blotting was performed to detect cellular and secreted proteins as well as phosphorylated intracellular signalling proteins. qPCR was used to detect CCN2 RNA. Gamma glutamyl transferase (GT) activity staining was performed to confirm PTEC phenotype. SGLT2 and ERK inhibition on high D-glucose, 25 mM, and TGF-β1, 0.75 ng/ml, treated cells was explored using dapagliflozin and U0126, respectively.
Results: Only the combination of high D-glucose and TGF-β1 treatment significantly up-regulated CCN2 RNA and protein expression. This increase was significantly ameliorated by dapagliflozin. High D-glucose treatment raised phospho ERK which was also inhibited by dapagliflozin. TGF-β1 increased cellular phospho SSXS Smad3 serine 423 and 425, with and without high D-glucose. Glucose alone had no effect. Smad3 serine 204 phosphorylation was significantly raised by a combination of high D-glucose+TGF-β1; this rise was significantly reduced by both SGLT2 and MEK inhibition.
Conclusions: We show that high D-glucose and TGF-β1 are both required for CCN2 expression. This treatment also caused Smad3 linker region phosphorylation. Both outcomes were inhibited by dapagliflozin. We have identified a novel SGLT2 -ERK mediated promotion of TGF-β1/Smad3 signalling inducing a pro-fibrotic growth factor secretion. Our data evince support for substantial renoprotective benefits of SGLT2 inhibition in the diabetic kidney.
Keywords: Dapagliflozin; Diabetic Kidney Disease; Fibrosis; Glucose; Glucose Transporters; Smad3.
© 2021 The Author(s).
Conflict of interest statement
The authors declare that there are no competing interests associated with the manuscript.
Figures
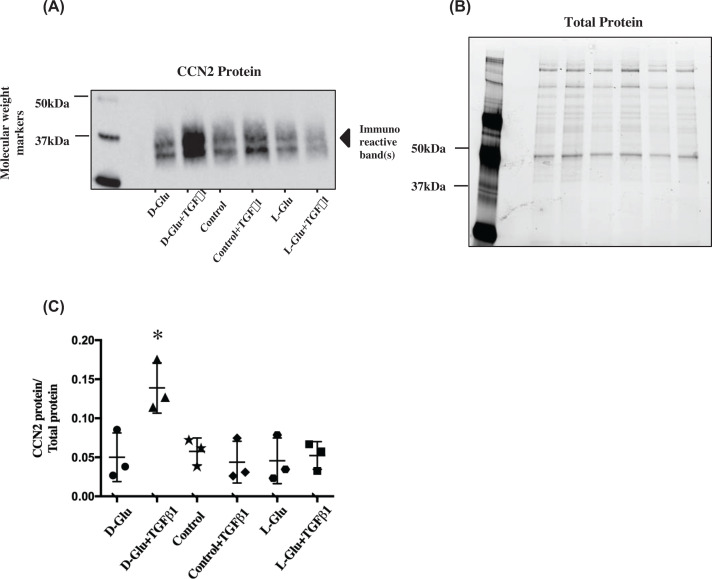
 = L-Glu, black squares ▓ = L-Glu + TGF-β1. Error bars indicate SD. Quantification of all proteins in these figures were a result of the light generated by the detection antibody indexed to total protein loaded in each sample. Control = 7 mM D-glucose, Control + TGF-β1 = 7 mM D-glucose + 0.75 ng/ml TGF-β1, D-Glu = 7 mM D-glucose + 18 mM D-glucose, L-Glu = 7 mM D-glucose + 18 mM L-glucose, D-Glu + TGF-β1 = 7 mM D-glucose + 18 mM D-glucose + 0.75 ng/ml TGF-β1, L-Glu + TGF-β1 = 7 mM D-glucose + 18 mM L-glucose + 0.75 ng/ml TGF-β1. This legend key is applicable to all subsequent figures.
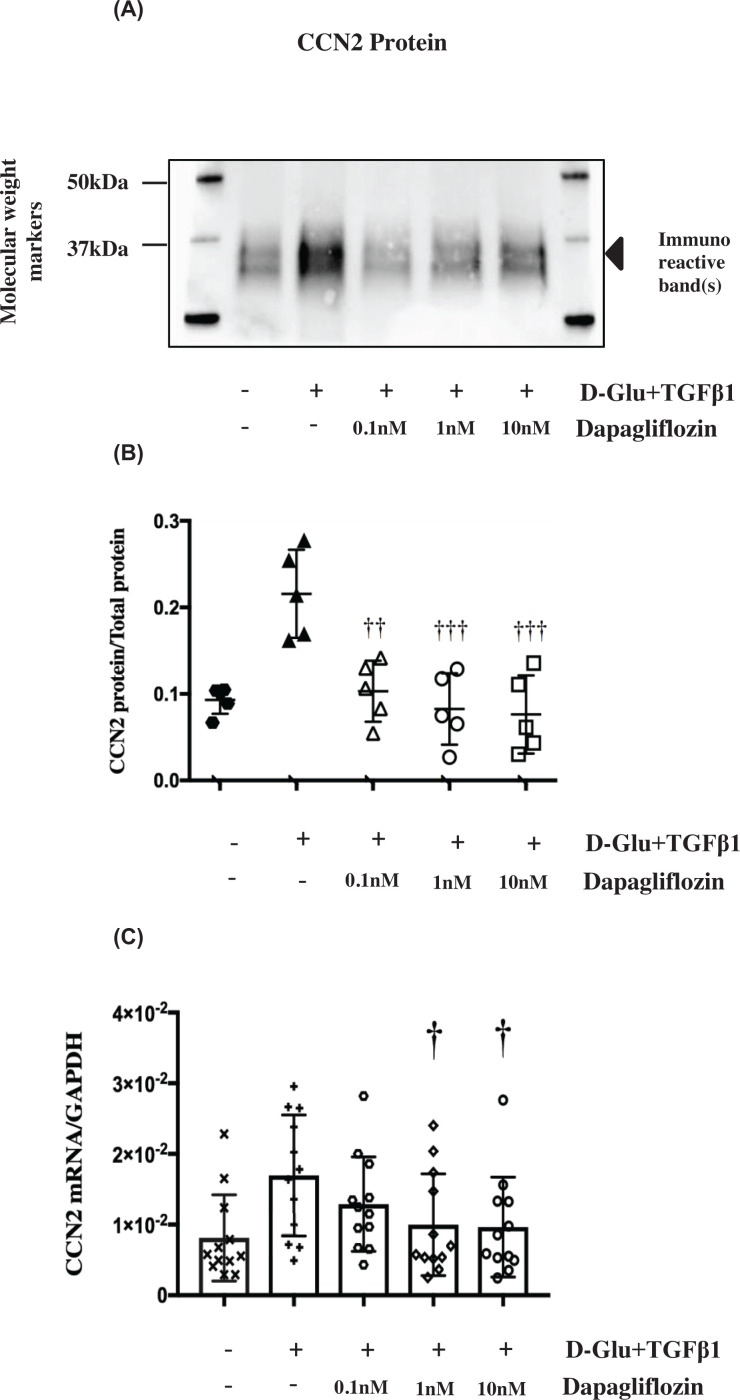 = control, upward black triangles ▲ = D-Glu+TGF-β1, white triangles Δ = D-Glu+TGF-β1+0.1 nM dapa, white circles ○ = D-Glu+TGF-β1+1 nM dapa, white squares □ = D-Glu+TGF-β1+ 10 nM dapa. (D) Effects of 0.1, 1 and 10 nM dapagliflozin on up-regulated CCN2 mRNA (ΔCt of CCN2 to GAPDH) in PTECs. Dapagliflozin at 1 and 10 nM significantly attenuated CCN2 relative mRNA abundance to control levels. †P<0.05 compared with D-Glu+TGF-β1. Black X X = control, black cross + = D-Glu+TGF-β1, white hexagons
  = D-Glu+TGF-β1+0.1 nM dapa, white diamonds ◊ = D-Glu+TGF-β1+1 nM dapa, white circles ○ = D-glu+TGF-β1+ 10 nM dapa, n=12. Error bars indicate SD. Quantification of all proteins in these figures were a result of the light generated by the detection antibody indexed to total protein loaded in each sample. Control = 7 mM D-glucose, Control + TGF-β1 = 7 mM D-glucose + 0.75 ng/ml TGF-β1, D-Glu = 7 mM D-glucose + 18 mM D-glucose, L-Glu = 7 mM D-glucose + 18 mM L-glucose, D-Glu+TGF-β1 = 7 mM D-glucose + 18 mM D-glucose + 0.75 ng/ml TGF-β1, L-Glu + TGF-β1 = 7 mM D-glucose + 18 mM L-glucose + 0.75 ng/ml TGF-β1. This legend key is applicable to all subsequent figures.
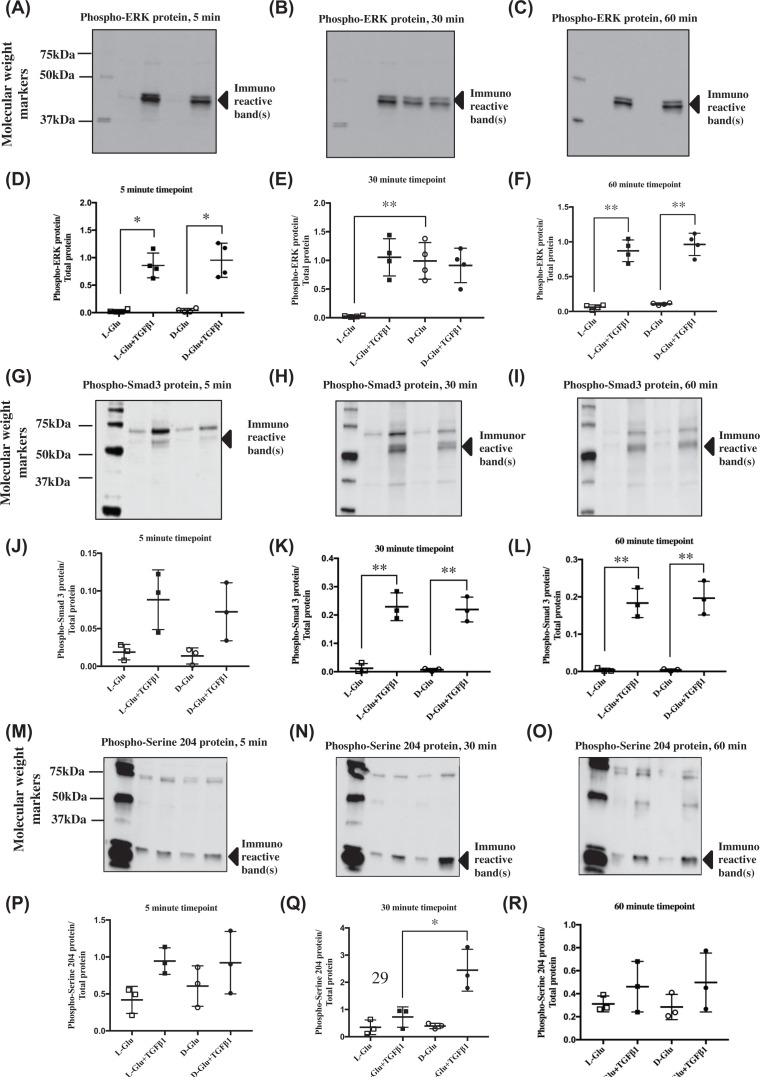
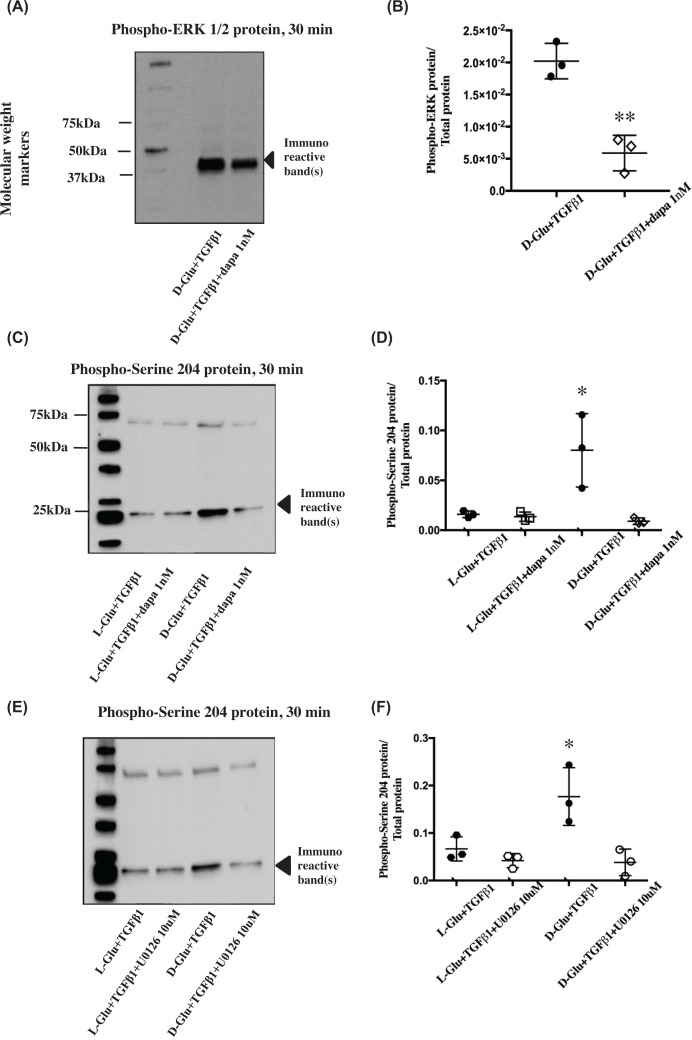 = L-Glu + TGF-β1, white hexagons = L-Glu + TGF-β1 + U0126, black circles ● = D-Glu + TGF-β1, white circles ○ = D-Glu + TGF-β1 + U0126, white squares □ = L-Glu + TGF-β1, white diamonds ◊ = D-Glu + TGF-β1 + dapa 1 nM. Quantification of all phosphorylated proteins in these figures were a result of the light generated by the detection antibody indexed to total protein loaded in each sample.
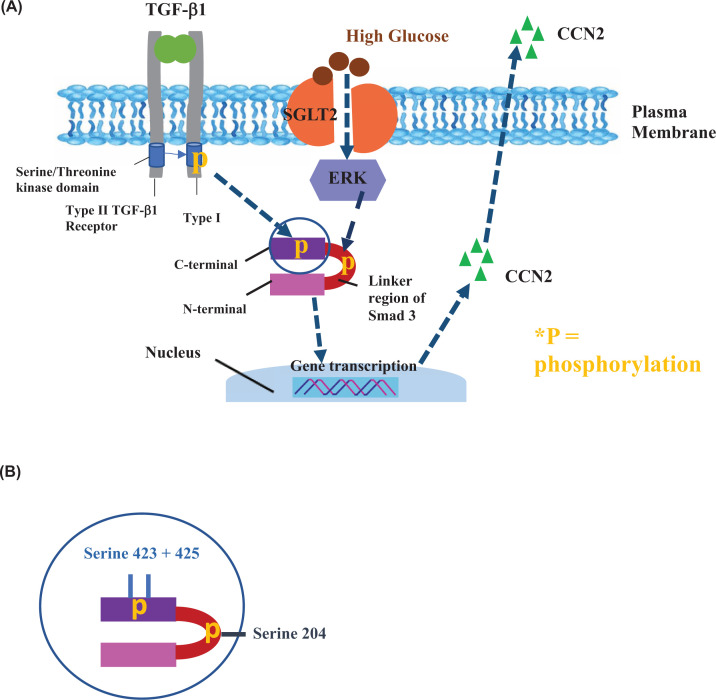
Similar articles
-
Effects of SGLT2 inhibition in human kidney proximal tubular cells--renoprotection in diabetic nephropathy?PLoS One. 2013;8(2):e54442. doi: 10.1371/journal.pone.0054442. Epub 2013 Feb 4. PLoS One. 2013. PMID: 23390498 Free PMC article.
-
TGF-beta1-induced connective tissue growth factor (CCN2) expression in human renal proximal tubule epithelial cells requires Ras/MEK/ERK and Smad signalling.Nephron Exp Nephrol. 2005;100(4):e156-65. doi: 10.1159/000085445. Epub 2005 Apr 25. Nephron Exp Nephrol. 2005. PMID: 15855807
-
A unifying model of glucotoxicity in human renal proximal tubular epithelial cells and the effect of the SGLT2 inhibitor dapagliflozin.Int Urol Nephrol. 2020 Jun;52(6):1179-1189. doi: 10.1007/s11255-020-02481-3. Epub 2020 May 2. Int Urol Nephrol. 2020. PMID: 32361978
-
Astragaloside IV attenuates high glucose-induced EMT by inhibiting the TGF-β/Smad pathway in renal proximal tubular epithelial cells.Biosci Rep. 2020 Jun 26;40(6):BSR20190987. doi: 10.1042/BSR20190987. Biosci Rep. 2020. PMID: 32515466 Free PMC article.
-
Dapagliflozin, SGLT2 Inhibitor, Attenuates Renal Ischemia-Reperfusion Injury.PLoS One. 2016 Jul 8;11(7):e0158810. doi: 10.1371/journal.pone.0158810. eCollection 2016. PLoS One. 2016. PMID: 27391020 Free PMC article.
Cited by
-
Bioinformatics analysis combined with experimental validation reveals the novel mechanisms of multi-targets of dapagliflozin attenuating diabetic liver injury.Front Endocrinol (Lausanne). 2025 May 12;16:1519153. doi: 10.3389/fendo.2025.1519153. eCollection 2025. Front Endocrinol (Lausanne). 2025. PMID: 40438398 Free PMC article.
-
Signaling Pathways of Podocyte Injury in Diabetic Kidney Disease and the Effect of Sodium-Glucose Cotransporter 2 Inhibitors.Cells. 2022 Dec 3;11(23):3913. doi: 10.3390/cells11233913. Cells. 2022. PMID: 36497173 Free PMC article. Review.
-
Developments in the connection between epithelial‑mesenchymal transition and endoplasmic reticulum stress (Review).Int J Mol Med. 2025 Jul;56(1):102. doi: 10.3892/ijmm.2025.5543. Epub 2025 May 9. Int J Mol Med. 2025. PMID: 40341397 Free PMC article. Review.
References
Publication types
MeSH terms
Substances
Grants and funding
LinkOut - more resources
Full Text Sources
Other Literature Sources
Medical
Miscellaneous