. 2021 Oct;65(4):390-402.
doi: 10.1165/rcmb.2020-0492OC.

Hepatocyte HIF-1 and Intermittent Hypoxia Independently Impact Liver Fibrosis in Murine Nonalcoholic Fatty Liver Disease

Affiliations

Hepatocyte HIF-1 and Intermittent Hypoxia Independently Impact Liver Fibrosis in Murine Nonalcoholic Fatty Liver Disease

Omar A Mesarwi et al. Am J Respir Cell Mol Biol. 2021 Oct.

Abstract

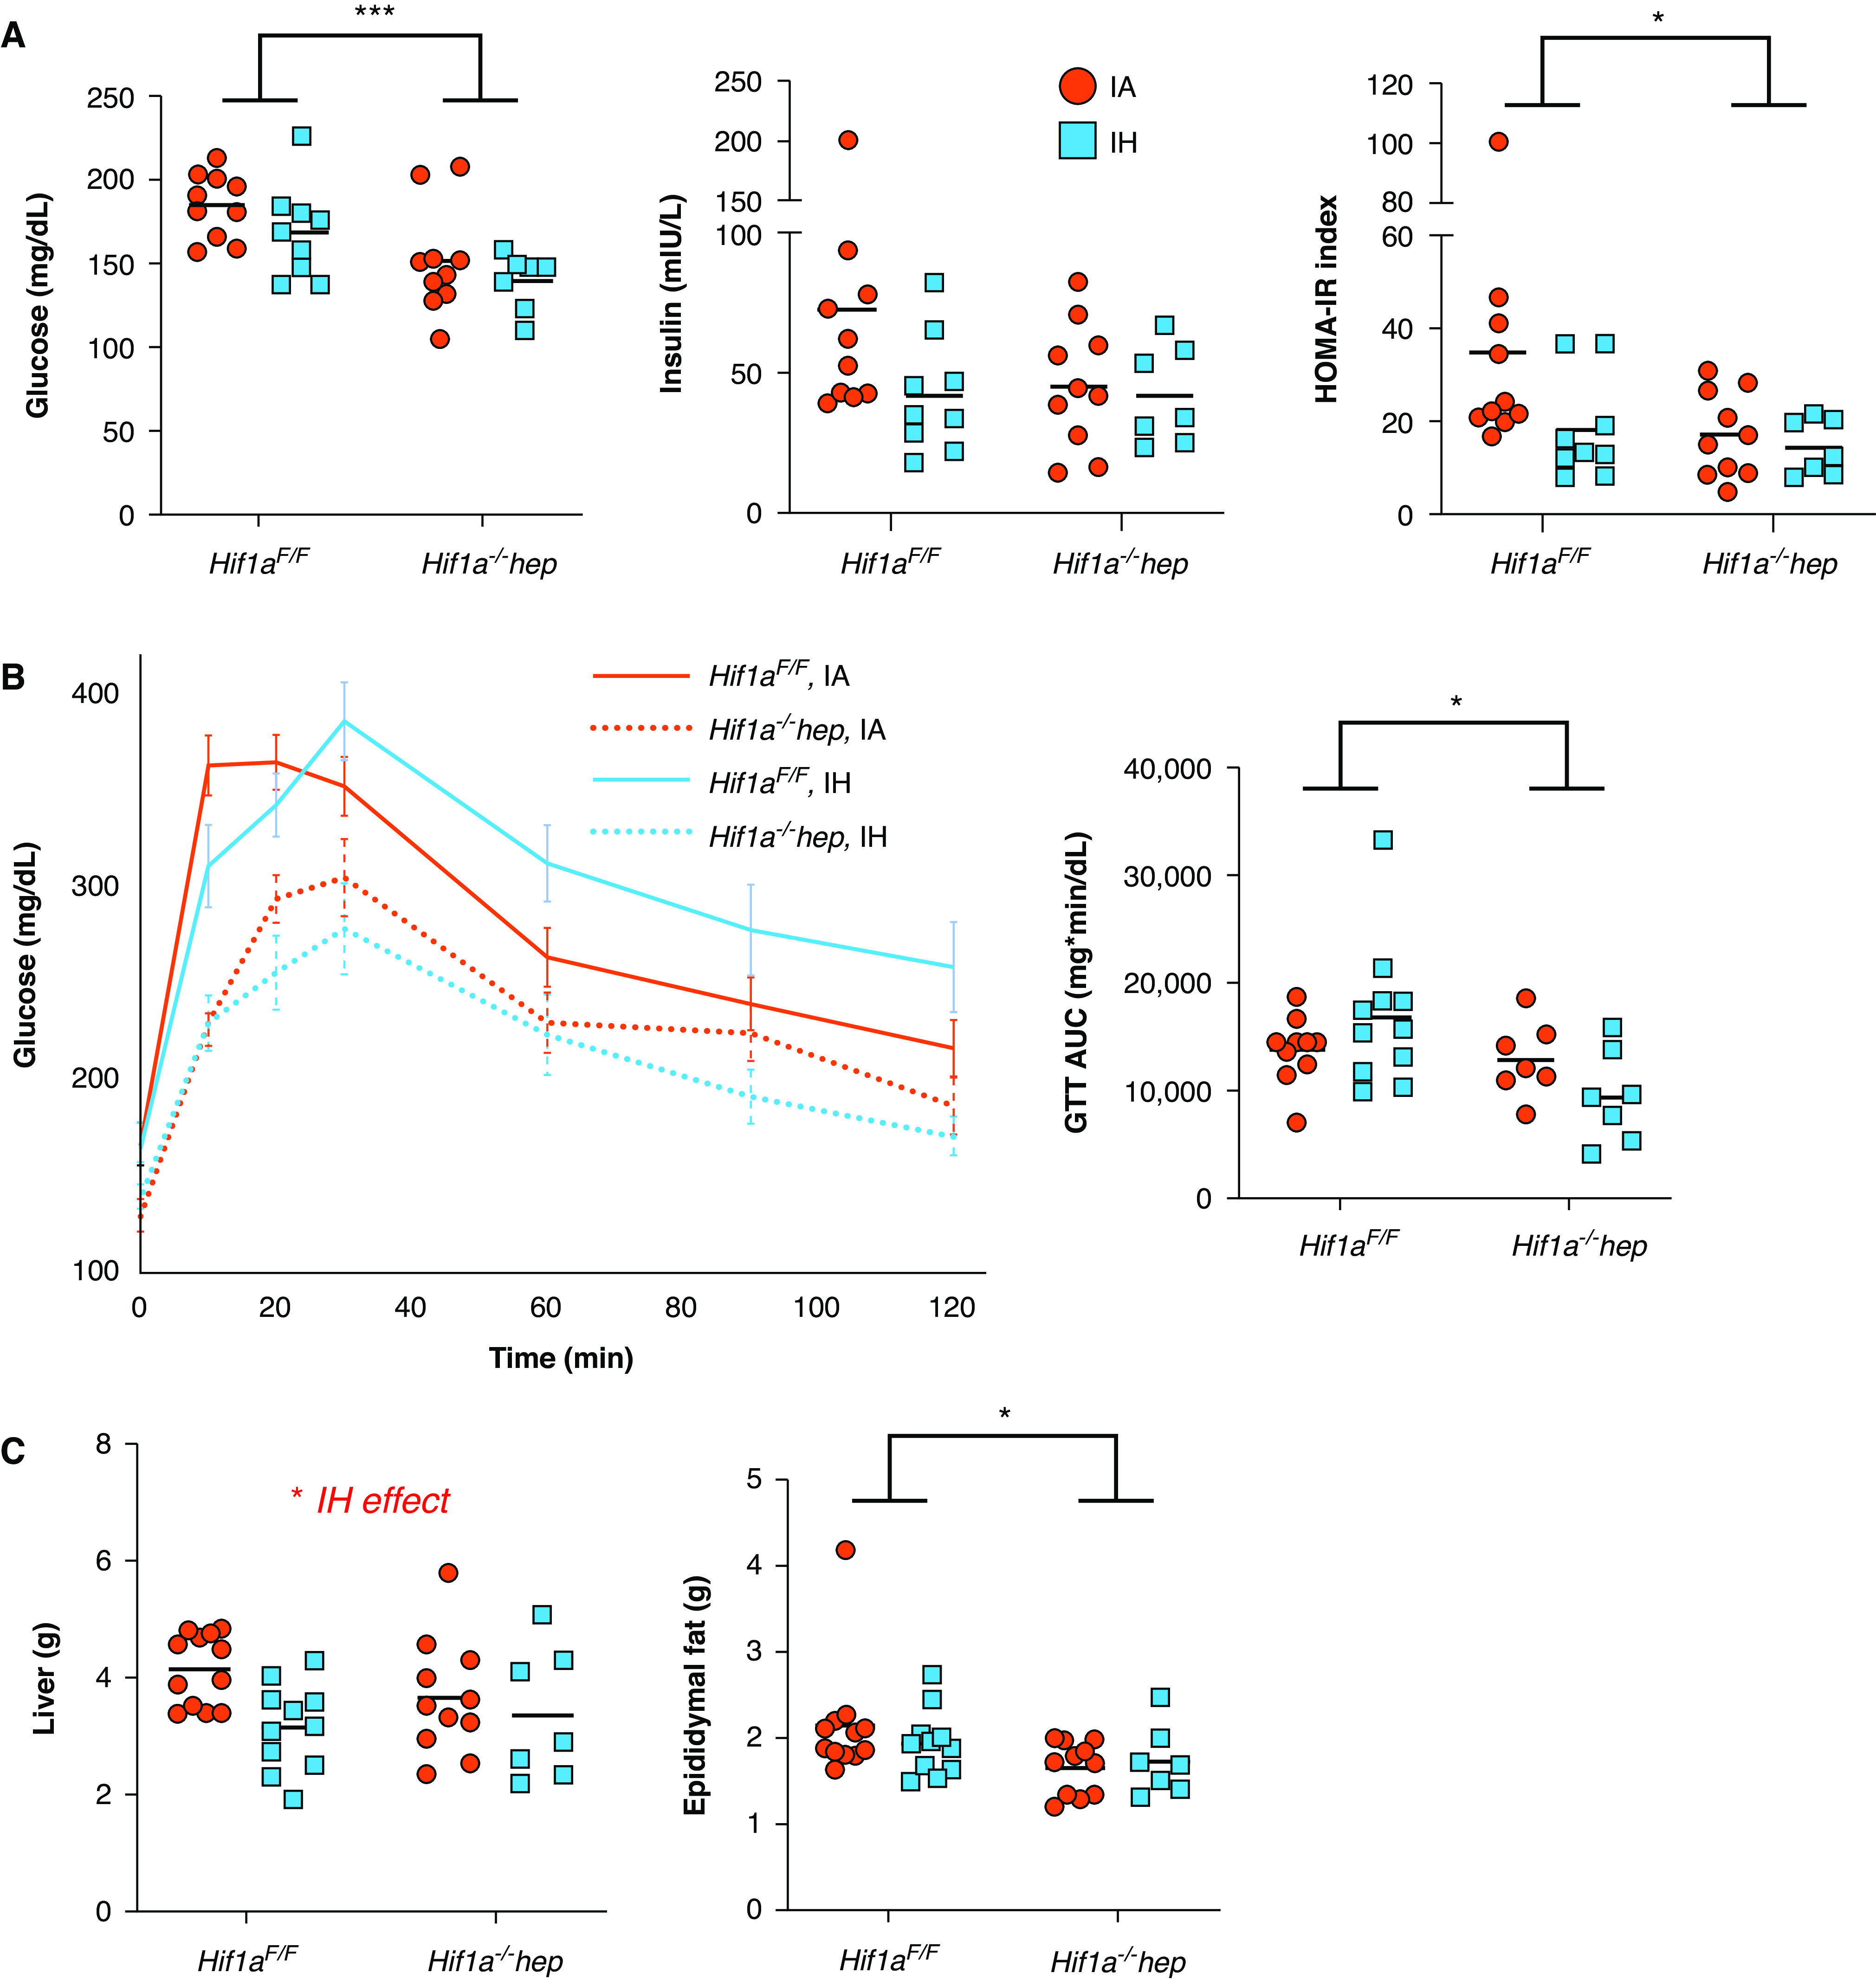
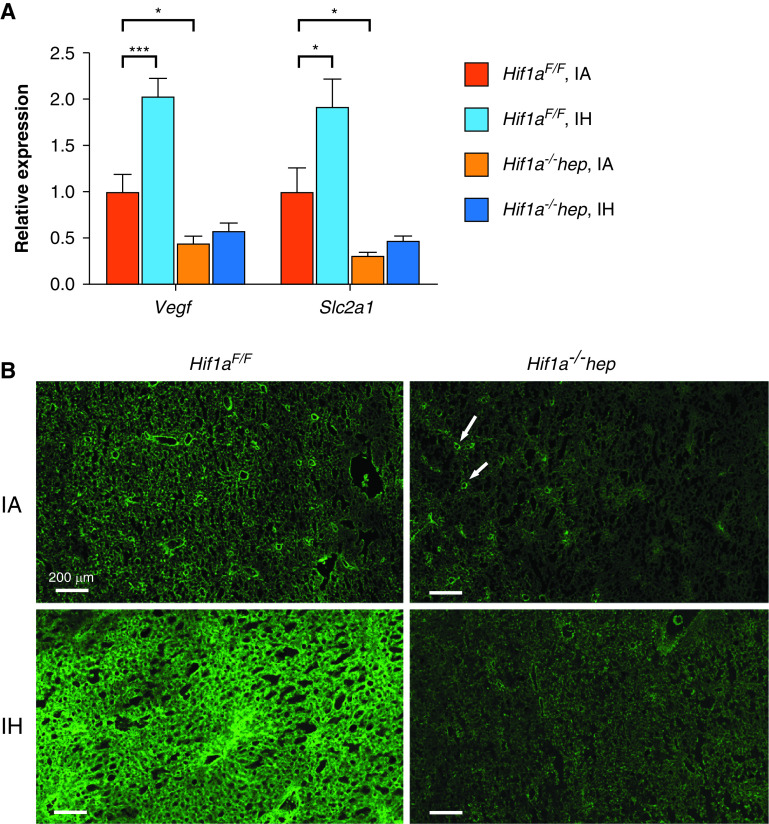
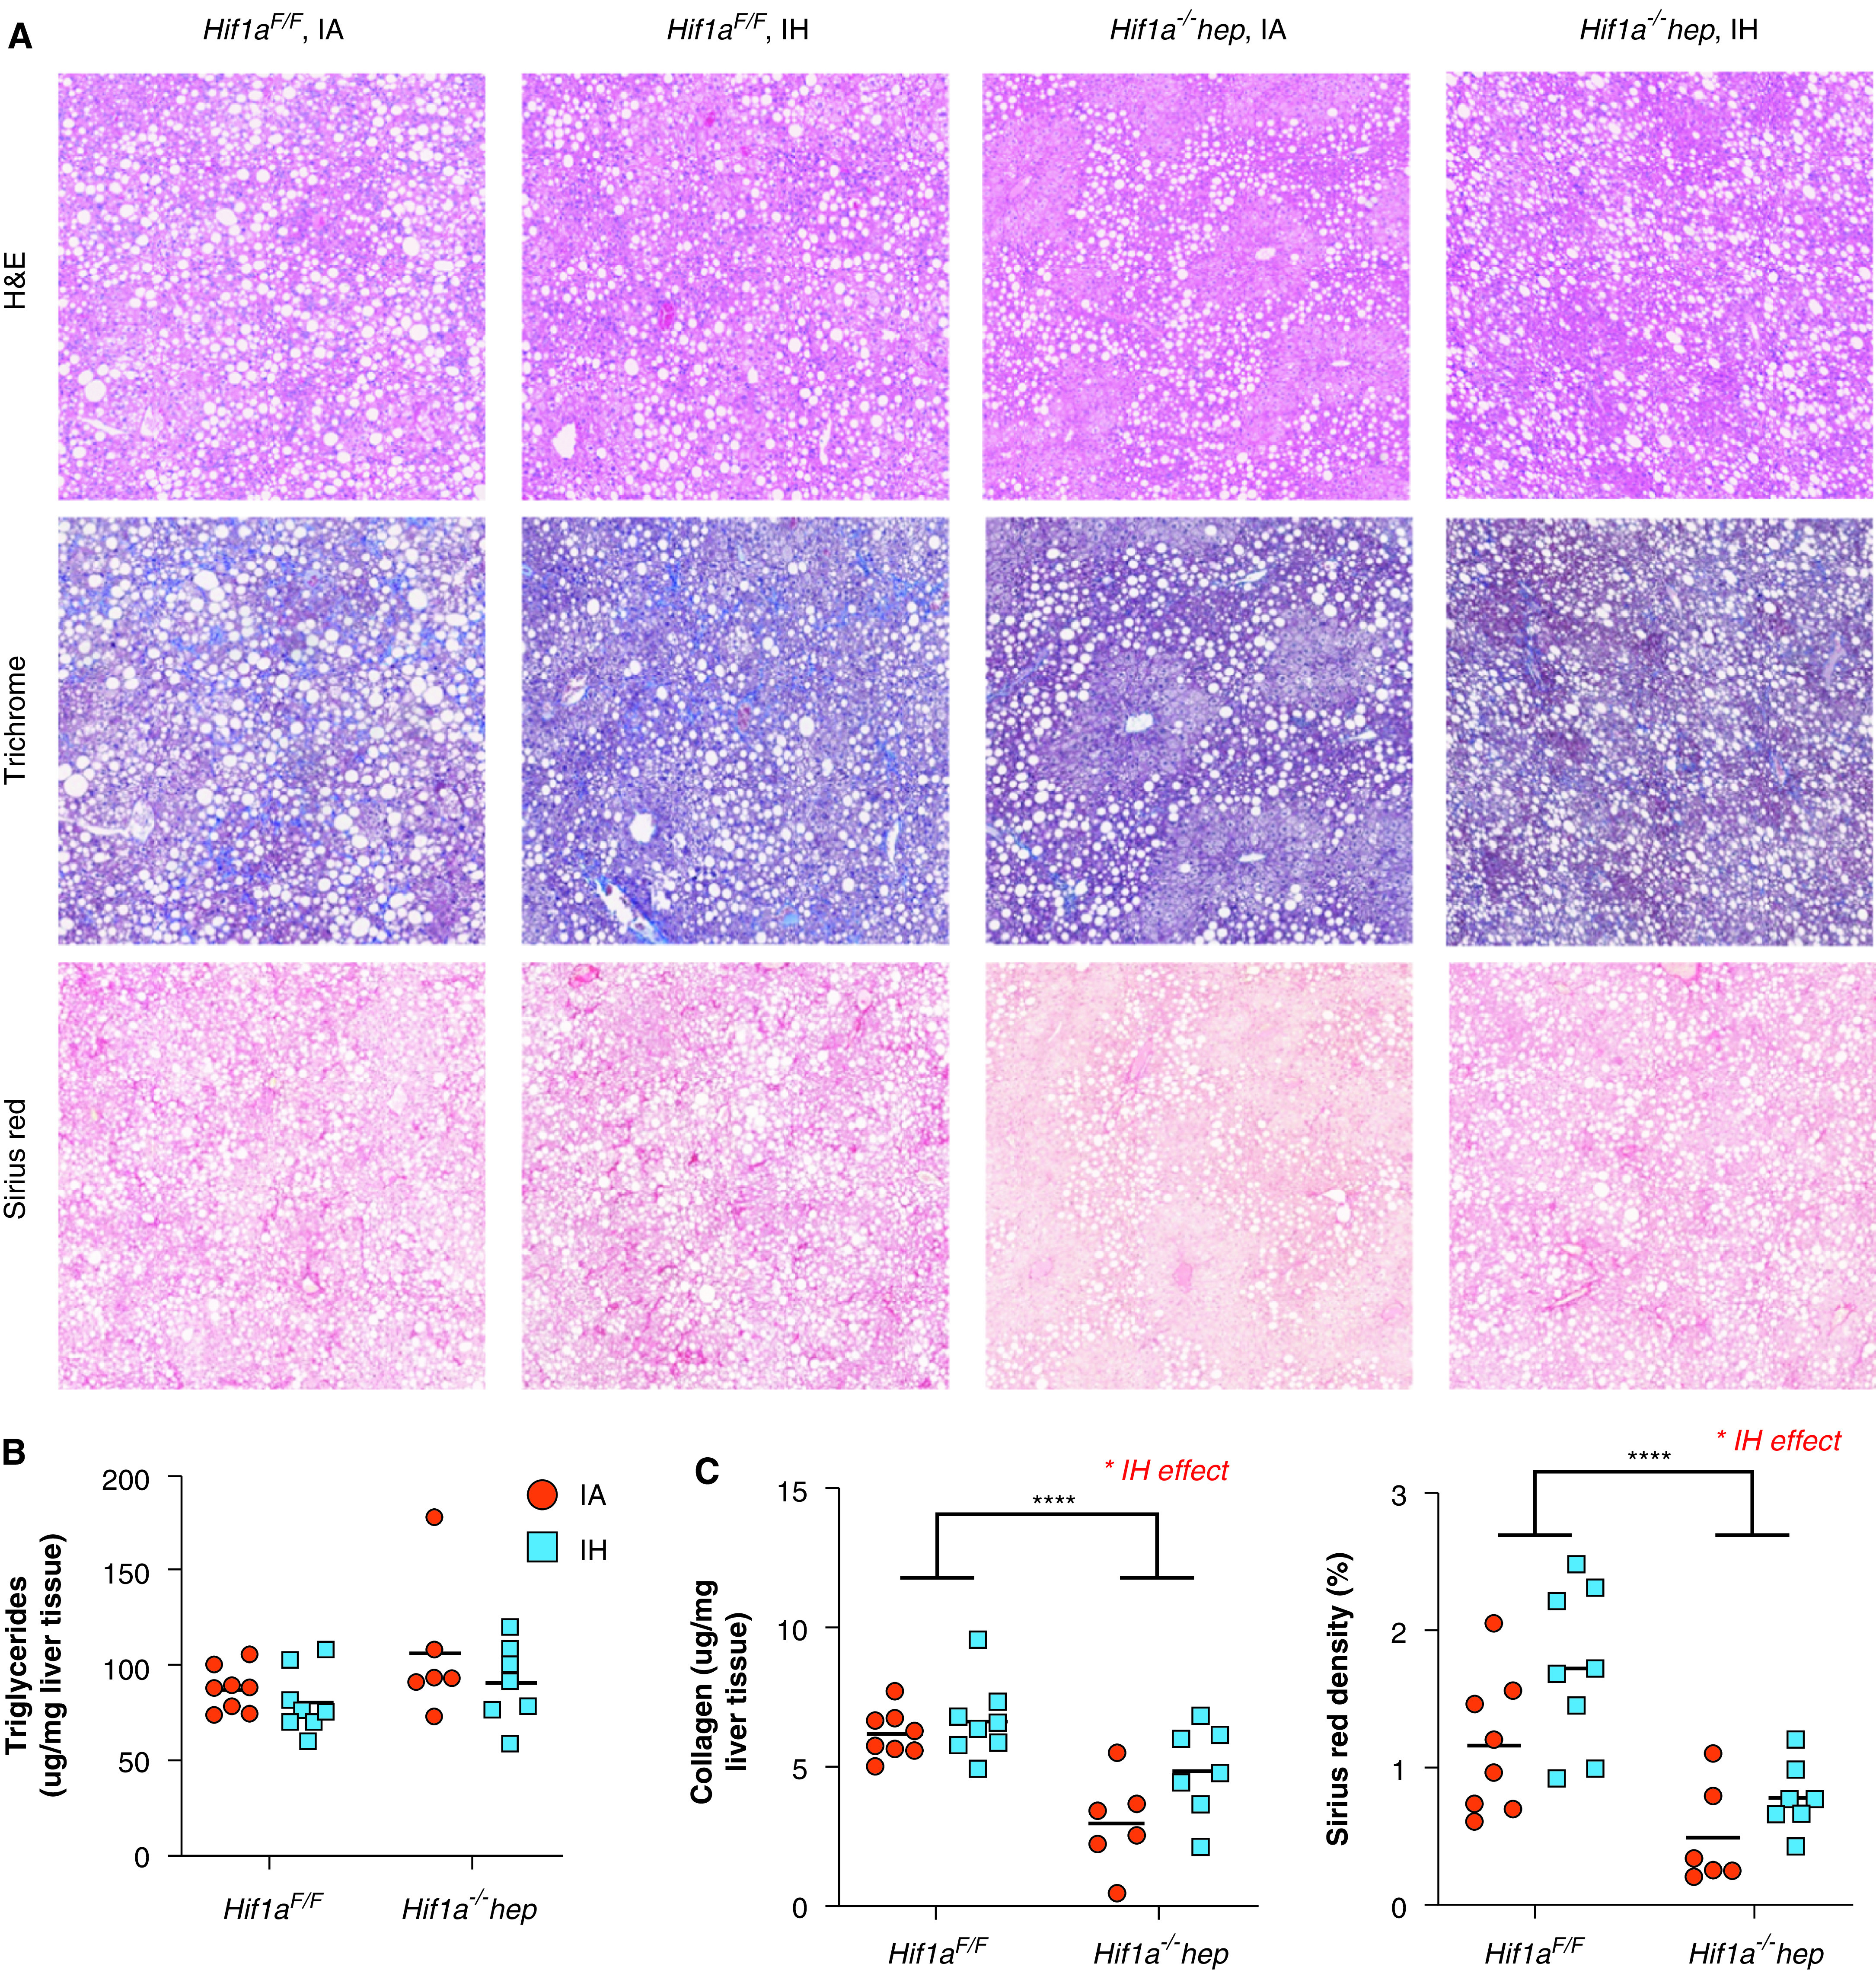
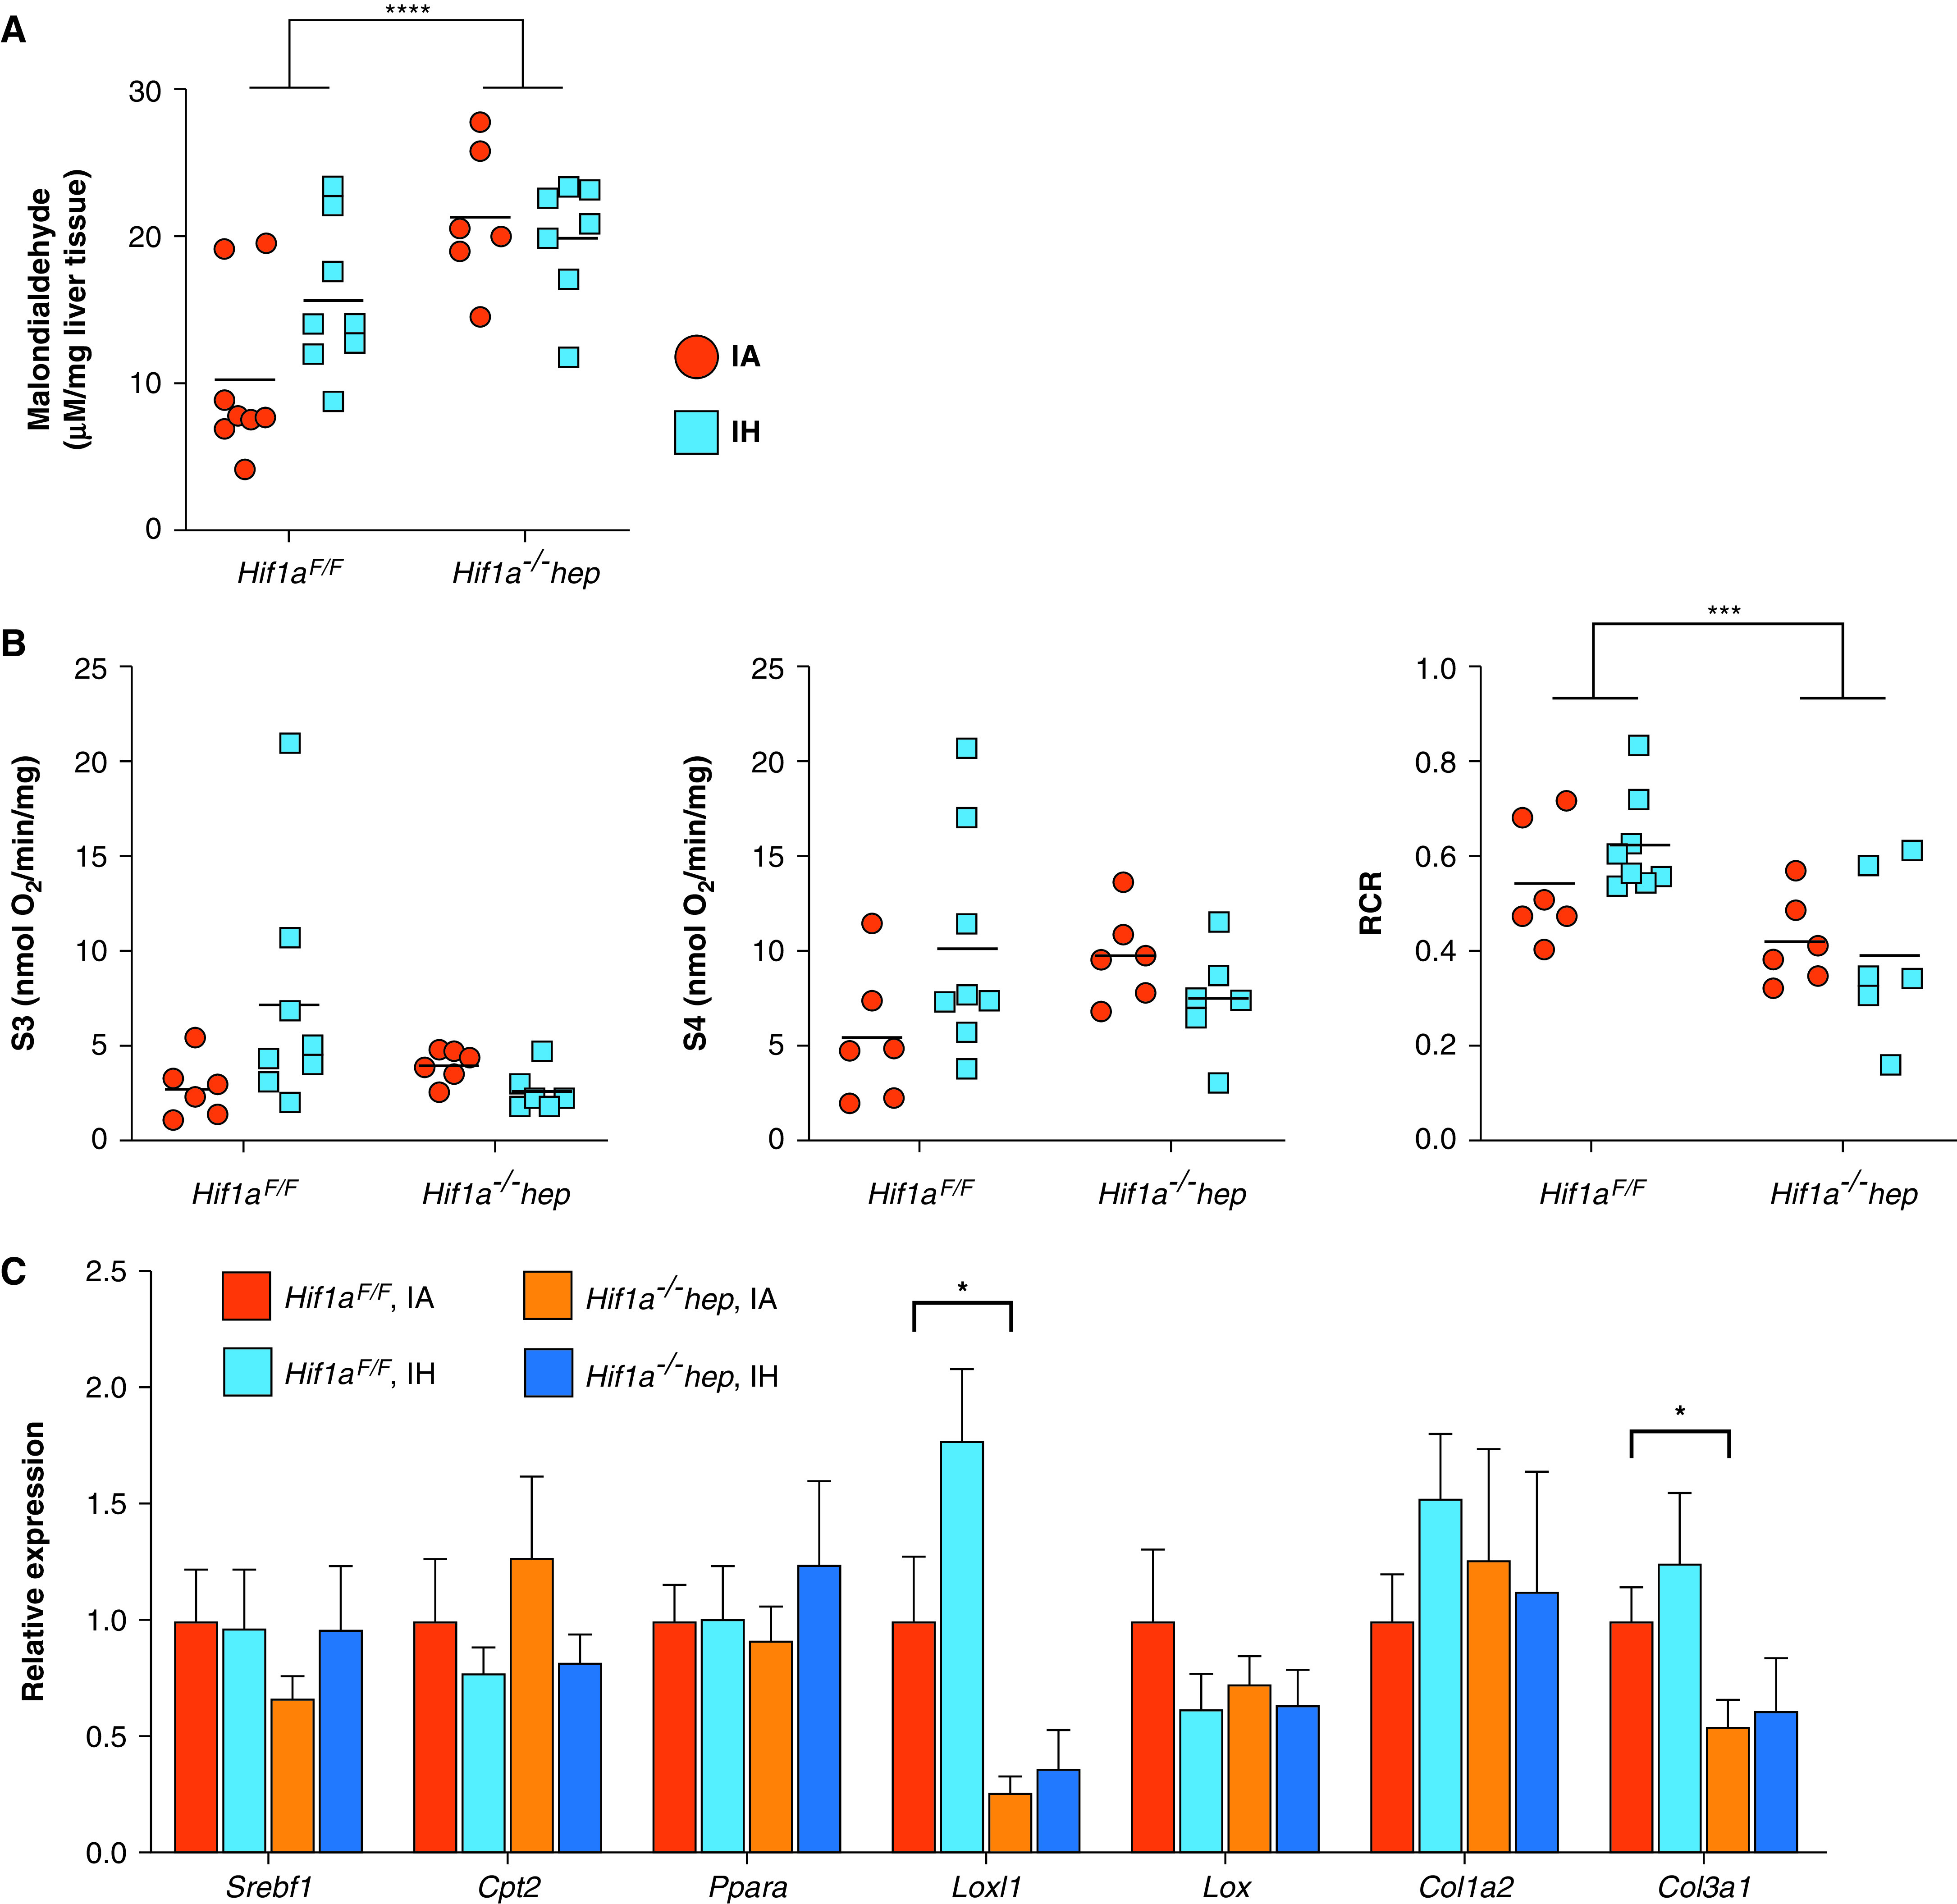
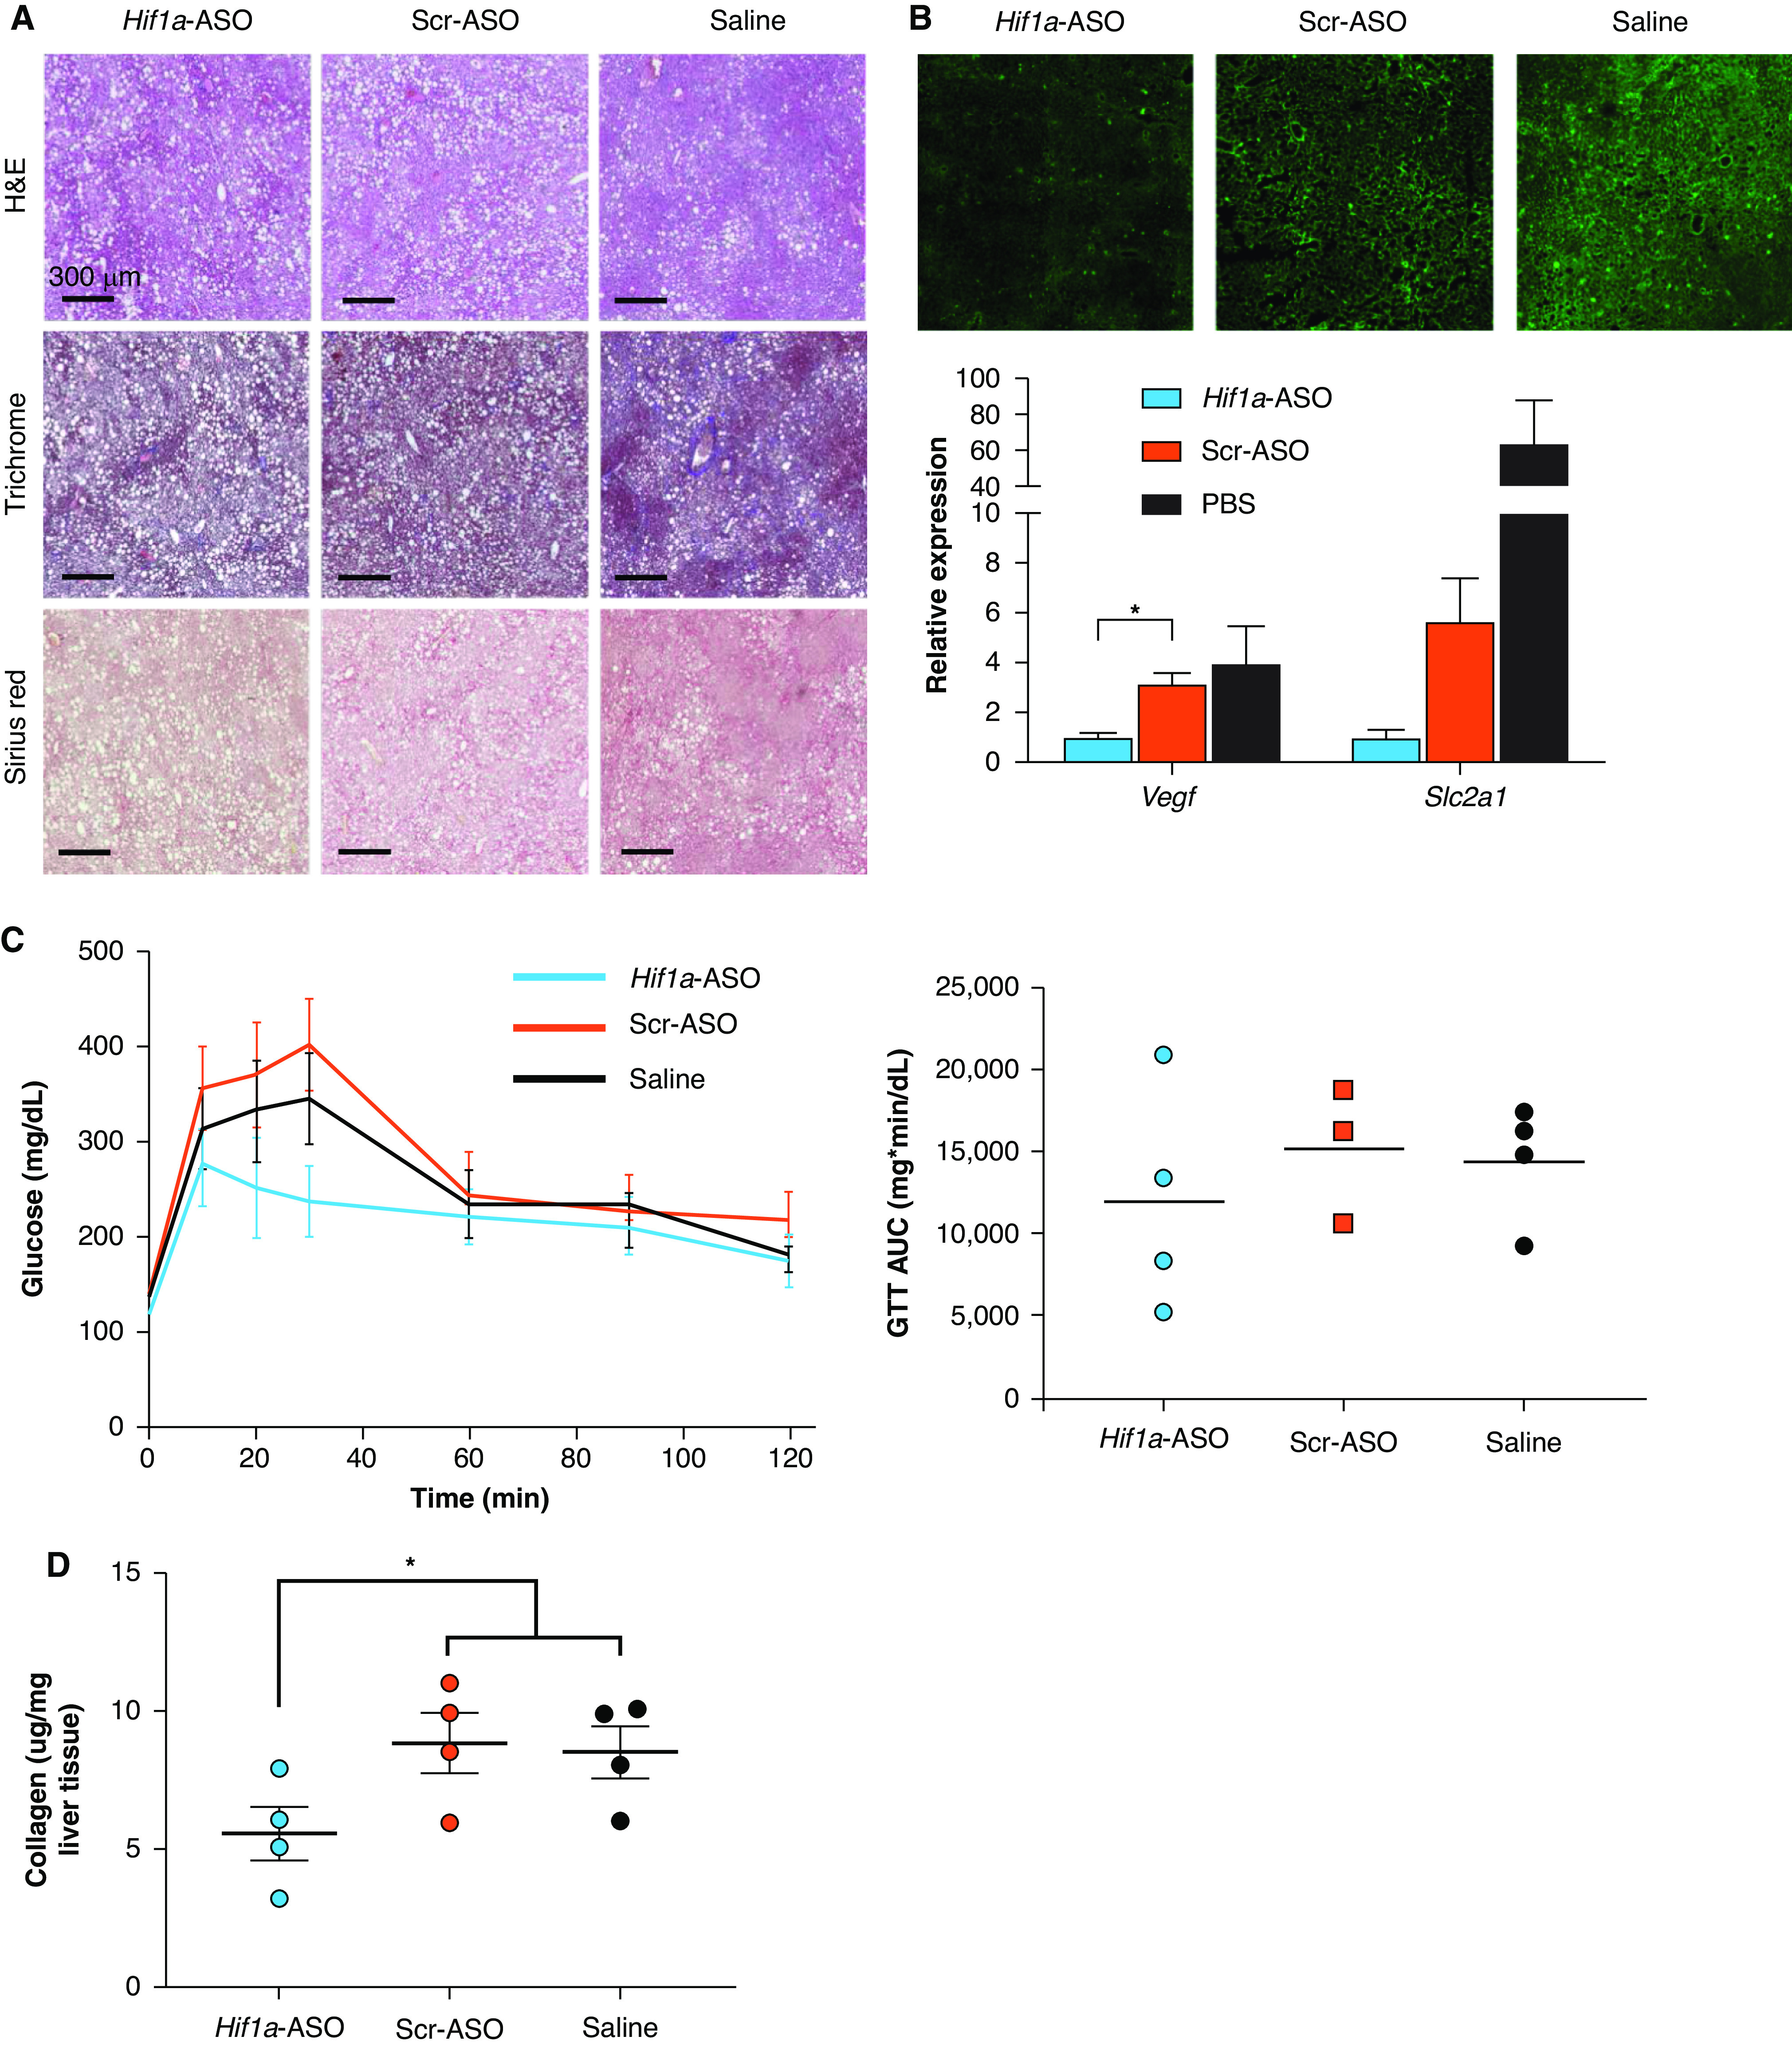
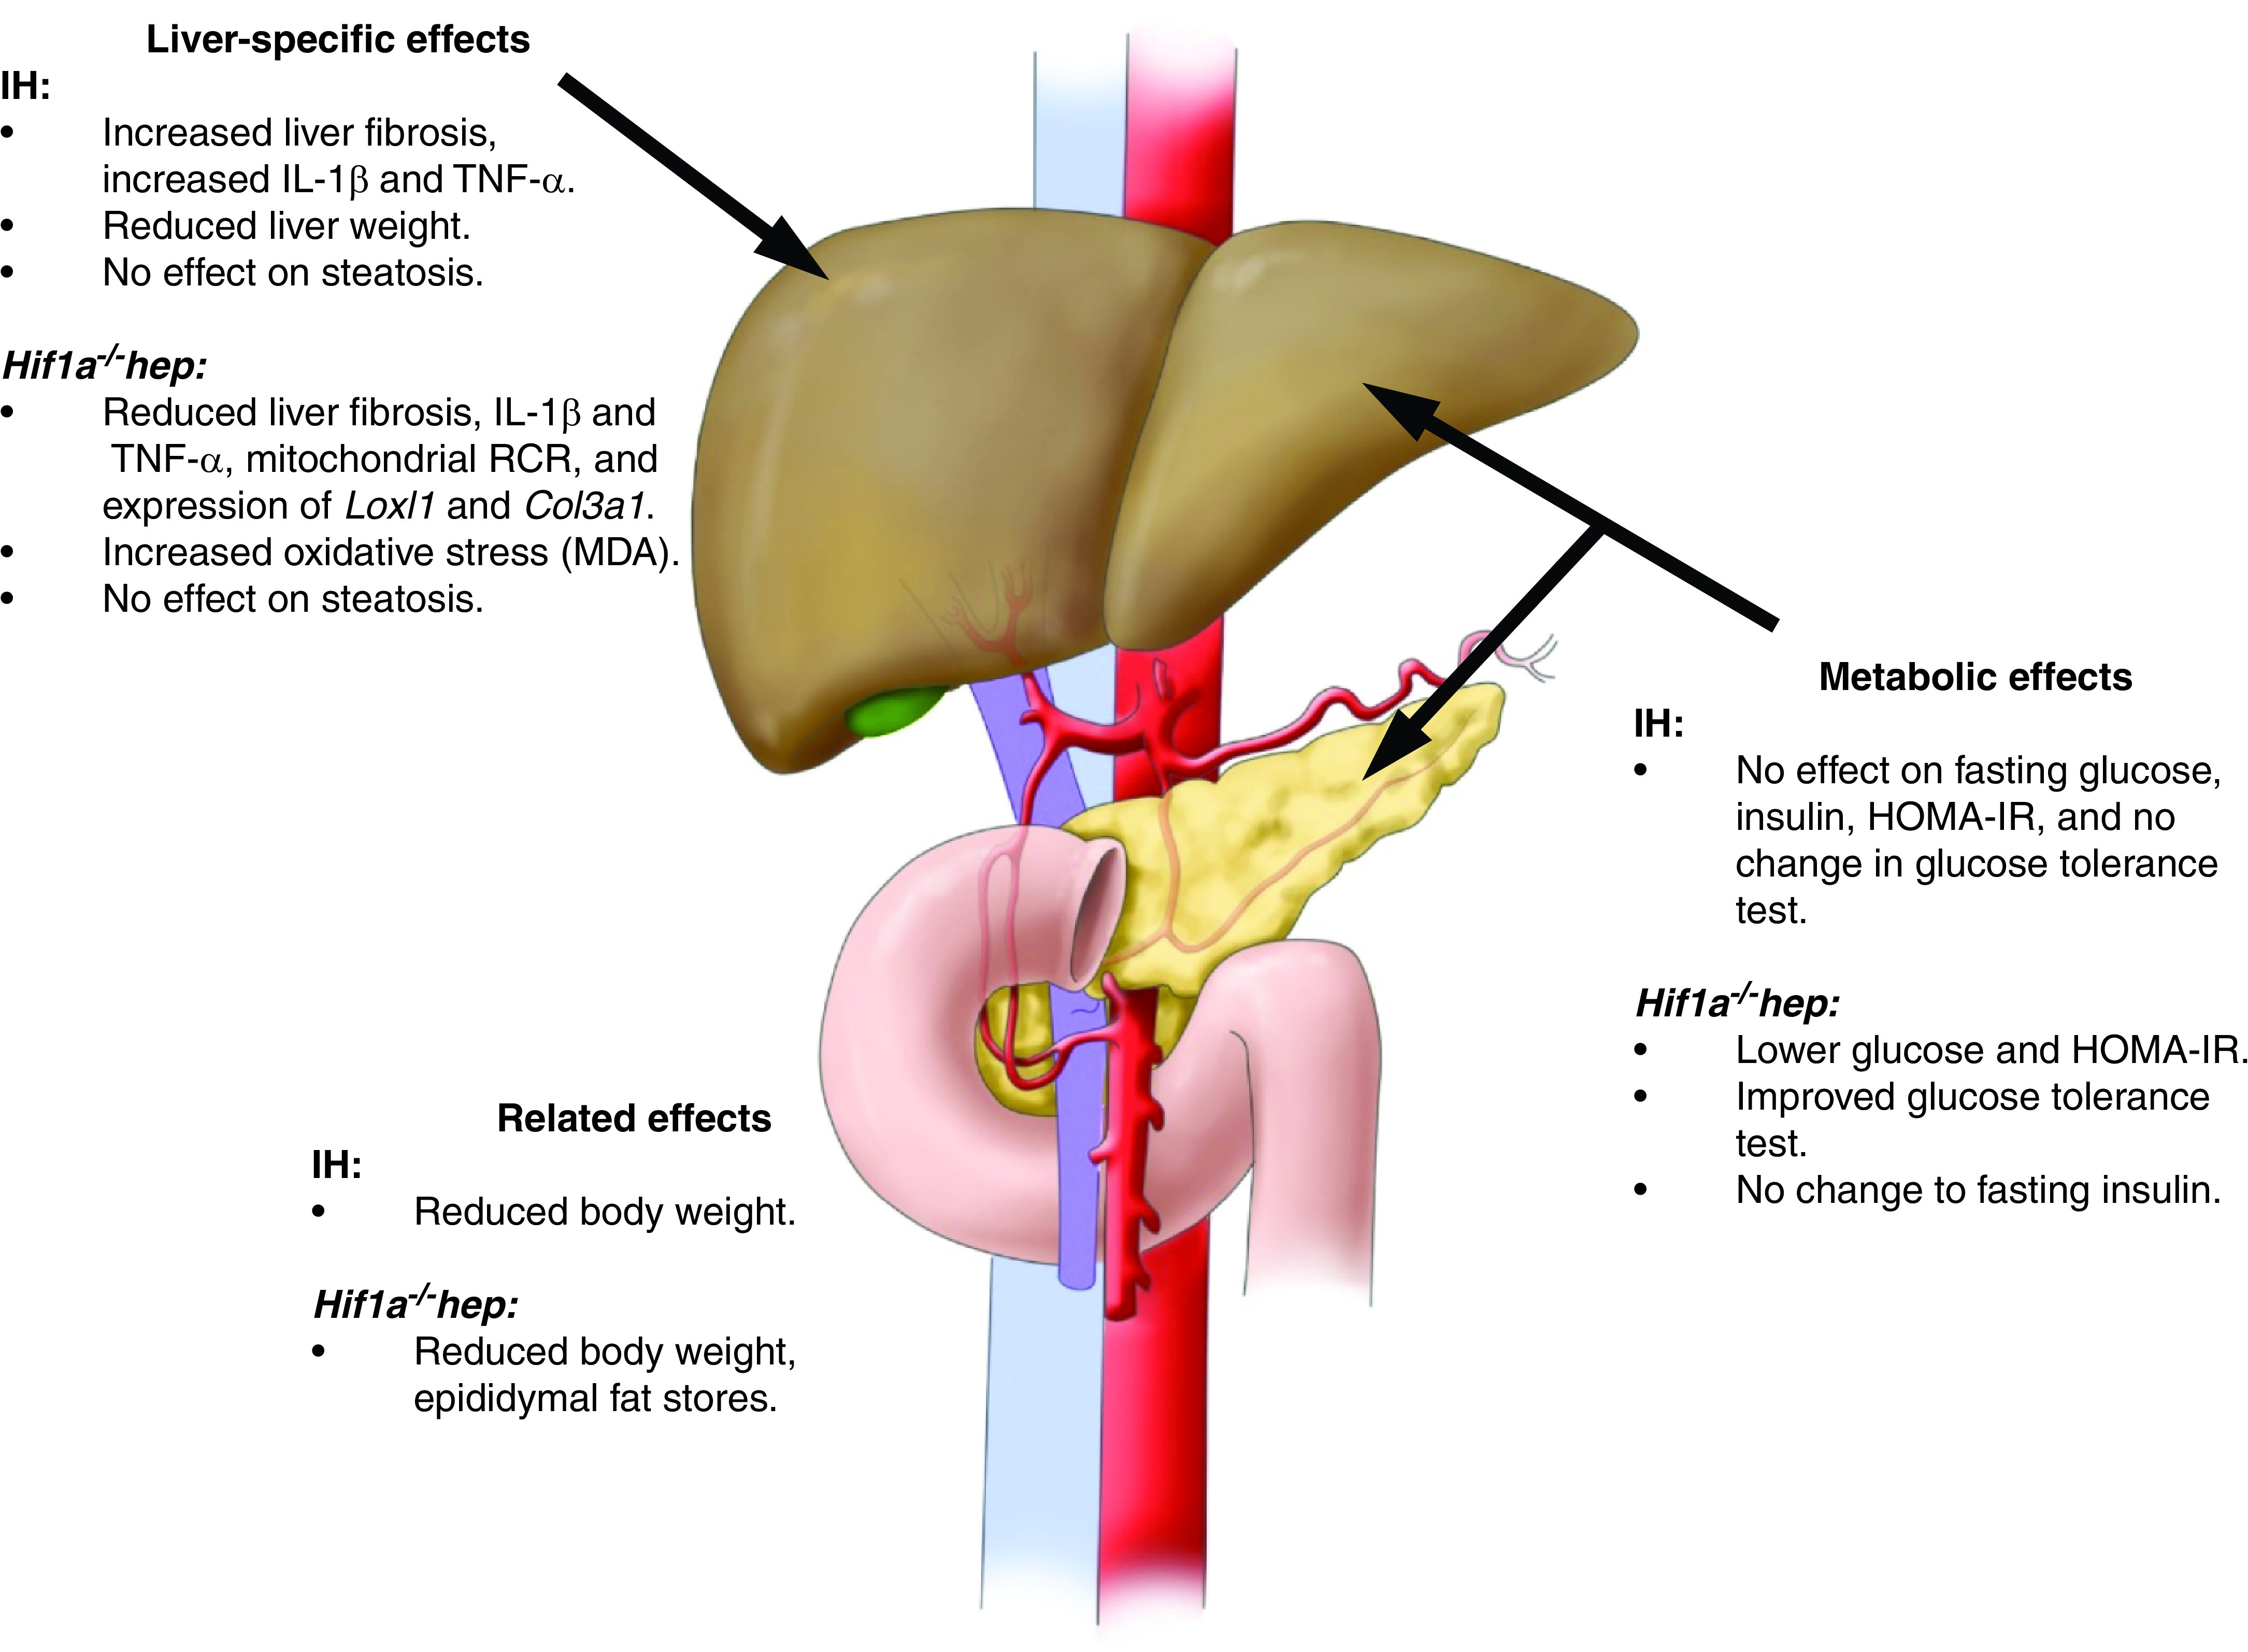
Obstructive sleep apnea is associated with insulin resistance, lipid dysregulation, and hepatic steatosis and fibrosis in nonalcoholic fatty liver disease (NAFLD). We have previously shown that hepatocyte HIF-1 (hypoxia-inducible factor-1) mediates the development of liver fibrosis in a mouse model of NAFLD. We hypothesized that intermittent hypoxia (IH) modeling obstructive sleep apnea would worsen hepatic steatosis and fibrosis in murine NAFLD, via HIF-1. Mice with hepatocyte-specific deletion of Hif1a (Hif1a-/-hep) and wild-type (Hif1aF/F) controls were fed a high trans-fat diet to induce NAFLD with steatohepatitis. Half from each group were exposed to IH, and the other half were exposed to intermittent air. A glucose tolerance test was performed just prior to the end of the experiment. Mitochondrial efficiency was assessed in fresh liver tissue at the time of death. The hepatic malondialdehyde concentration and proinflammatory cytokine levels were assessed, and genes of collagen and fatty acid metabolism were examined. Hif1a-/-hep mice gained less weight than wild-type Hif1a mice (-2.3 g, P = 0.029). There was also a genotype-independent effect of IH on body weight, with less weight gain in mice exposed to IH (P = 0.003). Fasting glucose, homeostatic model assessment for insulin resistance, and glucose tolerance test results were all improved in Hif1a-/-hep mice. Liver collagen was increased in mice exposed to IH (P = 0.033) and was reduced in Hif1a-/-hep mice (P < 0.001), without any significant exposure/genotype interaction being demonstrated. Liver TNF-α and IL-1β were significantly increased in mice exposed to IH and were decreased in Hif1a-/-hep mice. We conclude that HIF-1 signaling worsens the metabolic profile and hastens NAFLD progression and that IH may worsen liver fibrosis. These effects are plausibly mediated by hepatic inflammatory stress.

Keywords: HIF-1; hepatic fibrosis; hyperglycemia; lipid metabolism; obstructive sleep apnea.


Figures

Figure 1.
Figure 1.
Metabolic characteristics. (A) Hepatocyte-specific Hif1a (hypoxia-inducible factor-1α)–knockout (Hif1a−/−hep) mice had reduced fasting glucose relative to wild-type (Hif1aF/F) mice (P = 0.001), but intermittent hypoxia (IH) had no impact. Insulin levels were not different between groups, but the HOMA-IR index was reduced in Hif1a−/−hep mice (P = 0.047). (B) Glucose tolerance test (GTT) results in all groups. Hif1a−/−hep conferred a protective effect on glucose handling during GTTs (P = 0.016) that was not impacted by IH. (C) Liver weight at the time of death was lower in the IH group (P = 0.017), although liver weight as a percentage of body weight was not different. Hif1a−/−hep mice had less epididymal fat than Hif1aF/F mice (P = 0.010), although no effect of IH was observed, despite overall differences in body weight due to hypoxia exposure. Epididymal fat weight differences between genotypes persisted when epididymal fat was expressed as a percentage of overall body weight (5.3% ± 0.2% in Hif1aF/F mice overall vs. 4.6% ± 0.1% in Hif1a−/−hep mice overall; P = 0.034 for genotype effect determined by using two-way ANOVA). *P < 0.05 and ***P < 0.005 for comparisons made by using two-way ANOVA. When the P  value was <0.05 for exposure comparisons made by using two-way ANOVA, this is noted above the figure. AUC = area under the curve; HOMA-IR = homeostatic model assessment for insulin resistance; IA = intermittent air.
Figure 2.
Figure 2.
HIF-1α target genes and immunoreactivity responses to IH and Hif1a−/−hep. (A) RT-PCR results for Vegf (left) and Slc2a1 (right, encoding the GLUT1 protein) expression in total liver tissue (n = 6/group). IH increased expression of both Vegf and Slc2a1 in Hif1aF/F mice. Hif1a−/−hep mice showed reduced expression of both relative to Hif1aF/F mice. *P < 0.05 and *** P < 0.005 for two-tailed unpaired t test comparison with Hif1aF/F IA group. (B) Immunofluorescence results for HIF-1α protein from frozen sectioned liver tissue. A marked increase in HIF-1α is seen in IH-exposed Hif1aF/F mice. HIF-1α is not as highly stabilized in IA-exposed Hif1a−/−hep mice compared with IA-exposed Hif1aF/F mice and appears to be largely confined to nonhepatocytes such as endothelial cells (white arrows), which were unimpacted by Hif1a−/−hep. Scale bars, 200 μm.
Figure 3.
Figure 3.
Nonalcoholic fatty liver disease characteristics. (A) Representative H&E, Masson’s trichrome, and Sirius red stains from all experimental groups. Large white circles are vacuoles of fat as seen in severe hepatic steatosis. In Masson’s trichrome staining, collagen stains blue, and in Sirius red staining, collagen stains dark red. There is less collagen apparent in Hif1a−/−hep liver samples. (B) Hepatic triglyceride content. Neither the genotype (P = 0.095) nor the exposure (P = 0.191) impacted hepatic triglyceride levels. (C) Hepatic collagen content as assessed by using a hydroxyproline assay (left) and evaluation of liver fibrosis by using Sirius red staining (right). *P < 0.05 and ****P < 0.001 for comparisons made by using two-way ANOVA. When P values are <0.05 for exposure comparisons made by using two-way ANOVA, this is noted above the figure. Scale bars, 200 μm. H&E = hematoxylin and eosin.
Figure 4.
Figure 4.
Effects of Hif1a−/−hep and IH on hepatic lipid peroxidation (malondialdehyde [MDA] content), hepatic mitochondrial efficiency, and expression of genes relevant to liver fibrosis and hepatic lipid metabolism. (A) MDA concentration in each experimental group. MDA was increased in Hif1a−/−hep mice (P < 0.001), but hypoxia exposure had no effect of (P = 0.309). An interactive effect between the genotype and exposure did not reach significance (P = 0.080). (B) Mitochondrial efficiency as represented by the RCR (ratio between state III [S3] and state IV [S4] oxygen consumption), with O2 flux being shown in S3 and S4. Mitochondrial efficiency was lower in Hif1a−/−hep mice than in Hif1aF/F mice (P = 0.002). There was no effect from IH exposure (P = 0.613), and there were no genotype or exposure effects on raw O2 flux data in S3 and S4. ***P < 0.005 and ****P < 0.001 for two-way ANOVA in A and B. (C) RT-PCR results for select genes related to hepatic lipid metabolism (Srebf1, Cpt2, and Ppara) and collagen synthesis (Loxl1, Lox, Col1a2, and Col3a1) (n = 6/group). *P < 0.05 for two-tailed unpaired t test comparison with Hif1aF/F IA group. In the IA group, Hif1a−/−hep mice showed reductions in Loxl1 and Col3a1 expression compared with Hif1aF/F mice, but no significant effect of IH was observed in any gene. RCR = respiratory control ratio.
Figure 5.
Figure 5.
Effect of an antisense oligonucleotide (ASO) targeting HIF-1α (Hif1a-ASO) in mice on a high–trans-fat diet and exposed to IH. (A) Representative H&E, Masson’s trichrome, and Sirius red stains from all experimental groups. (B) Immunofluorescence results for HIF-1α protein from frozen sectioned liver tissue and RT-PCR results for Vegf expression (left) and Slc2a1 expression (right) in total liver tissue (n = 4/group). (C) In the GTT results, no significant between-group differences were observed. (D) Liver collagen content as per hydroxyproline assay results. There was a trend toward a reduction in liver collagen in the Hif1a-ASO group relative to the other groups. P = 0.088 for comparison made by using one-way ANOVA. *P < 0.05 for comparison between Hif1a-ASO mice and the Scr-ASO and saline groups combined (two-tailed unpaired t test). Scale bars, 300 μm. Scr-ASO = scrambled, noncoding ASO.
Figure 6.
Figure 6.
Summary of the major metabolic and liver-specific effects of Hif1a−/−hep and IH. IH had no major metabolic effects but reduced body weight and increased liver fibrosis and the expression of certain proinflammatory cytokines in the liver. The Hif1a−/−hep genotype was associated with lower fasting glucose, a lower HOMA-IR index, and improved glucose tolerance. In the liver, Hif1a−/−hep mice had less fibrosis, lower proinflammatory cytokine levels, reduced expression of certain genes of collagen synthesis or cross-linking, and increased levels of MDA. Neither IH nor the Hif1a−/−hep genotype impacted liver steatosis. Adapted from Reference .

Comment in

Similar articles

Cited by

References

    1. Senaratna CV, Perret JL, Lodge CJ, Lowe AJ, Campbell BE, Matheson MC. et al. Prevalence of obstructive sleep apnea in the general population: a systematic review. Sleep Med Rev. 2017;34:70–81. - PubMed
    1. Pham LV, Schwartz AR. The pathogenesis of obstructive sleep apnea. J Thorac Dis. 2015;7:1358–1372. - PMC - PubMed
    1. Reinke C, Bevans-Fonti S, Drager LF, Shin M-K, Polotsky VY. Effects of different acute hypoxic regimens on tissue oxygen profiles and metabolic outcomes. J Appl Physiol (1985) 2011;111:881–890. - PMC - PubMed
    1. He Q, Yang QC, Zhou Q, Zhu H, Niu WY, Feng J. et al. Effects of varying degrees of intermittent hypoxia on proinflammatory cytokines and adipokines in rats and 3T3-L1 adipocytes. PLoS One. 2014;9:e86326. - PMC - PubMed
    1. Savransky V, Nanayakkara A, Li J, Bevans S, Smith PL, Rodriguez A. et al. Chronic intermittent hypoxia induces atherosclerosis. Am J Respir Crit Care Med. 2007;175:1290–1297. - PMC - PubMed

Publication types

MeSH terms

Substances