

How New Mexico Leveraged a COVID-19 Case Forecasting Model to Preemptively Address the Health Care Needs of the State: Quantitative Analysis
- PMID: 34003763
- PMCID: PMC8191729
- DOI: 10.2196/27888
How New Mexico Leveraged a COVID-19 Case Forecasting Model to Preemptively Address the Health Care Needs of the State: Quantitative Analysis
Abstract
Background: Prior to the COVID-19 pandemic, US hospitals relied on static projections of future trends for long-term planning and were only beginning to consider forecasting methods for short-term planning of staffing and other resources. With the overwhelming burden imposed by COVID-19 on the health care system, an emergent need exists to accurately forecast hospitalization needs within an actionable timeframe.
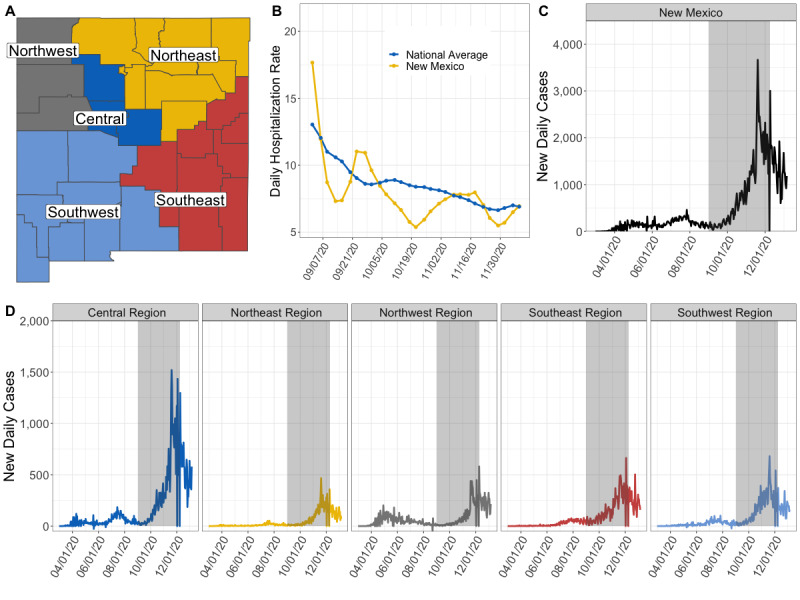
Objective: Our goal was to leverage an existing COVID-19 case and death forecasting tool to generate the expected number of concurrent hospitalizations, occupied intensive care unit (ICU) beds, and in-use ventilators 1 day to 4 weeks in the future for New Mexico and each of its five health regions.
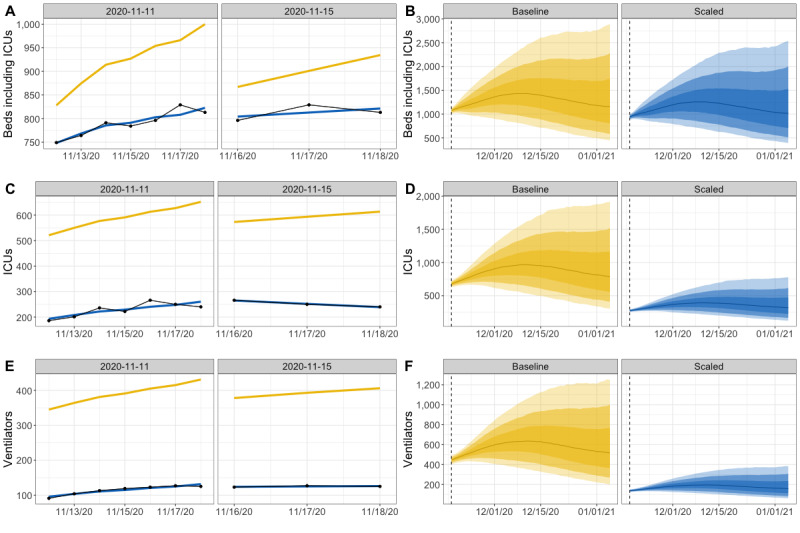
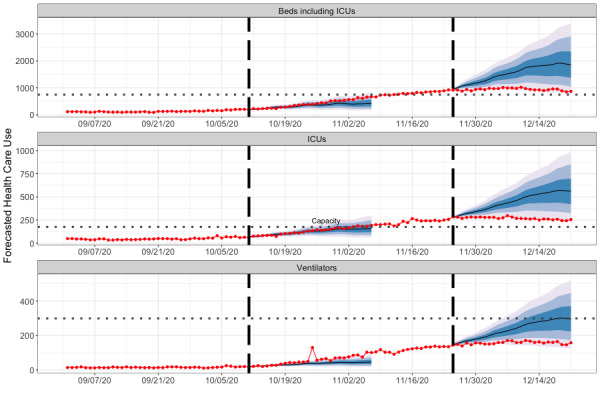
Methods: We developed a probabilistic model that took as input the number of new COVID-19 cases for New Mexico from Los Alamos National Laboratory's COVID-19 Forecasts Using Fast Evaluations and Estimation tool, and we used the model to estimate the number of new daily hospital admissions 4 weeks into the future based on current statewide hospitalization rates. The model estimated the number of new admissions that would require an ICU bed or use of a ventilator and then projected the individual lengths of hospital stays based on the resource need. By tracking the lengths of stay through time, we captured the projected simultaneous need for inpatient beds, ICU beds, and ventilators. We used a postprocessing method to adjust the forecasts based on the differences between prior forecasts and the subsequent observed data. Thus, we ensured that our forecasts could reflect a dynamically changing situation on the ground.
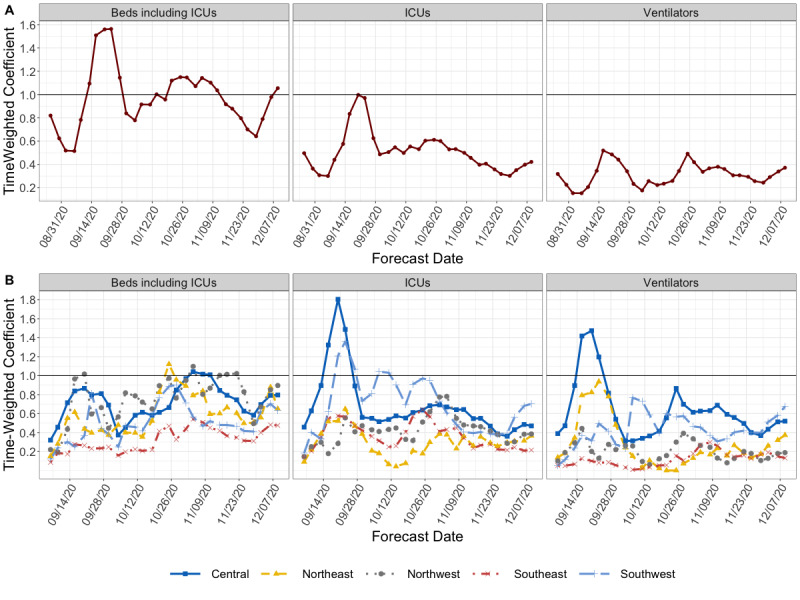
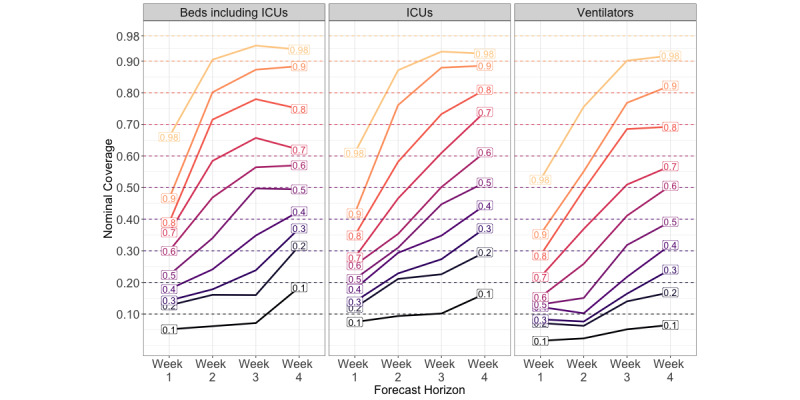
Results: Forecasts made between September 1 and December 9, 2020, showed variable accuracy across time, health care resource needs, and forecast horizon. Forecasts made in October, when new COVID-19 cases were steadily increasing, had an average accuracy error of 20.0%, while the error in forecasts made in September, a month with low COVID-19 activity, was 39.7%. Across health care use categories, state-level forecasts were more accurate than those at the regional level. Although the accuracy declined as the forecast was projected further into the future, the stated uncertainty of the prediction improved. Forecasts were within 5% of their stated uncertainty at the 50% and 90% prediction intervals at the 3- to 4-week forecast horizon for state-level inpatient and ICU needs. However, uncertainty intervals were too narrow for forecasts of state-level ventilator need and all regional health care resource needs.
Conclusions: Real-time forecasting of the burden imposed by a spreading infectious disease is a crucial component of decision support during a public health emergency. Our proposed methodology demonstrated utility in providing near-term forecasts, particularly at the state level. This tool can aid other stakeholders as they face COVID-19 population impacts now and in the future.
Keywords: COVID-19; ICU; forecast; forecasting; health care; hospital; intensive care unit; model; plan; prediction; probability; quantitative; trend; ventilator.
©Lauren A Castro, Courtney D Shelley, Dave Osthus, Isaac Michaud, Jason Mitchell, Carrie A Manore, Sara Y Del Valle. Originally published in JMIR Public Health and Surveillance (https://publichealth.jmir.org), 09.06.2021.
Conflict of interest statement
Conflicts of Interest: None declared.
Figures
References
-
- Coronavirus disease 2019 (COVID-19) Situation Report - 51. World Health Organization. [2021-06-02]. https://www.who.int/emergencies/diseases/novel-coronavirus-2019/situatio...
-
- Massad E, Burattini M, Lopez L, Coutinho F. Forecasting versus projection models in epidemiology: the case of the SARS epidemics. Med Hypotheses. 2005;65(1):17–22. doi: 10.1016/j.mehy.2004.09.029. http://europepmc.org/abstract/MED/15893110 - DOI - PMC - PubMed
-
- IHME COVID-19 health service utilization forecasting team. Murray CJL. Forecasting the impact of the first wave of the COVID-19 pandemic on hospital demand and deaths for the USA and European Economic Area countries. medRxiv. doi: 10.1101/2020.04.21.20074732. Preprint posted online on April 26, 2020. - DOI
-
- Moghadas SM, Shoukat A, Fitzpatrick MC, Wells CR, Sah P, Pandey A, Sachs JD, Wang Z, Meyers LA, Singer BH, Galvani AP. Projecting hospital utilization during the COVID-19 outbreaks in the United States. Proc Natl Acad Sci U S A. 2020 Apr 21;117(16):9122–9126. doi: 10.1073/pnas.2004064117. http://www.pnas.org/cgi/pmidlookup?view=long&pmid=32245814 - DOI - PMC - PubMed
Publication types
MeSH terms
Grants and funding
LinkOut - more resources
Full Text Sources
Other Literature Sources
Medical
