. 2021 May 15;81(10):2760-2773.
doi: 10.1158/0008-5472.CAN-20-2896. Epub 2021 Mar 18.

The Transcriptomic Landscape of Mismatch Repair-Deficient Intestinal Stem Cells

Affiliations

The Transcriptomic Landscape of Mismatch Repair-Deficient Intestinal Stem Cells

Prashant V Bommi et al. Cancer Res. .

Abstract

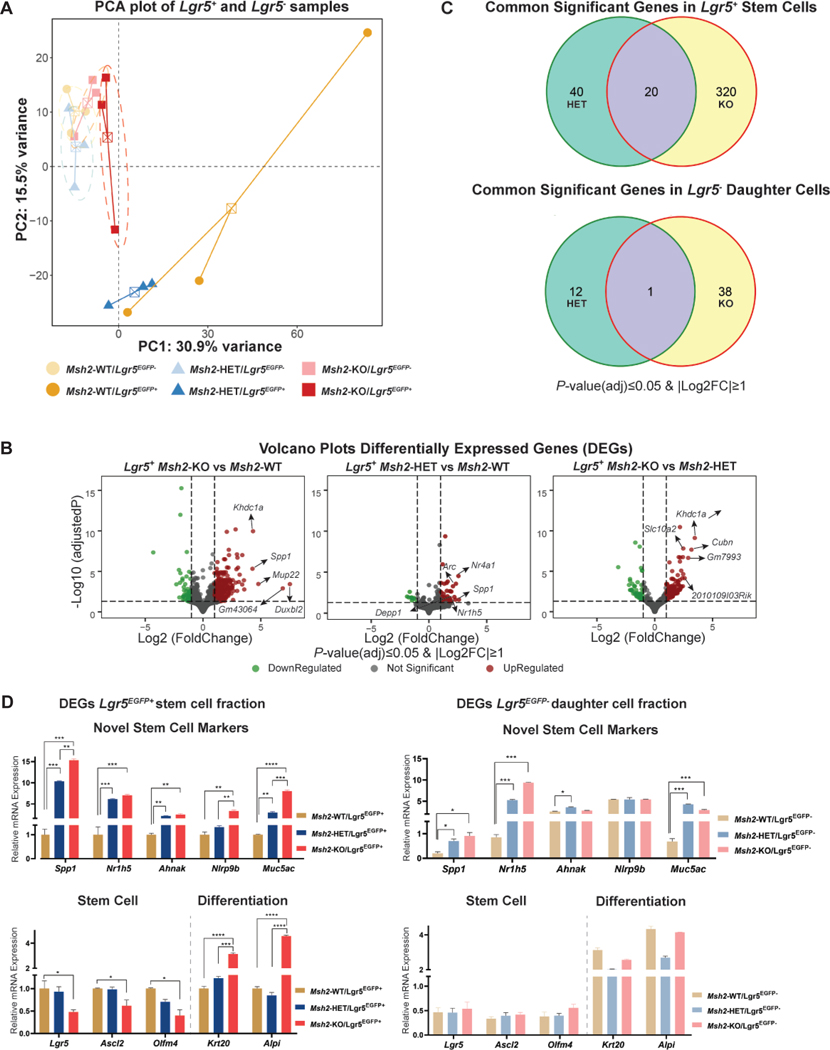
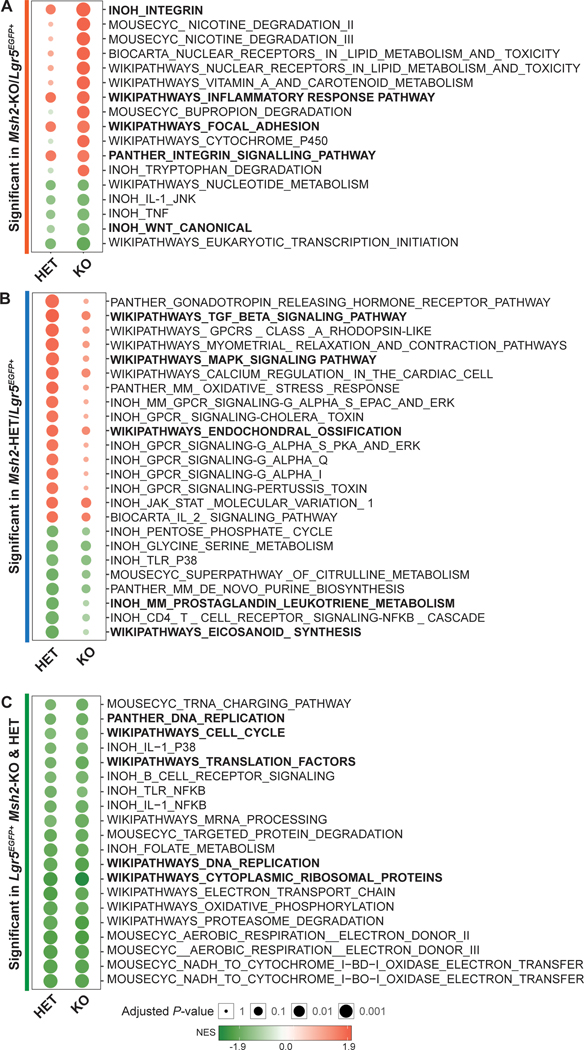
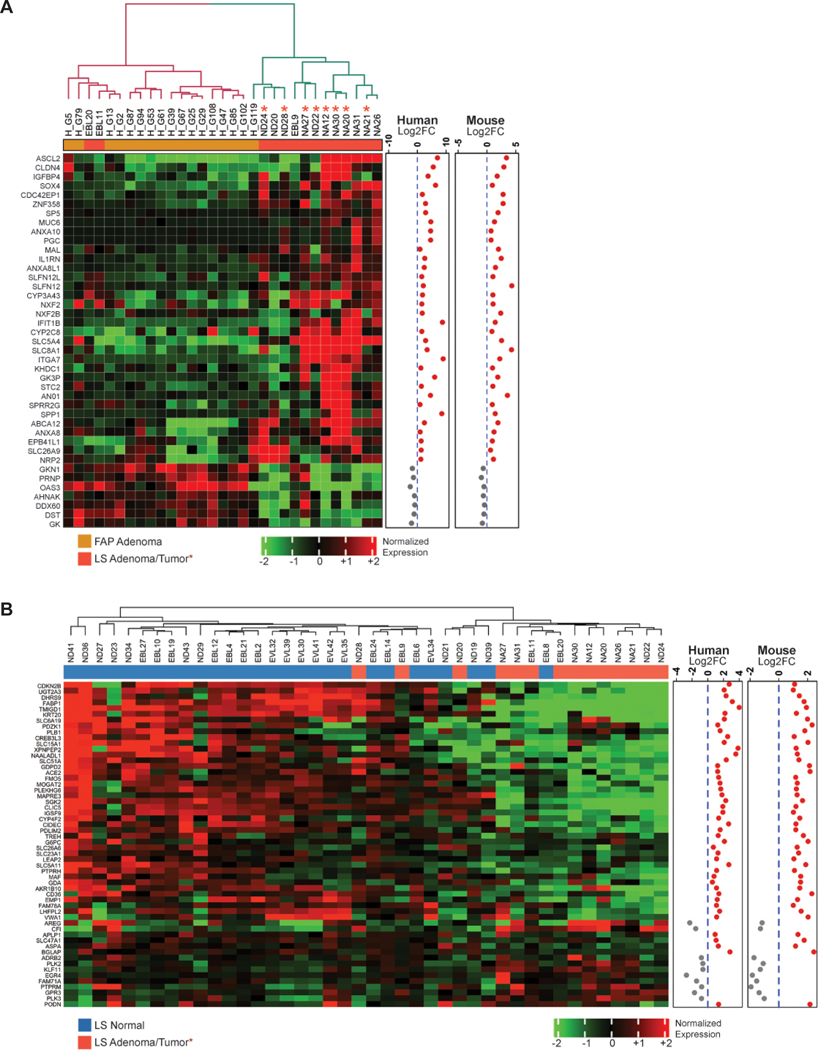
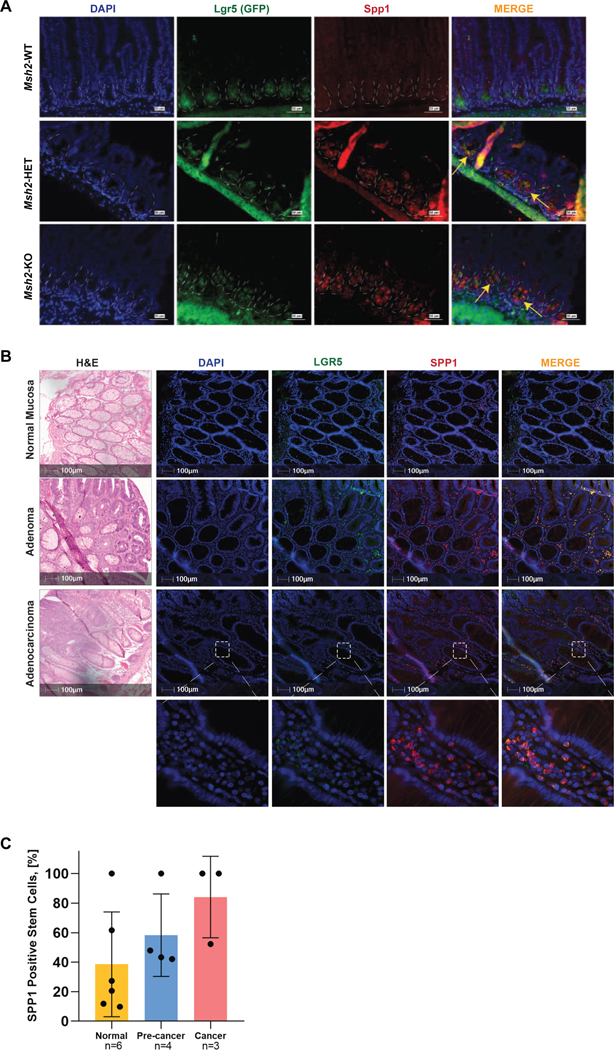
Lynch syndrome is the most common cause of hereditary colorectal cancer and is secondary to germline alterations in one of four DNA mismatch repair (MMR) genes. Here we aimed to provide novel insights into the initiation of MMR-deficient (MMRd) colorectal carcinogenesis by characterizing the expression profile of MMRd intestinal stem cells (ISC). A tissue-specific MMRd mouse model (Villin-Cre;Msh2 LoxP/LoxP ) was crossed with a reporter mouse (Lgr5-EGFP-IRES-creERT2) to trace and isolate ISCs (Lgr5+) using flow cytometry. Three different ISC genotypes (Msh2-KO, Msh2-HET, and Msh2-WT) were isolated and processed for mRNA-seq and mass spectrometry, followed by bioinformatic analyses to identify expression signatures of complete MMRd and haplo-insufficiency. These findings were validated using qRT-PCR, IHC, and whole transcriptomic sequencing in mouse tissues, organoids, and a cohort of human samples, including normal colorectal mucosa, premalignant lesions, and early-stage colorectal cancers from patients with Lynch syndrome and patients with familial adenomatous polyposis (FAP) as controls. Msh2-KO ISCs clustered together with differentiated intestinal epithelial cells from all genotypes. Gene-set enrichment analysis indicated inhibition of replication, cell-cycle progression, and the Wnt pathway and activation of epithelial signaling and immune reaction. An expression signature derived from MMRd ISCs successfully distinguished MMRd neoplastic lesions of patients with Lynch syndrome from FAP controls. SPP1 was specifically upregulated in MMRd ISCs and colocalized with LGR5 in Lynch syndrome colorectal premalignant lesions and tumors. These results show that expression signatures of MMRd ISC recapitulate the initial steps of Lynch syndrome carcinogenesis and have the potential to unveil novel biomarkers of early cancer initiation. SIGNIFICANCE: The transcriptomic and proteomic profile of MMR-deficient intestinal stem cells displays a unique set of genes with potential roles as biomarkers of cancer initiation and early progression.


Conflict of interest statement

Conflict of Interest Disclosures:

No other disclosures are reported.

Figures

Figure 1.
Figure 1.
Schematic outline of the experimental design. Lgr5EGFP-IRES-creERT2 mice were crossed with Villin-Cre;Msh2LoxP/LoxP mice (VC-Msh2LoxP/LoxP). After crypt isolation from Msh2-WT, Msh2-HET, or Msh2-KO mice, FACS was performed to isolate GFP labeled Lgr5EGFP+ stem cells or Lgr5EGFP- daughter cells. Sorted cell populations were used to extract RNA and protein for transcriptomics and proteomics profiling by mRNAseq and tandem Mass Spectrometry, respectively. Bioinformatic analyses were used to identify differentially expressed genes and proteins in MMRd and haploinsufficient ISC. Validation of gene expression signatures was performed using both mouse tissue specimens and organoids as well as human cell lines and tissues from LS patients.
Figure 2.
Figure 2.. Bioinformatics analysis of gene expression from Lgr5EGFP+ stem and Lgr5EGFP- daughter cells.
(A) PCA plot of expression profiles from Lgr5EGFP+ intestinal stem cells (solid colors) isolated from Msh2-WT (dark yellow), Msh2-HET (dark blue) and Msh2-KO (dark red) and from daughter cells (Lgr5EGFP- and EpCAM+, light shades of respective colors). The first and second principal components are plotted in the X and Y-axis, respectively. Individual samples within each group are connected by a centroid. A total of 21 mice for Msh2-WT, 25 for Msh2-HET and 40 for Msh2-KO were equally distributed among three biological replicates to obtain ~10,000 ISC for each replicate per genotype; (B) Volcano plots illustrate genes expressed in ISC of Msh2-KO and Msh2-HET compared to Msh2-WT and in ISC of Msh2-KO as compared to Msh2-HET. X-axis presents Log2Fold change and Y-axis presents log10 of adjusted P-value for multiple comparisons from DESeq2 differential analysis. The horizontal dashed line represents FDR=0.05, while left and right vertical dashed lines represent Log2FC of ±1, respectively. Significantly down-regulated genes are displayed in green, upregulated in red, and non-significant in black; (C) Venn diagrams showing numbers of significantly expressed genes in Lgr5EGFP+ stem cells and Lgr5EGFP- non-stem cells for each genotype compared with Msh2-WT; (D) Validation of the expression of key signature genes from the MMRd and MMR-haploinsufficient signatures as well as stem and differentiation markers analyzed using qRT-PCR in FACS sorted Lgr5EGFP+ (stem, left panels) and Lgr5EGFP- (non-stem, right panels) cells from Msh2-WT, Msh2-HET and Msh2-KO. Data is presented as fold changes and depicted as relative gene expression levels compared to expression levels in Lgr5EGFP+ cells of Msh2-WT as reference. Expression levels of Gapdh were used as an internal housekeeping gene for normalization. Error bars display ±SD. One-way ANOVA with Tukey’s multiple comparison post-hoc test, *P -value< 0.05, **P-value < 0.01, ***P-value< 0.001, ****P-value<0.0001.
Figure 3.
Figure 3.. Pathways modulated in MMRd and MMR haploinsufficient ISCs.
Bubble chart plots display statistically significant pathways enriched in Msh2-KO ISCs (A), Msh2-HET ISCs (B), and both Msh2-HET and Msh2-KO ISCs (C), using BH-adjusted P-value=0.05 as a cutoff. Pathways bolded were relevant in terms of function to the molecular biology of MMRd ISC. The size of circles represents adjusted P-value (larger circles represent smaller P-value). The colors of bubbles were determined by the sign and amplitude of normalized enrichment score (NES) with positively enriched pathways in red and negatively enriched pathways in green.
Figure 4.
Figure 4.. Expression of Msh2-HET and Msh2-KO signatures in FAP and LS patient samples.
(A) Unsupervised hierarchical clustering heatmaps showing the expression pattern of selected Msh2-KO versus Msh2-WT signature genes in FAP polyps and LS hypermutant/MSI pre-cancer/tumor samples (FDR<0.05 in human and same fold change direction in both mouse and human); (B) Expression patterns of selected Msh2-KO versus Msh2-HET signature genes in normal mucosa from LS patients using row-centered and batch corrected expression data (FDR<0.05 in human and same fold change direction in mouse and human). Dendrograms indicate sample-sample Pearson correlation distances. The significance of genes in human comparison are indicated in a row covariate bar. Log2FC in human and mice for each gene are shown as scatter plots. Sample type is color-coded as follows: blue represents normal tissue from LS patients; red represents hypermutant/MSI adenomas/tumor tissue from LS patients, respectively; FC, fold change; LS, Lynch Syndrome.
Figure 5.
Figure 5.. Expression and localization of Spp1 within crypts of MMR mouse models and LS patient specimens.
(A) Small intestine from 8 week-old Msh2-WT, Msh2-HET, and Msh2-KO mice was stained with antibodies against GFP to detect Lgr5+ cells (green) and Spp1 (red) by immunofluorescence. Panels show representative images for Lgr5 and Spp1 expression and location within crypts. Yellow arrows in merged images demarcate the co-localization of Lgr5 and Spp1 in crypts of tissues from Msh2-HET and Msh2-KO. Nuclei were counterstained with DAPI (blue). Scale bar is equivalent to 50 μm; (B) Representative images from FFPE tissue sections of H&E, nuclear counterstaining with DAPI (blue), immunostaining with anti-human LGR5 (TSA with Opal-520, green), and anti-SPP1 (TSA with Opal-570, red) antibodies, and composite images acquired using fluorescent multiplex immunohistochemistry. Regions of interest for digital image analysis include normal colon epithelium (top panel), adenomas (middle panel), and adenocarcinoma (lower panel) displaying single positive cells for LGR5 and SPP1, and double-positive cells (MERGE); Scale bar represents 100 μm and scale bar in insets are equivalent to 10 μm. (C) The number of positive cells for each marker and double positives reported was quantified as cell density and expressed by the number of cells per mm2 using inForm advance image analysis software (considering that the total number of nucleated cells is 100%). The percentage of stem cells co-expressing SPP1 and LGR5 (double-positive cells) was higher in pre-cancers and cancers compared to normal adjacent tissue showing a non-statistically significant trend. Graph displays mean±SEM.

Similar articles

Cited by

References

    1. Lynch HT, Snyder CL, Shaw TG, et al. Milestones of Lynch syndrome: 1895–2015. Nat Rev Cancer 2015;15:181–94. - PubMed
    1. Win AK, Jenkins MA, Dowty JG, et al. Prevalence and Penetrance of Major Genes and Polygenes for Colorectal Cancer. Cancer Epidemiol Biomarkers Prev 2017;26:404–412. - PMC - PubMed
    1. Vilar E, Gruber SB. Microsatellite instability in colorectal cancer-the stable evidence. Nat Rev Clin Oncol 2010;7:153–62. - PMC - PubMed
    1. Fearon ER. Molecular genetics of colorectal cancer. Annu Rev Pathol 2011;6:479–507. - PubMed
    1. Bonadona V, Bonaiti B, Olschwang S, et al. Cancer risks associated with germline mutations in MLH1, MSH2, and MSH6 genes in Lynch syndrome. JAMA 2011;305:2304–10. - PubMed

Publication types

MeSH terms