. 2021 Jun 22;6(12):e147703.
doi: 10.1172/jci.insight.147703.

Integration of spatial and single-cell transcriptomics localizes epithelial cell-immune cross-talk in kidney injury

Affiliations

Integration of spatial and single-cell transcriptomics localizes epithelial cell-immune cross-talk in kidney injury

Ricardo Melo Ferreira et al. JCI Insight. .

Abstract

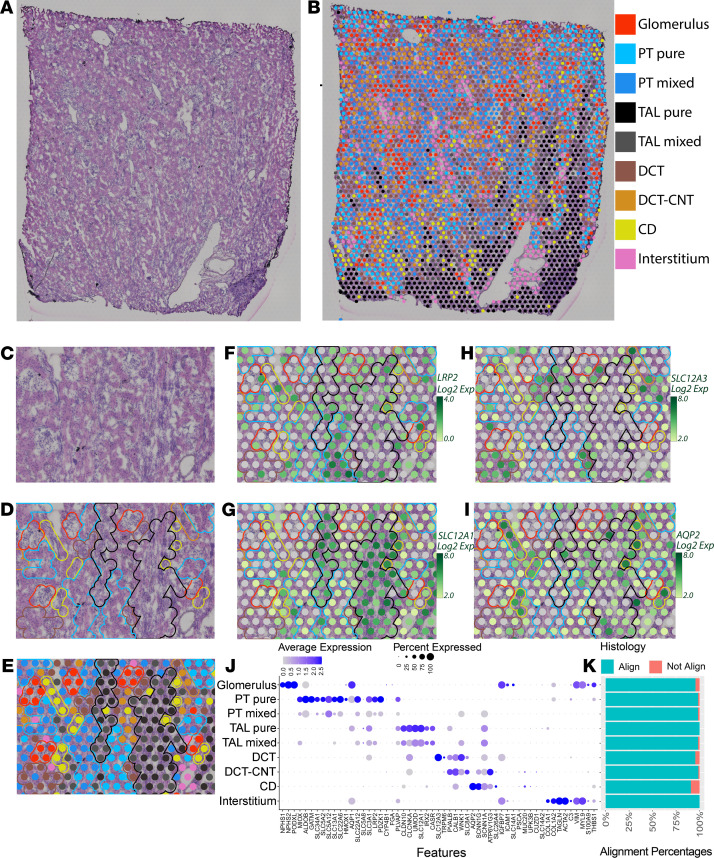
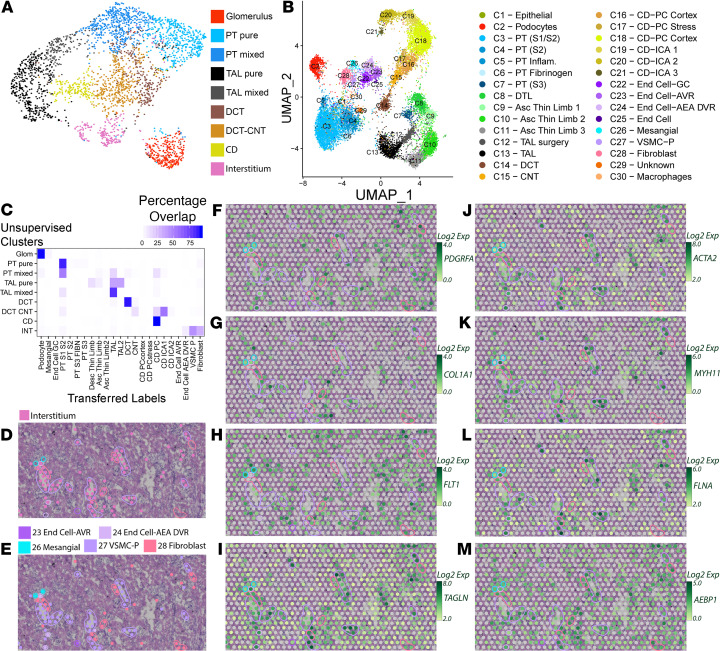
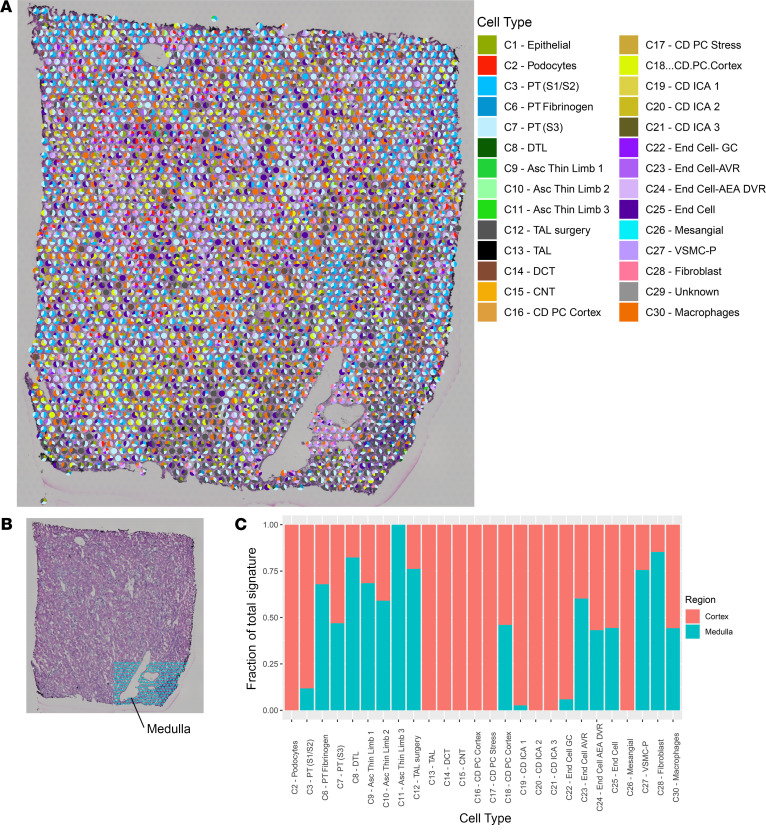
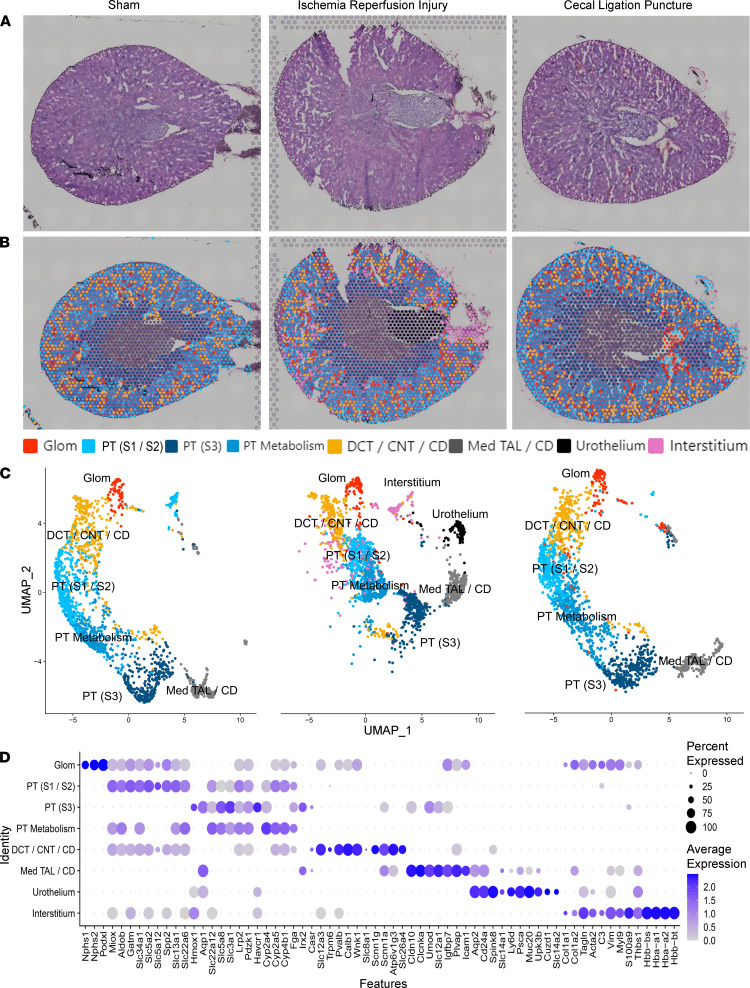
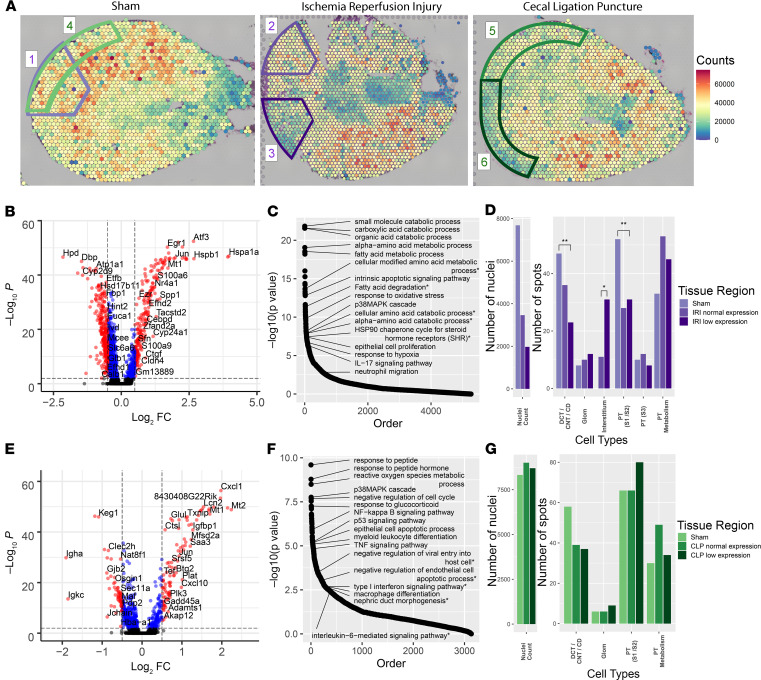
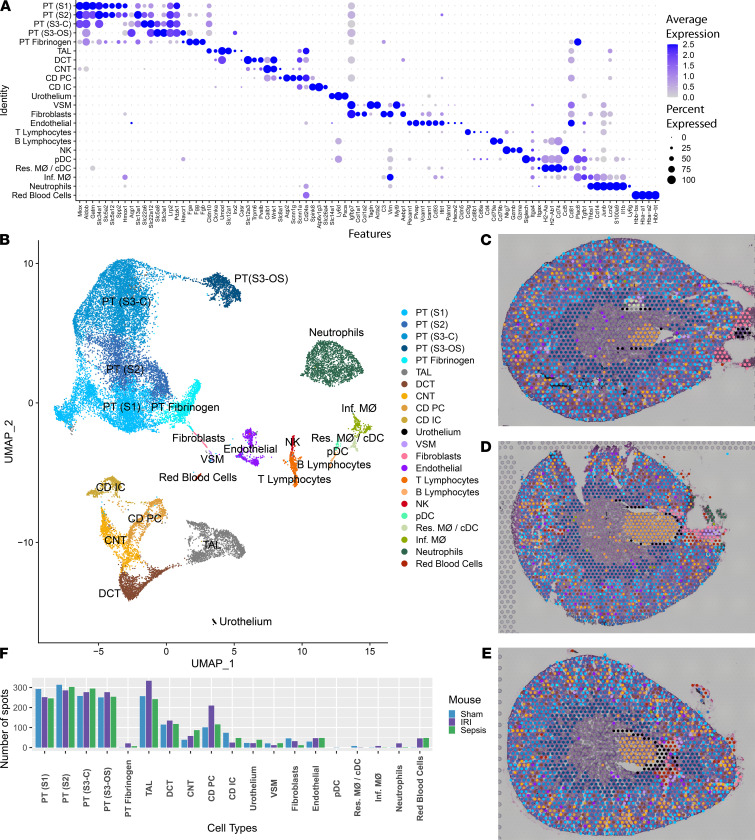
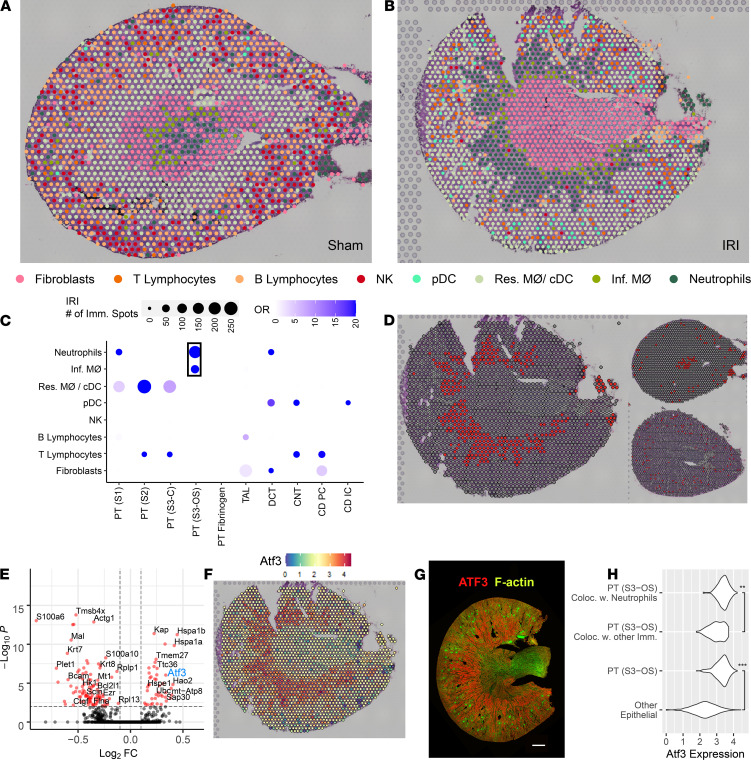
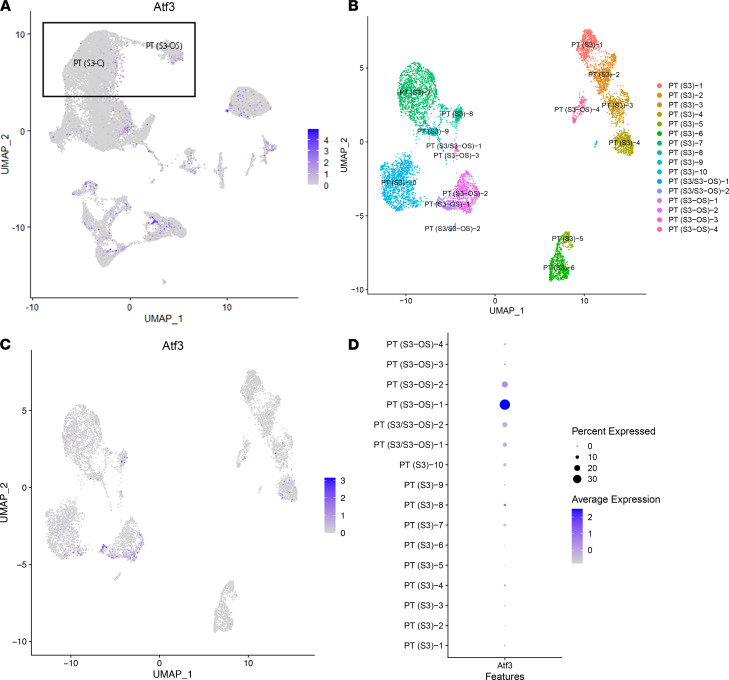
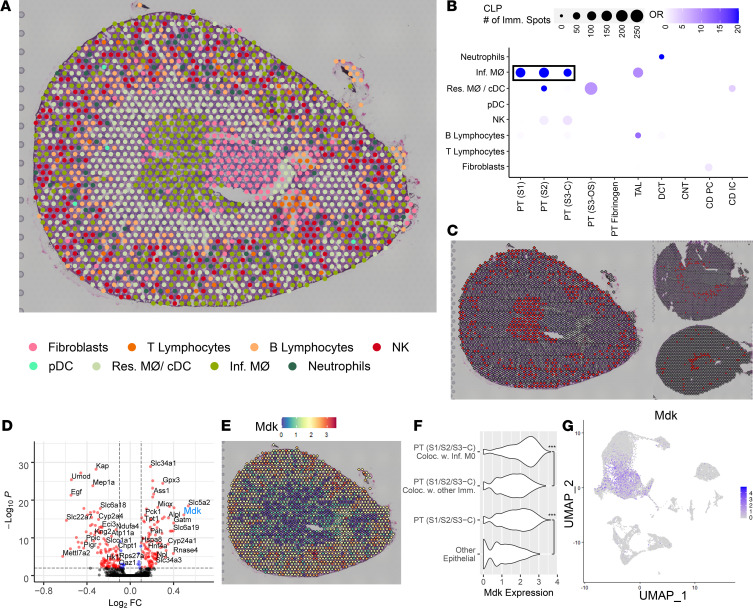
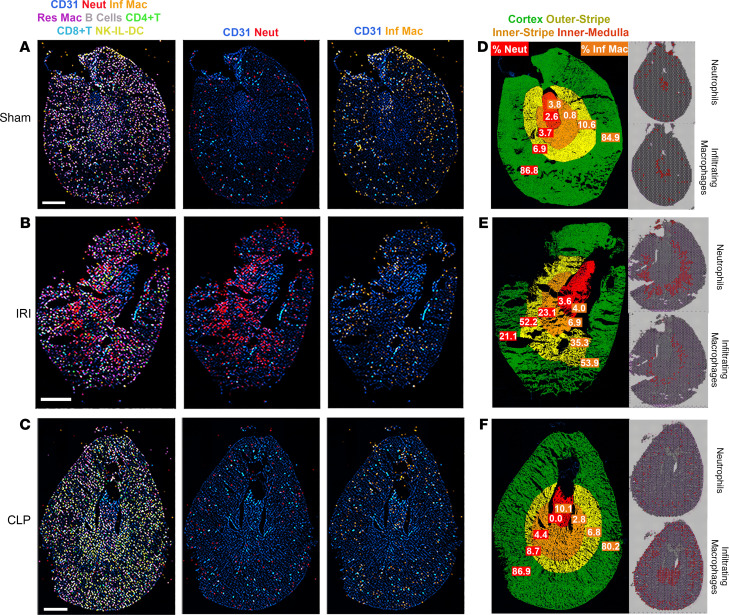
Single-cell sequencing studies have characterized the transcriptomic signature of cell types within the kidney. However, the spatial distribution of acute kidney injury (AKI) is regional and affects cells heterogeneously. We first optimized coordination of spatial transcriptomics and single-nuclear sequencing data sets, mapping 30 dominant cell types to a human nephrectomy. The predicted cell-type spots corresponded with the underlying histopathology. To study the implications of AKI on transcript expression, we then characterized the spatial transcriptomic signature of 2 murine AKI models: ischemia/reperfusion injury (IRI) and cecal ligation puncture (CLP). Localized regions of reduced overall expression were associated with injury pathways. Using single-cell sequencing, we deconvoluted the signature of each spatial transcriptomic spot, identifying patterns of colocalization between immune and epithelial cells. Neutrophils infiltrated the renal medulla in the ischemia model. Atf3 was identified as a chemotactic factor in S3 proximal tubules. In the CLP model, infiltrating macrophages dominated the outer cortical signature, and Mdk was identified as a corresponding chemotactic factor. The regional distribution of these immune cells was validated with multiplexed CO-Detection by indEXing (CODEX) immunofluorescence. Spatial transcriptomic sequencing complemented single-cell sequencing by uncovering mechanisms driving immune cell infiltration and detection of relevant cell subpopulations.

Keywords: Expression profiling; Mouse models; Nephrology.


Conflict of interest statement

Conflict of interest: The authors have declared that no conflict of interest exists.

Figures

Figure 1
Figure 1. Spatial transcriptomics in a human nephrectomy sample.
(A) H&E staining of the human reference nephrectomy. (B) The 9 unsupervised spatial transcriptomic (ST) clusters are overlaid upon the nephrectomy. Glomeruli can be seen scattered across the cortex in red. A medullary ray is seen in the right lower quadrant of the sample. Midsized vessels are often overlaid by pink interstitial cluster ST spots. Pure clusters are defined as those located mainly over the associated structure; mixed clusters often overlap with neighboring structures. (C) A high-magnification image showing histological structures in a reference nephrectomy. (D) Histological structures are highlighted in the nephrectomy. (E) Unsupervised clusters overlaid upon the nephrectomy. (FI) Expression levels of LRP2, SLC12A1, SLC12A3, and AQP2 in the spots over the high magnification region with histological features highlighted. (J) Expression of markers used to classify unsupervised clusters. (K) In 5 random fields covering 40% of all spots, the histology underlying each spot was assessed and the percentage of concordance is provided. All clusters held greater than 90% concordance with their corresponding histology. n = 1 human nephrectomy. PT, proximal tubule; S1, S2, S3, segments of PT; TAL, thick ascending limb; DCT, distal convoluted tubule; CNT, connecting tubule; CD, collecting duct. Each spot is 55 μm in diameter.
Figure 2
Figure 2. Transfer of single-nuclei RNA sequencing clusters to the human spatial transcriptomic sample.
(A) UMAP projection of spatial transcriptomic (ST) data with 9 unsupervised clusters defined by Space Ranger. Spots assigned to the pure PT or thick ascending limb clusters were more frequently located over their corresponding histology; mixed clusters often overlapped neighboring structures. (B) A UMAP projection of the single-nucleus RNA-Seq data (GSE121862) depicts the 30 kidney cell clusters obtained from Pagoda. (C) The percentage of ST spots overlapping between unsupervised cluster spot identities and supervised cluster identities defined by single-nuclei expression signatures. Strong correlation is seen between expected clusters. Each row of the table adds to 100%. (D) A high-magnification image of the H&E-stained human reference nephrectomy with unsupervised interstitium cluster spots overlaid. Histological structures are highlighted. (E) A high-magnification image of the H&E-stained reference nephrectomy with mapped single-nucleus clusters associated with interstitium and histological structures highlighted. (FM) Feature plots depict the expression levels of interstitial cell-type markers, such as PDGFRA, COL1A1, FLT1, TAGLN, ACTA2, MYH11, FLNA, and AEBP1, in the high-magnification region. Histological features highlighted. PT, proximal tubule; S1, S2, S3, segments of PT; TAL, thick ascending limb; DCT, distal convoluted tubule; CNT, connecting tubule; CD, collecting duct; DTL, descending thin limb; Asc, ascending; PC, principal cells; IC, intercalated cells; End, endothelial; GC, glomerular capsule; AVR, ascending vasa recta; AEA, afferent and efferent arterioles; DVR, descending vasa recta; VSMC-P, vascular smooth cells and pericytes. Each spot is 55 μm in diameter.
Figure 3
Figure 3. Neural network analysis of human kidney.
(A) Each pie chart represents the contribution of the cell types from the single-nuclei reference data set to the transcriptomic signature of each spot in the human nephrectomy. Only cell types contributing to at least 10% of the spot signature are displayed. (B) An inset depicts the medullary region highlighted in blue (manually annotated). The remaining nephrectomy was considered cortex. (C) Fraction of total signature of each cell type present in the cortex and medulla, normalized to the total number of spots in the cortex and medulla. Each bar is calculated as follows: the proportion of expression arising from each spot was summed for each cell type in both the cortex and medulla. Summed expression was first normalized for (divided by) the number of spots in the cortex and medulla and then expressed as a ratio of expression arising from the cortex or medulla for each cell type. PT, proximal tubule; S1, S2, S3, segments of PT; TAL, thick ascending limb; DCT, distal convoluted tubule; CNT, connecting tubule; CD, collecting duct; DTL, descending thin limb; Asc, ascending; PC, principal cells; IC, intercalated cells; End, endothelial; GC, glomerular capsule; AVR, ascending vasa recta; AEA afferent and efferent arterioles; DVR, descending vasa recta; VSMC-P, vascular smooth cells and pericytes. Each spot is 55 μm in diameter.
Figure 4
Figure 4. Spatial transcriptomics in murine kidney injury models.
(A) H&E-stained sections of the 3 murine models: sham, ischemia/reperfusion injury (IRI), and cecal ligation puncture (CLP), respectively. (B) Spatial transcriptomic spots are overlaid upon each murine kidney derived from unbiased clustering. (C) A UMAP of the spatial clusters after the data was merged, split by tissue of origin (sham on left, IRI in middle, and CLP on right). (D) Expression of markers used to classify the spatial transcriptomic clusters. n = 1 murine sample per model. PT, proximal tubule; S1, S2, S3, segments of PT; Med, medullary; TAL, thick ascending limb; DCT, distal convoluted tubule; CNT, connecting tubule; CD, collecting; Glom, glomerulus. Each spot is 55 μm in diameter.
Figure 5
Figure 5. Regional expression in murine kidney injury models.
(A) Total expression in read counts was summed for each spatial transcriptomic (ST) spot and the total expression level was overlaid upon each of the 3 murine model sections: sham (left), ischemia/reperfusion injury (IRI, middle), and cecal ligation puncture (CLP, right). Regions of interest and comparator regions are highlighted. In the sham, areas are selected to serve as reference to IRI (1, outlined in purple) and to CLP (4, outlined in green). In the IRI section, region 2 corresponds to the relatively “preserved” overall expression region and region 3 corresponds to a region of low relative expression. In the CLP section, analogous regions of preserved expression (5) and low expression (6) were selected. The regions were defined with similar areas within each comparison. (B) Volcano plot comparing the low-expression region in the IRI to the equivalent region in the sham. Despite the overall reduced expression of the IRI region, many individual genes were upregulated in IRI (right). (C) Pathways enriched for the differentially expressed genes (DEGs) between the low-expression region in IRI when compared with the sham. (D) Bar plots showing the number of nuclei and number of spots of each cluster in the 3 purple comparison regions. The asterisks indicate the significance level (*P < 0.1, **P < 0.001 as calculated by Fisher’s exact test. (E) Volcano plot comparing the low-expression region in the CLP to the equivalent region in the sham with upregulated genes in CLP on the right. (F) Pathways enriched for the DEGs between the low--expression region in CLP when compared with sham. (G) Bar plots showing the number of nuclei and number of spots of each cluster in the 3 green comparison regions. Each spot is 55 μm in diameter.
Figure 6
Figure 6. Single-cell murine data and cluster transfer to spatial transcriptomic samples.
(A) Expression levels of markers used to define clusters in the single-cell data. The single-cell RNA sequencing data set consists of 4 murine samples: an ischemia/reperfusion injury (IRI) mouse with corresponding sham and an LPS endotoxin–administered mouse with its corresponding sham. (B) A UMAP displays the clusters obtained from the single-cell data. (CE) Mapping of the single-cell clusters over the 3 murine spatial transcriptomic sections: sham, IRI, and cecal ligation puncture, respectively. (F) Quantitation of the number of spots mapped to each of the single-cell clusters. Raw spot counts are provided without further calculation. PT, proximal tubule; S1, S2, S3, segments of PT; S3-C, cortical section of S3; S3-OS, outer stripe section of S3; TAL, thick ascending limb; DCT, distal convoluted tubule; CNT, connecting tubule; CD, collecting duct; PC, principal cells; IC, intercalated cells; VSM, vascular smooth muscle; pDC, plasmacytoid DCs; cDC, conventional DCs; Res. MΦ, resident macrophages; Inf. MΦ, infiltrating macrophages. Each spot is 55 μm in diameter.
Figure 7
Figure 7. Colocalization of immune clusters in the ischemia/reperfusion injury model.
(A and B) Selected single-cell immune clusters are overlaid upon the spatial transcriptomic sections for the sham and ischemia/reperfusion injury (IRI) models, respectively. Each spot was labeled with the immune cell with the highest corresponding transfer score. (C) The odds ratio of colocalization for each pair of immune and epithelial clusters in the IRI model when compared with the sham. Only significant comparisons are included in the dot plot as calculated by a Fisher’s exact test. Neutrophils most frequently colocalized with the PT (S3-OS) epithelial cluster. (D) Neutrophil plot in IRI (left), sham (top-right), and cecal ligation puncture (CLP, bottom-right). (E) The differentially expressed genes (DEGs) between the PT (S3-OS) spots colocalizing with neutrophils (right) and the PT (S3-OS) spots colocalizing with other immune clusters in IRI (left). (F) The gene expression of Atf3 localizes to the outer stripe in IRI. (G) Antibody immunofluorescence of ATF3 reveals medullary outer stripe protein expression in the IRI model (n = 3). (H) The expression distribution of Atf3 in selected clusters (**P < 10–9, ***P < 10–15) as calculated by a Fisher’s exact test. PT, proximal tubule; S1, S2, S3, segments of PT; S3-C, cortical section of S3; S3-OS, outer stripe section of S3; TAL, thick ascending limb; DCT, distal convoluted tubule; CNT, connecting tubule; CD, collecting duct; PC, principal cells; IC, intercalated cells; pDC, plasmacytoid DCs; cDC, conventional DCs; Res. MΦ, resident macrophages; Inf. MΦ, infiltrating macrophages. Each spot is 55 μm in diameter. Scale bar: 500 μm (G).
Figure 8
Figure 8. Identification of a proximal tubular single-cell subcluster expressing Atf3.
(A) Feature plot of the single-cell data presenting the expression of Atf3 with PT (S3-C) and PT (S3-OS) clusters highlighted. (B) A UMAP of the PT (S3-C) and PT (S3-OS) single-cell clusters, reclustered at increased resolution. (C) Feature plot of Atf3 with its expression in the single-cell subclusters shows Atf3 specifically in 1 outer stripe subcluster. (D) The expression of Atf3 in all subclusters. PT, proximal tubule; S1, S2, S3, segments of PT; S3-C, cortical section of S3; S3-OS, outer stripe section of S3.
Figure 9
Figure 9. Colocalization of immune clusters in the cecal ligation puncture model.
(A) Selected single-cell immune clusters were transferred over the cecal ligation puncture (CLP) spatial transcriptomic section. (B) The odds ratio of colocalization for each pair of immune and epithelial clusters in CLP when compared with the sham. (C) Infiltrating macrophages localized to the outer cortex and inner medulla. Infiltrating macrophage localization is depicted in the CLP (left), sham (top-right), and ischemia/reperfusion injury (bottom-right). (D) The differentially expressed genes (DEGs) between the PT (S1/S2/S3-C) spots colocalizing with infiltrating macrophages (right) and the ones colocalizing with other immune clusters in CLP. (E) The gene expression of MdK in CLP. (F) The expression distribution of Mdk in selected clusters (***P < 10–15) as calculated by a Fisher’s exact test. (G) The expression of Mdk in the single-cell data. PT, proximal tubule; S1, S2, S3, segments of PT; S3-C, cortical section of S3; S3-OS, outer stripe section of S3; TAL, thick ascending limb; DCT, distal convoluted tubule; CNT, connecting tubule; CD, collecting duct; PC, principal cells; IC, intercalated cells; pDC, plasmacytoid DCs; cDC, conventional DCs; Res. MΦ, resident macrophages; Inf. MΦ, infiltrating macrophages. Each spot is 55 μm in diameter.
Figure 10
Figure 10. Multiplexed imaging of proteins in toto with CODEX validates the localization of immune cell clusters inferred by spatial transcriptomics.
CODEX imaging for kidney sections from sham, ischemia/reperfusion injury (IRI), and cecal ligation puncture (CLP) are shown in A, B, and C, respectively. In the left column for all sections, spatial mapping of various immune cells (neutrophils, infiltrating and resident macrophages, B cells, CD4+ and CD8+ T cells, NK and IL cells, and DCs) are displayed using colored overlays, and CD31 staining is included for context. The definition of each cell type based on the presence and absence of markers is detailed in Supplemental Figure 8. The second column shows only CD31 and neutrophils (Neut, red), and the third column displays infiltrating macrophages (Inf Mac, orange). (DF) show the distribution of neutrophils and infiltrating macrophages in specific regions of the kidney for sham, IRI, and CLP. The cortex, outer stripe of the medulla, inner medulla, and papilla regions were identified based on structural landmarks and annotated using region of interest (ROI) tool in ImageJ. The corresponding spatial transcriptomic signature for neutrophils and infiltrating macrophages is shown on the right side for each specimen.

References

    1. Chen L, et al. Renal-tubule epithelial cell nomenclature for single-cell RNA-sequencing studies. J Am Soc Nephrol. 2019;30(8):1358–1364. - PMC - PubMed
    1. Lake BB, et al. A single-nucleus RNA-sequencing pipeline to decipher the molecular anatomy and pathophysiology of human kidneys. Nat Commun. 2019;10(1):2832. doi: 10.1038/s41467-019-10861-2. - DOI - PMC - PubMed
    1. Stewart BJ, et al. Using single-cell technologies to map the human immune system — implications for nephrology. Nat Rev Nephrol. 2020;16(2):112–128. doi: 10.1038/s41581-019-0227-3. - DOI - PubMed
    1. Wu H, et al. Advantages of single-nucleus over single-cell RNA sequencing of adult kidney: rare cell types and novel cell states revealed in fibrosis. J Am Soc Nephrol. 2019;30(1):23–32. doi: 10.1681/ASN.2018090912. - DOI - PMC - PubMed
    1. Wu H, et al. Single-cell transcriptomics of a human kidney allograft biopsy specimen defines a diverse inflammatory response. J Am Soc Nephrol. 2018;29(8):2069–2080. doi: 10.1681/ASN.2018020125. - DOI - PMC - PubMed

Publication types