

C-peptide enhances glucagon secretion in response to hyperinsulinemia under euglycemic and hypoglycemic conditions
- PMID: 34003799
- PMCID: PMC8262495
- DOI: 10.1172/jci.insight.148997
C-peptide enhances glucagon secretion in response to hyperinsulinemia under euglycemic and hypoglycemic conditions
Abstract
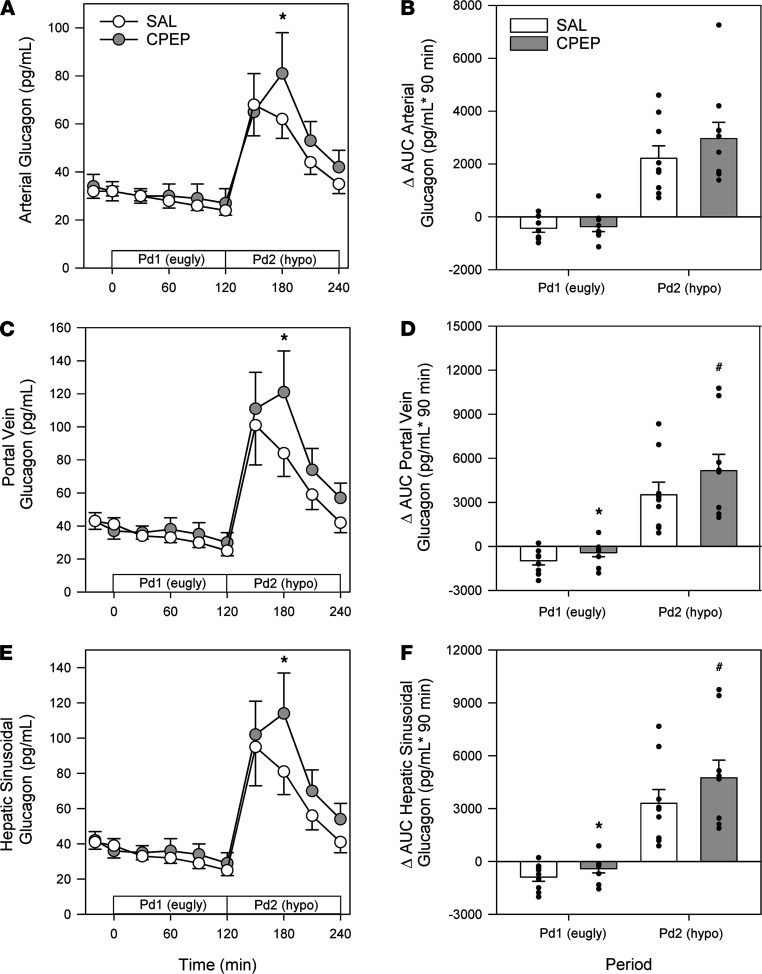
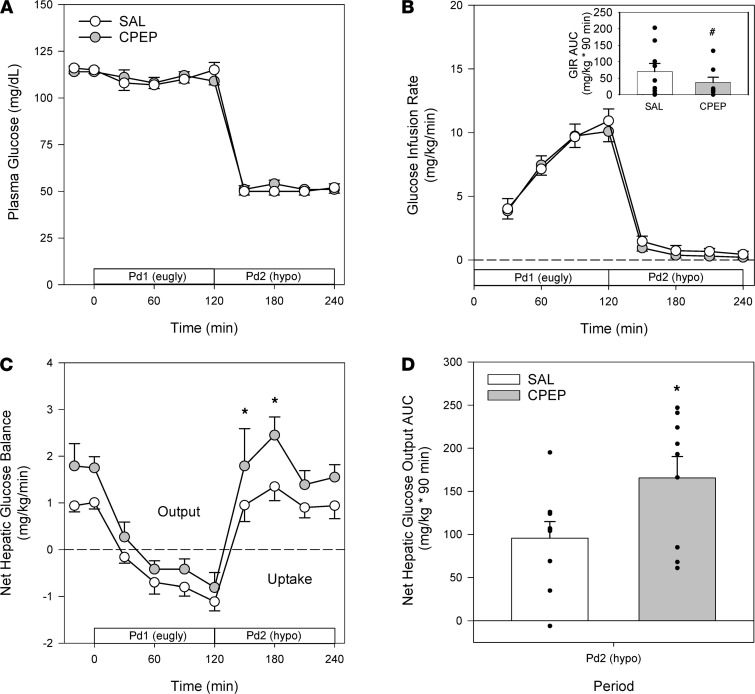
Several studies have associated the presence of residual insulin secretion capability (also referred to as being C-peptide positive) with lower risk of insulin-induced hypoglycemia in patients with type 1 diabetes (T1D), although the reason is unclear. We tested the hypothesis that C-peptide infusion would enhance glucagon secretion in response to hyperinsulinemia during euglycemic and hypoglycemic conditions in dogs (5 male/4 female). After a 2-hour basal period, an intravenous (IV) infusion of insulin was started, and dextrose was infused to maintain euglycemia for 2 hours. At the same time, an IV infusion of either saline (SAL) or C-peptide (CPEP) was started. After this euglycemic period, the insulin and SAL/CPEP infusions were continued for another 2 hours, but the glucose was allowed to fall to approximately 50 mg/dL. In response to euglycemic-hyperinsulinemia, glucagon secretion decreased in SAL but remained unchanged from the basal period in CPEP condition. During hypoglycemia, glucagon secretion in CPEP was 2 times higher than SAL, and this increased net hepatic glucose output and reduced the amount of exogenous glucose required to maintain glycemia. These data suggest that the presence of C-peptide during IV insulin infusion can preserve glucagon secretion during euglycemia and enhance it during hypoglycemia, which could explain why T1D patients with residual insulin secretion are less susceptible to hypoglycemia.
Keywords: Glucose metabolism; Metabolism.
Conflict of interest statement
Figures


References
-
- Martyn-Nemeth P, et al. Fear of hypoglycemia in adults with type 1 diabetes: impact of therapeutic advances and strategies for prevention - a review. J Diabetes Complications. 2016;30(1):167–177. - PubMed
-
- Dagogo-Jack SE, et al. Hypoglycemia-associated autonomic failure in insulin-dependent diabetes mellitus. Recent antecedent hypoglycemia reduces autonomic responses to, symptoms of, and defense against subsequent hypoglycemia. J Clin Invest. 1993;91(3):819–828. doi: 10.1172/JCI116302. - DOI - PMC - PubMed
-
- Barrou Z, et al. Pancreas transplantation in diabetic humans normalizes hepatic glucose production during hypoglycemia. Diabetes. 1994;43(5):661–666. - PubMed
Publication types
MeSH terms
Substances
Grants and funding
LinkOut - more resources
Full Text Sources
Other Literature Sources
Medical
