. 2021 Jul 1;131(13):e148517.
doi: 10.1172/JCI148517.

Nasal ciliated cells are primary targets for SARS-CoV-2 replication in the early stage of COVID-19

Affiliations

Nasal ciliated cells are primary targets for SARS-CoV-2 replication in the early stage of COVID-19

Ji Hoon Ahn et al. J Clin Invest. .

Abstract

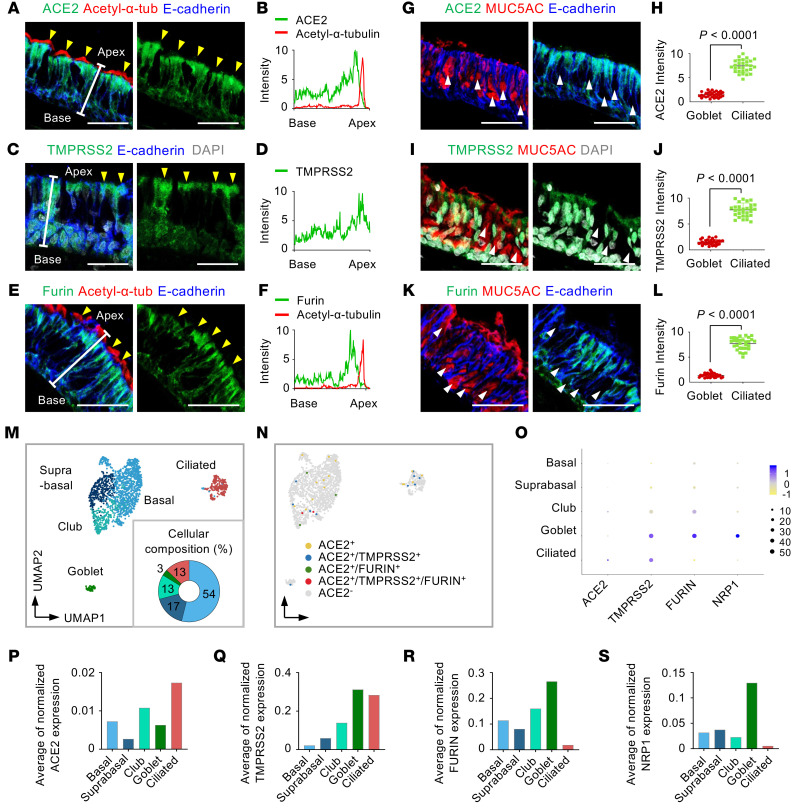
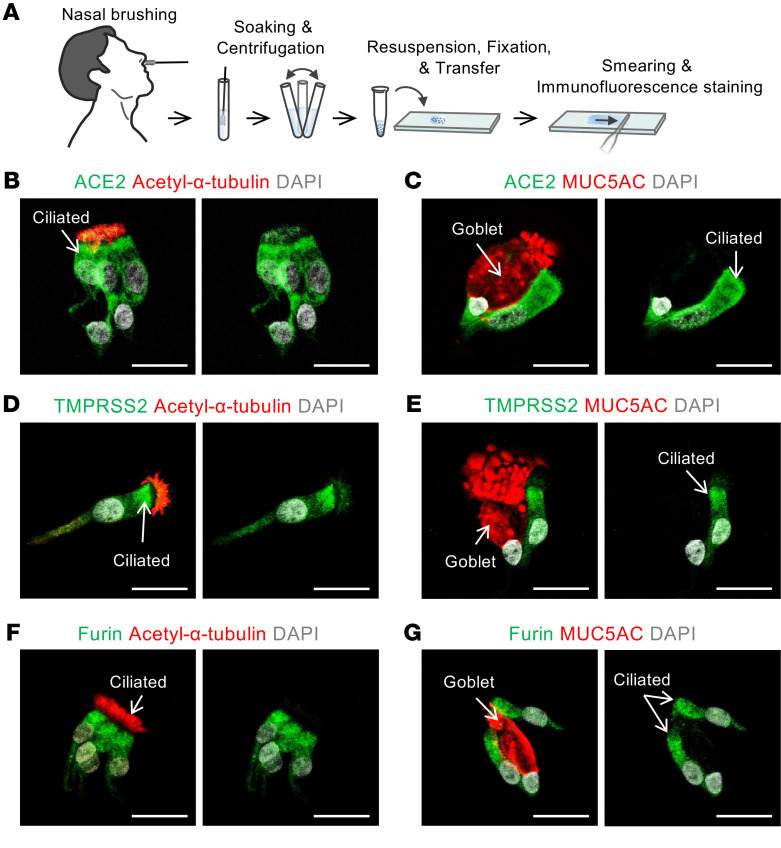
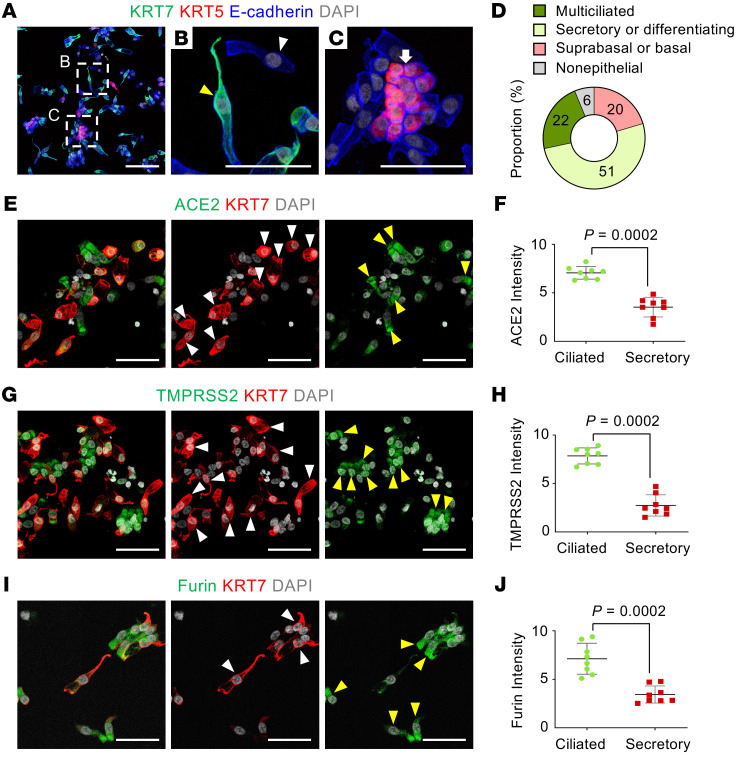
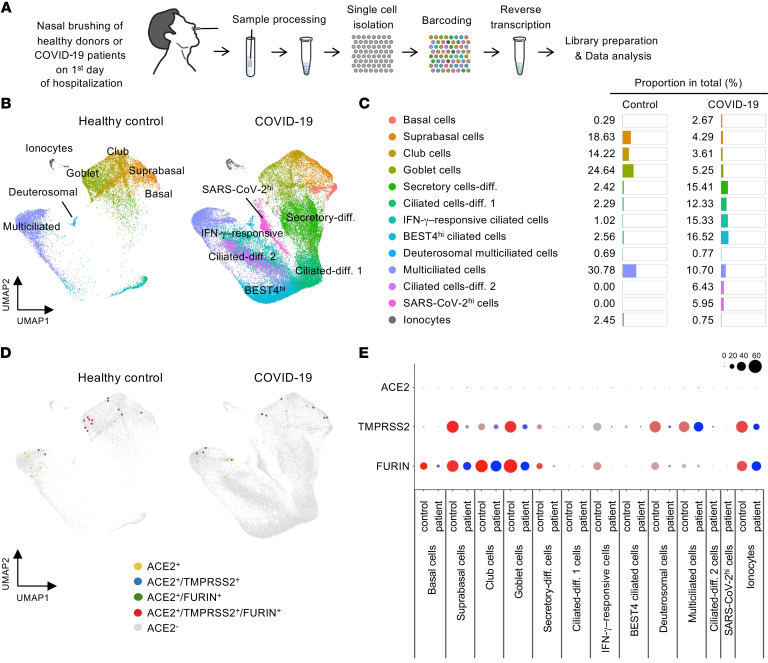
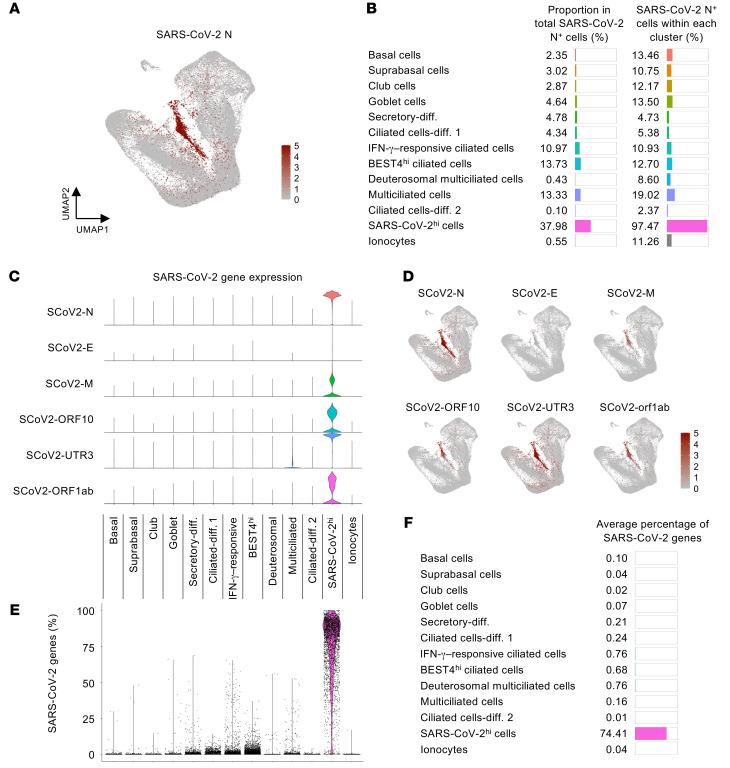
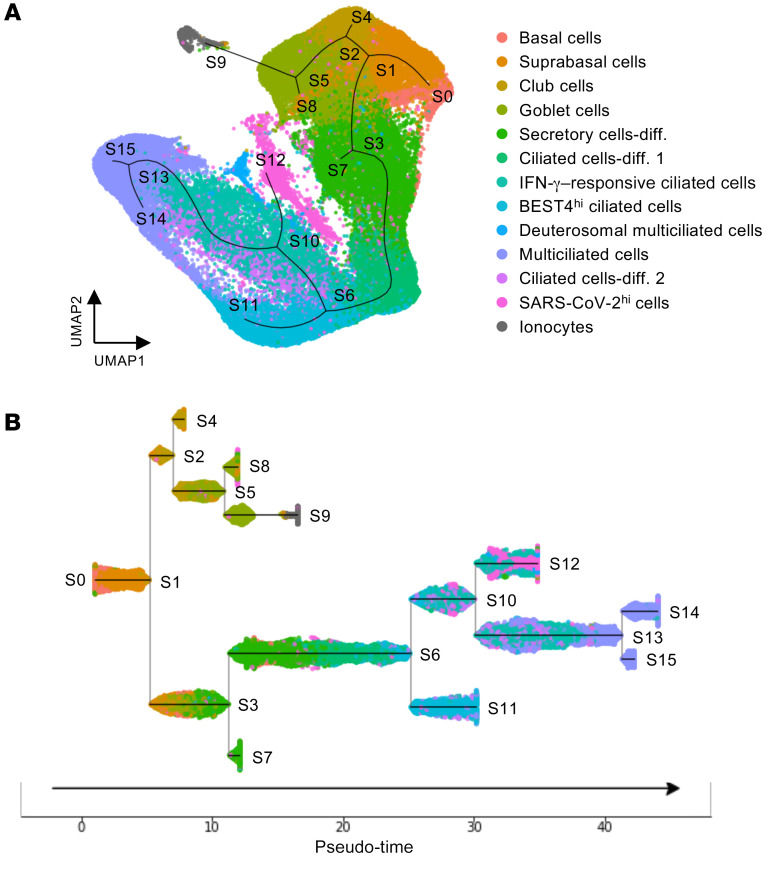
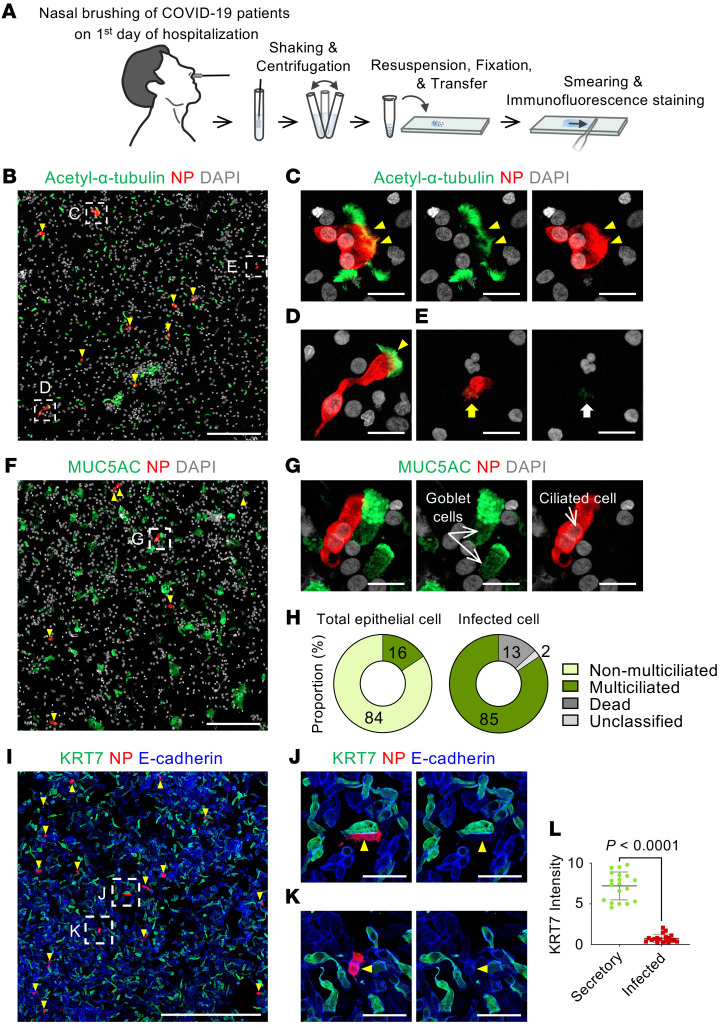
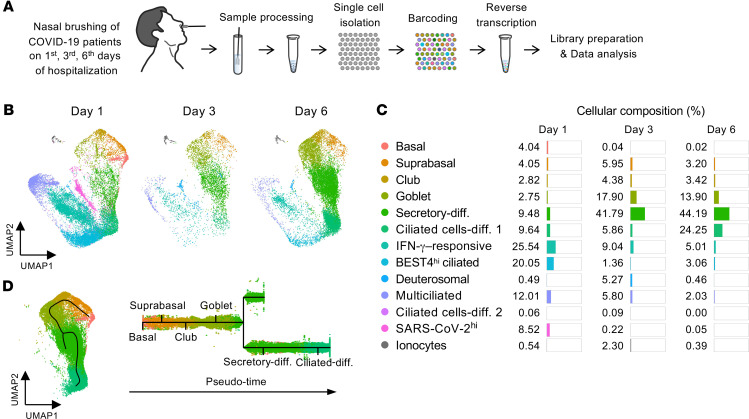
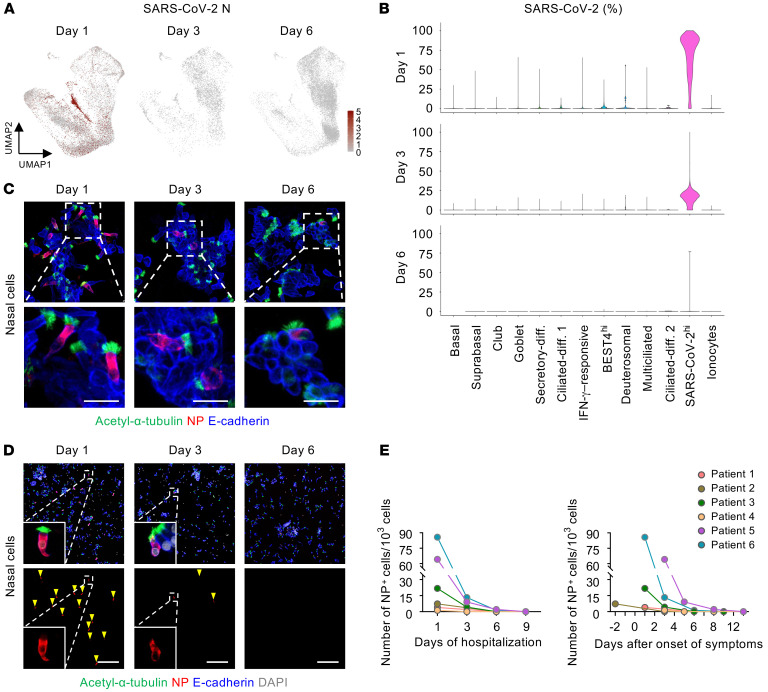
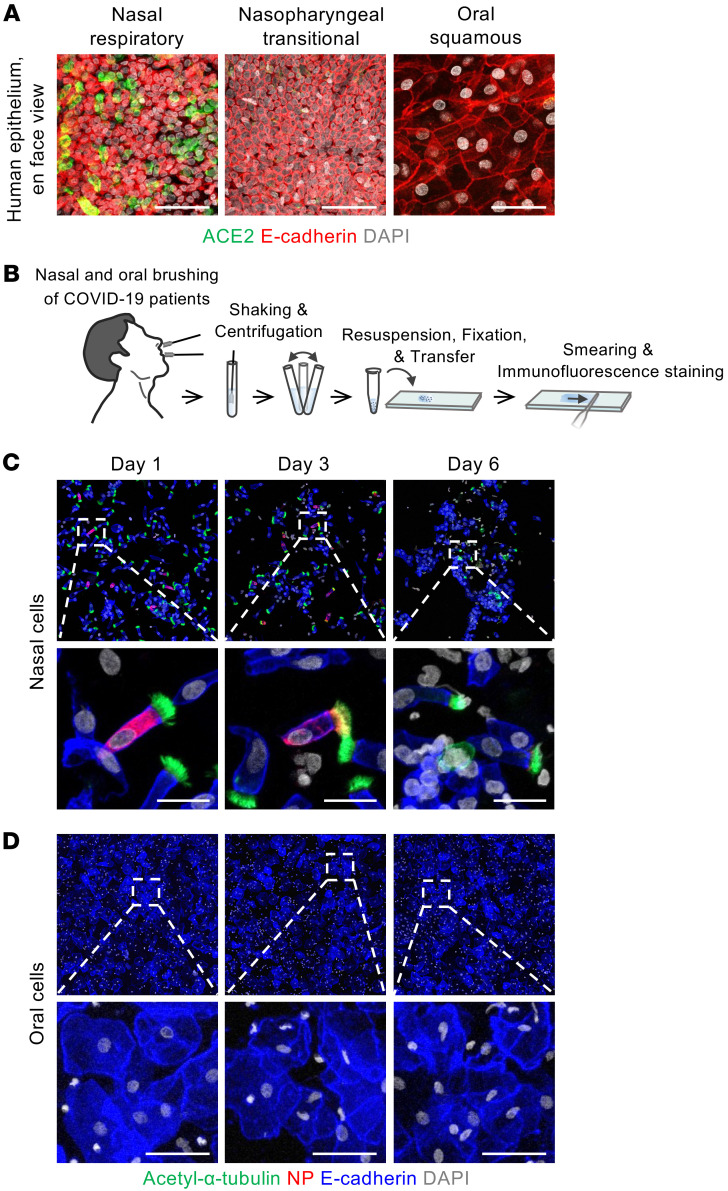
The upper respiratory tract is compromised in the early period of COVID-19, but SARS-CoV-2 tropism at the cellular level is not fully defined. Unlike recent single-cell RNA-Seq analyses indicating uniformly low mRNA expression of SARS-CoV-2 entry-related host molecules in all nasal epithelial cells, we show that the protein levels are relatively high and that their localizations are restricted to the apical side of multiciliated epithelial cells. In addition, we provide evidence in patients with COVID-19 that SARS-CoV-2 is massively detected and replicated within the multiciliated cells. We observed these findings during the early stage of COVID-19, when infected ciliated cells were rapidly replaced by differentiating precursor cells. Moreover, our analyses revealed that SARS-CoV-2 cellular tropism was restricted to the nasal ciliated versus oral squamous epithelium. These results imply that targeting ciliated cells of the nasal epithelium during the early stage of COVID-19 could be an ideal strategy to prevent SARS-CoV-2 propagation.

Keywords: COVID-19; Infectious disease; Molecular pathology.


Conflict of interest statement

Conflict of interest: The authors have declared that no conflict of interest exists.

Figures

Figure 1
Figure 1. The mismatch between protein and mRNA expression pattern of SARS-CoV-2 entry molecules in human nasal mucosa epithelium.
(AF) Representative images of cross-sectional view of human nasal epithelium showing robust ACE2, TMPRSS2, and FURIN protein in acetylated α-tubulin+ ciliated epithelium (yellow arrowheads). Scale bars: 50 μm. Similar findings were observed in n = 3 normal human tissues from 3 independent experiments. (B, D, and F) Profile analysis of relative signal intensity of ACE2, TMPRSS2, and FURIN along the white line in A, C, and E. (G, I, and K) Representative images of cross-sectional views of human nasal epithelium showing that ACE2, TMPRSS2, and FURIN were not distinctly detected in MUC5AC+ goblet cells (white arrowheads). Scale bars: 50 μm. Similar findings were observed in 3 human tissues from 3 independent experiments. (H, J, and L) Comparison of relative ACE2 signal intensity between ciliated cells and goblet cells. Each dot indicates a value measured from 1 section in 3 human tissues (n = 10 sections per tissue) from 3 independent experiments. Horizontal bars indicate the mean ± SD. P value versus ciliated cells was obtained by 2-tailed Mann-Whitney U test. (M) Unsupervised clustering of 1721 pooled human nasal epithelial cells projected on a 2D UMAP plot, and donut plot showing 5 major clusters and cellular composition of the epithelial cells. (N) UMAP plot showing distribution of ACE2+, ACE2+/TMPRSS2+, ACE2+/FURIN+, ACE2+/TMPRSS2+/FURIN+, and ACE2 cells across all clustered epithelial cells. (O) Dot plot heatmap showing expression of SARS-CoV-2 entry–related host molecule genes per each indicated cluster. (PS) Comparison of the average of normalized expression level of each SARS-CoV-2 entry–related host molecule gene per each indicated cluster.
Figure 2
Figure 2. Human nasal cytology reveals that SARS-CoV-2 entry molecules are located at the apical side of multiciliated cells.
(A) Schematic diagram of a series of procedures for human nasal cytology by nasal brushing and preparation of nasal cell smear onto slide. (BG) Representative images showing that ACE2, TMPRSS2, and FURIN are abundant in the apical side of acetylated α-tubulin+ multiciliated cells, but very limited or absent in MUC5AC+ goblet cells in the smeared nasal cells. Scale bars: 25 μm. Similar findings were observed in 3 healthy volunteers from 2 independent experiments.
Figure 3
Figure 3. SARS-CoV-2 entry molecule proteins are highly present in fully differentiated multiciliated cells, but not in secretory or differentiating cells.
(AC) Representative images showing subtypes of human nasal epithelial cells. White-dashed boxes in A are magnified in B and C. Scale bar in A: 100 μm. (B) Image showing KRT7hi secretory- or differentiating-type cells (yellow arrowhead) and KRT5lo/KRT7lo fully differentiated multiciliated cells (white arrowhead). Scale bar: 50 μm. (C) Image showing KRT5hi basal type cells (white arrow). Scale bar: 50 μm. (D) Donut plot showing subtype proportions in 1538 pooled smeared nasal epithelial cells of healthy volunteers (n = 3). (EJ) Representative images and comparisons of relative ACE2, TMPRSS2, and FURIN intensity in the smeared nasal cells, showing high in KRT7lo fully differentiated multiciliated cells (yellow arrowheads) but very low in KRT7hi secretory or differentiating cells (white arrowheads). Scale bars: 50 μm. (F, H, and J) Each dot indicates a value obtained from 1 smear sample in 3 volunteers (3 smeared slides per volunteer) from 2 independent experiments. Horizontal bars indicate the mean ± SD. P value versus ciliated cells was obtained by 2-tailed Mann-Whitney U test.
Figure 4
Figure 4. Comparison of cellular composition and SARS-CoV-2 entry molecular gene expression in nasal epithelial cells between healthy donors and patients with COVID-19.
(A) Schematic diagram depicting a series of procedures for scRNA-Seq of nasal epithelial cells from COVID-19 patients. (B) UMAP plot comparing unsupervised clustering of nasal epithelial cell subsets between healthy controls and patients with COVID-19. (C) List and proportion plots comparing proportion of each epithelial cell subset in total clustered epithelial cells between healthy controls and COVID-19 patients. (D) Unsupervised clustering projected on a 2D UMAP plot comparing distributions of ACE2+, ACE2+/TMPRSS2+, ACE2+/FURIN+, and ACE2+/TMPRSS2+/FURIN+ cells across total pooled nasal epithelial cells between healthy controls and COVID-19 patients. (E) Dot plot heatmap comparing expressions of SARS-CoV-2 entry molecule genes per each cell cluster between healthy controls and COVID-19 patients.
Figure 5
Figure 5. scRNA-Seq identifies a distinct nasal epithelial cell subset in which SARS-CoV-2 is massively replicated in patients with COVID-19.
(A) Normalized mRNA expression level of SARS-CoV-2 nucleocapsid (N) in total clustered epithelial cells projected on UMAP plot. (B) List and proportion plots showing proportion of each epithelial cell subset in total SARS-CoV-2 N+ cells (left) and proportion of SARS-CoV-2 N+ cells within each cluster (right). (C) Violin plots depicting normalized mRNA expression levels of indicated SARS-CoV-2 genes in each cluster. (D) Normalized mRNA expression levels of indicated SARS-CoV-2 genes in total clustered epithelial cells projected on UMAP plot. (E) Comparison of proportion of SARS-CoV-2 genes among total detected genes per cell in each cluster. (F) List and proportion plots showing average percentages of SARS-CoV-2 genes in each cluster.
Figure 6
Figure 6. Trajectory inference for human nasal epithelial cells in patients with COVID-19.
(A) Pseudo-time trajectory projected on UMAP plot depicting inferred differentiation pathway in total pooled nasal epithelial cells of healthy controls and COVID-19 patients. (B) Subway map plot showing pseudo-temporal ordering of total pooled nasal epithelial cells. Note that SARS-CoV-2hi cells are placed along a continuous path with IFN-γ–responsive ciliated cells.
Figure 7
Figure 7. Nucleocapsid protein of SARS-CoV-2 is detected exclusively in multiciliated epithelial cells of patients with COVID-19.
(A) Schematic diagram of a series of procedures for human nasal cytology by nasal brushing and preparation of nasal cell smear onto slide. (BE) Representative images showing detection of SARS-CoV-2 nucleocapsid protein (NP) in acetylated-α-tubulin+ multiciliated epithelial cells (yellow arrowheads) (BD) and SARS-CoV-2–infected dead cells (E). Box regions are magnified in right panels. Note cell shrinkage (yellow arrow) and loss of cilia and nucleus (white arrow). Scale bars: 200 μm (B); 20 μm (CE). Similar findings were observed in n = 6 COVID-19 patients. (F and G) Representative images showing no SARS-CoV-2 NP in MUC5AC+ goblet cells. Box region is magnified and displayed as G. Scale bars: 200 μm (F); 20 μm (G). Similar findings were observed in 6 patients with COVID-19. (H) Donut plots presenting proportion of indicated cell subtypes in about 2449 pooled epithelial cells and 1606 pooled infected cells from 3 patients with COVID-19. (IK) Representative images showing no SARS-CoV-2 NP (yellow arrowheads) in KRT7hi secretory or differentiating cells. Box regions are magnified and displayed as J and K. Scale bars: 500 μm (I); 50 μm (J and K). (L) Comparison of KRT7 intensity between secretory cells and SARS-CoV-2–infected cells. Each dot indicates a value obtained from 1 smear sample in 5 patients (4 smeared slides per patient) from 2 independent experiments. Horizontal bars indicate mean ± SD. P value versus secretory cells was obtained by 2-tailed Mann-Whitney U test.
Figure 8
Figure 8. Nasal ciliated epithelial cells of patients with COVID-19 are rapidly replaced by precursor cells.
(A) Schematic diagram depicting a series of procedures for scRNA-Seq of nasal epithelial cells from COVID-19 patients, which were sampled on the first, third, and sixth days of hospitalization. (B and C) UMAP plots showing changes in populations of the epithelial cell clusters, and list and proportion plots showing proportion of each epithelial cell subset in total clustered epithelial cells on the indicated days of hospitalization. (D) Subway map plot presenting pseudo-time differentiation paths from basal cell cluster to differentiated ciliated cell cluster.
Figure 9
Figure 9. Replication and shedding of SARS-CoV-2 occur in the nasal multiciliated cells during the early stage of COVID-19.
(A) UMAP plots showing changes of normalized mRNA expression levels of SARS-CoV-2 N in total clustered epithelial cells on the indicated days of hospitalization. (B) Violin plots depicting proportion of SARS-CoV-2 genes among total detected genes per cell in each cell cluster on the indicated days of hospitalization. (C and D) Representative images showing a rapid reduction in signal intensity and number of SARS-CoV-2 NP in multiciliated cells (yellow arrowheads) during the hospitalization. Dashed box regions are magnified in lower panels or insets. Scale bars: 20 μm (C); 200 μm (D). Similar findings were observed in 6 patients with COVID-19. (E) Changes in the number of SARS-CoV-2 NP+ cells per 103 smeared cells in 6 patients with COVID-19 on the indicated days of hospitalization or after symptom onset.
Figure 10
Figure 10. SARS-CoV-2 is not replicated in oral squamous epithelial cells.
(A) Representative images of en face view of ACE2 protein signal in human nasal respiratory, nasopharynx transitional, and oral squamous epithelia. Scale bars: 50 μm. Similar findings were observed in 2 normal tissues from 2 independent experiments. (B) Schematic diagram depicting a series of procedures of brushing cytology for nasal and oral epithelial cells of COVID-19 patients (n = 6) sampled on the first, third, and sixth days of hospitalization. (C and D) Representative images showing that SARS-CoV-2 NP is detected in nasal multiciliated epithelial cells but not in oral squamous epithelial cells on the indicated days of hospitalization. Box regions are magnified in lower panels. Scale bars: 20 μm (C); 50 μm (D). Similar findings were observed in 6 patients with COVID-19.

References

    1. Tay MZ, et al. The trinity of COVID-19: immunity, inflammation and intervention. Nat Rev Immunol. 2020;20(6):363–374. doi: 10.1038/s41577-020-0311-8. - DOI - PMC - PubMed
    1. Gupta A, et al. Extrapulmonary manifestations of COVID-19. Nat Med. 2020;26(7):1017–1032. doi: 10.1038/s41591-020-0968-3. - DOI - PMC - PubMed
    1. Lamers MM, et al. SARS-CoV-2 productively infects human gut enterocytes. Science. 2020;369(6499):50–54. doi: 10.1126/science.abc1669. - DOI - PMC - PubMed
    1. Gandhi RT, et al. Mild or moderate Covid-19. N Engl J Med. 2020;383(18):1757–1766. doi: 10.1056/NEJMcp2009249. - DOI - PubMed
    1. Liu Y, et al. Aerodynamic analysis of SARS-CoV-2 in two Wuhan hospitals. Nature. 2020;582(7813):557–560. doi: 10.1038/s41586-020-2271-3. - DOI - PubMed

Publication types

MeSH terms