

Mathematical modeling of multiple pathways in colorectal carcinogenesis using dynamical systems with Kronecker structure
- PMID: 34003820
- PMCID: PMC8162698
- DOI: 10.1371/journal.pcbi.1008970
Mathematical modeling of multiple pathways in colorectal carcinogenesis using dynamical systems with Kronecker structure
Abstract
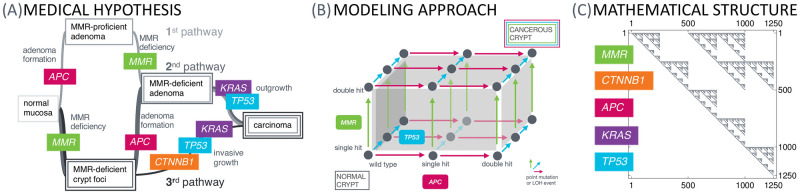
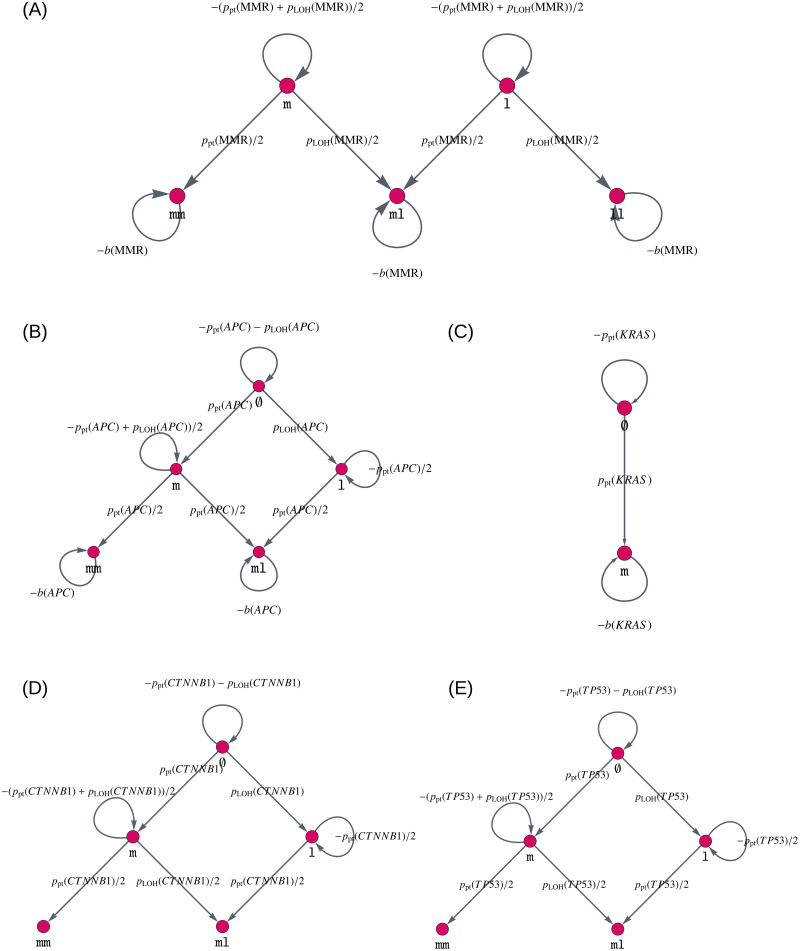
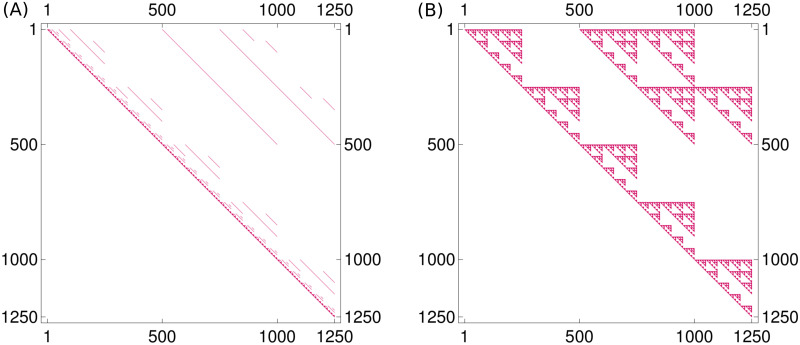
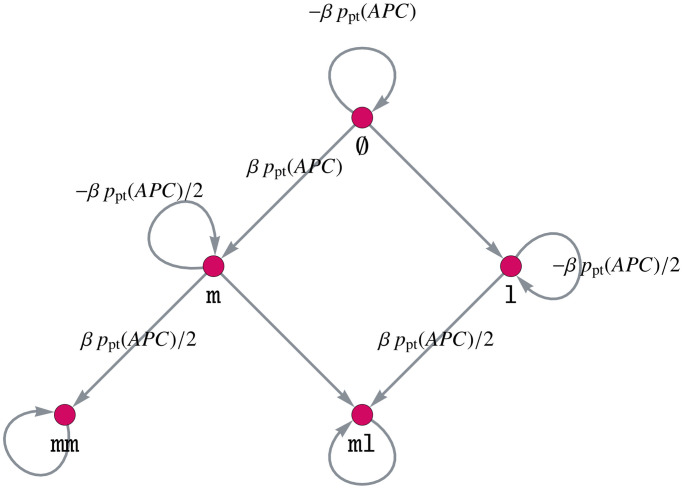
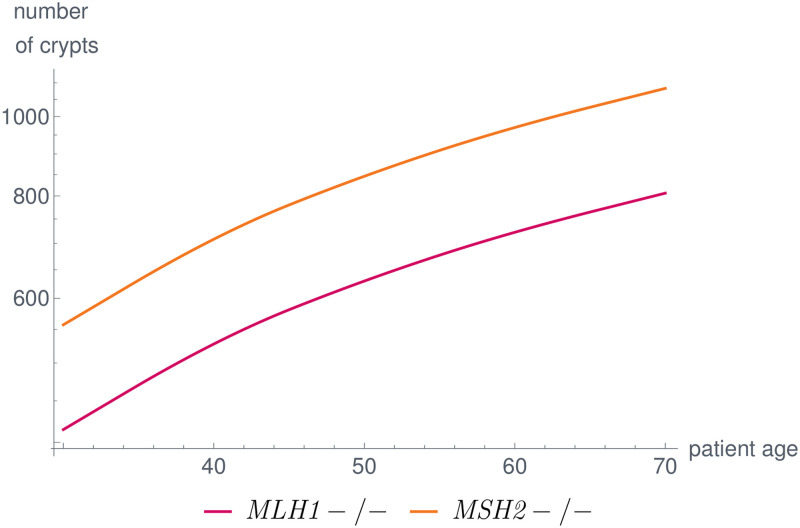
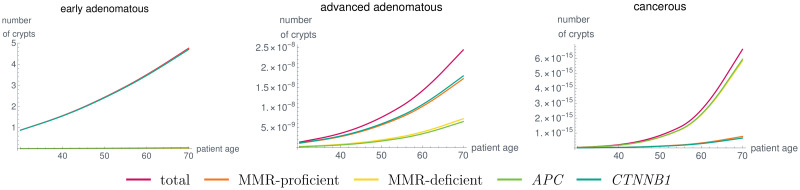
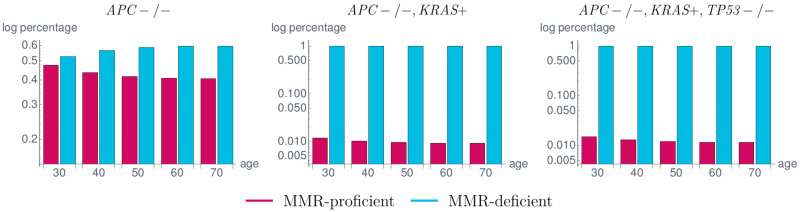
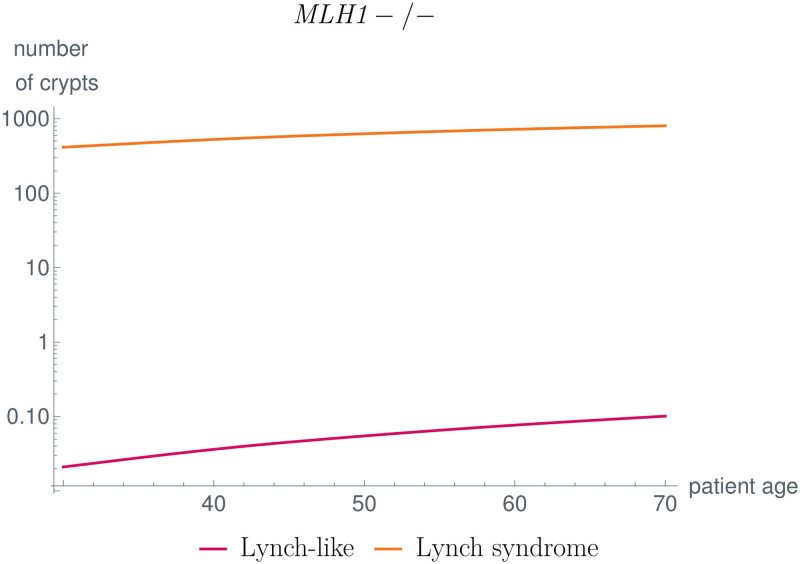
Like many other types of cancer, colorectal cancer (CRC) develops through multiple pathways of carcinogenesis. This is also true for colorectal carcinogenesis in Lynch syndrome (LS), the most common inherited CRC syndrome. However, a comprehensive understanding of the distribution of these pathways of carcinogenesis, which allows for tailored clinical treatment and even prevention, is still lacking. We suggest a linear dynamical system modeling the evolution of different pathways of colorectal carcinogenesis based on the involved driver mutations. The model consists of different components accounting for independent and dependent mutational processes. We define the driver gene mutation graphs and combine them using the Cartesian graph product. This leads to matrix components built by the Kronecker sum and product of the adjacency matrices of the gene mutation graphs enabling a thorough mathematical analysis and medical interpretation. Using the Kronecker structure, we developed a mathematical model which we applied exemplarily to the three pathways of colorectal carcinogenesis in LS. Beside a pathogenic germline variant in one of the DNA mismatch repair (MMR) genes, driver mutations in APC, CTNNB1, KRAS and TP53 are considered. We exemplarily incorporate mutational dependencies, such as increased point mutation rates after MMR deficiency, and based on recent experimental data, biallelic somatic CTNNB1 mutations as common drivers of LS-associated CRCs. With the model and parameter choice, we obtained simulation results that are in concordance with clinical observations. These include the evolution of MMR-deficient crypts as early precursors in LS carcinogenesis and the influence of variants in MMR genes thereon. The proportions of MMR-deficient and MMR-proficient APC-inactivated crypts as first measure for the distribution among the pathways in LS-associated colorectal carcinogenesis are compatible with clinical observations. The approach provides a modular framework for modeling multiple pathways of carcinogenesis yielding promising results in concordance with clinical observations in LS CRCs.
Conflict of interest statement
The authors have declared that no competing interests exist.
Figures
Similar articles
-
Three molecular pathways model colorectal carcinogenesis in Lynch syndrome.Int J Cancer. 2018 Jul 1;143(1):139-150. doi: 10.1002/ijc.31300. Epub 2018 Feb 23. Int J Cancer. 2018. PMID: 29424427
-
The coding microsatellite mutation profile of PMS2-deficient colorectal cancer.Exp Mol Pathol. 2021 Oct;122:104668. doi: 10.1016/j.yexmp.2021.104668. Epub 2021 Jul 22. Exp Mol Pathol. 2021. PMID: 34302852
-
Next-generation sequencing reveals heterogeneous genetic alterations in key signaling pathways of mismatch repair deficient colorectal carcinomas.Mod Pathol. 2020 Dec;33(12):2591-2601. doi: 10.1038/s41379-020-0612-2. Epub 2020 Jul 3. Mod Pathol. 2020. PMID: 32620917
-
The diverse molecular profiles of lynch syndrome-associated colorectal cancers are (highly) dependent on underlying germline mismatch repair mutations.Crit Rev Oncol Hematol. 2021 Jul;163:103338. doi: 10.1016/j.critrevonc.2021.103338. Epub 2021 May 25. Crit Rev Oncol Hematol. 2021. PMID: 34044097 Review.
-
Lynch syndrome and Lynch syndrome mimics: The growing complex landscape of hereditary colon cancer.World J Gastroenterol. 2015 Aug 21;21(31):9253-61. doi: 10.3748/wjg.v21.i31.9253. World J Gastroenterol. 2015. PMID: 26309352 Free PMC article. Review.
Cited by
-
A mechanistic mathematical model of initiation and malignant transformation in sporadic vestibular schwannoma.Br J Cancer. 2022 Nov;127(10):1843-1857. doi: 10.1038/s41416-022-01955-8. Epub 2022 Sep 12. Br J Cancer. 2022. PMID: 36097176 Free PMC article.
-
Review article: Lynch Syndrome-a mechanistic and clinical management update.Aliment Pharmacol Ther. 2022 Apr;55(8):960-977. doi: 10.1111/apt.16826. Epub 2022 Mar 21. Aliment Pharmacol Ther. 2022. PMID: 35315099 Free PMC article. Review.
-
Colorectal carcinogenesis in the Lynch syndromes and familial adenomatous polyposis: trigger events and downstream consequences.Hered Cancer Clin Pract. 2025 Jan 23;23(1):3. doi: 10.1186/s13053-025-00305-y. Hered Cancer Clin Pract. 2025. PMID: 39849512 Free PMC article. Review.
-
Mathematical modeling the order of driver gene mutations in colorectal cancer.PLoS Comput Biol. 2023 Jun 27;19(6):e1011225. doi: 10.1371/journal.pcbi.1011225. eCollection 2023 Jun. PLoS Comput Biol. 2023. PMID: 37368936 Free PMC article.
-
Anticancer drug resistance: An update and perspective.Drug Resist Updat. 2021 Dec;59:100796. doi: 10.1016/j.drup.2021.100796. Epub 2021 Dec 16. Drug Resist Updat. 2021. PMID: 34953682 Free PMC article. Review.
References
-
- Bray F, Ferlay J, Soerjomataram I, Siegel RL, Torre LA, Jemal A. Global cancer statistics 2018: GLOBOCAN estimates of incidence and mortality worldwide for 36 cancers in 185 countries. CA: A Cancer Journal for Clinicians. 2018;68(6):394–424. - PubMed
-
- Klimstra D, Klöppel G, La Rosa S, Rindi G. Classification of neuroendocrine neoplasms of the digestive system. WHO Classification of tumours, 5th Edition Digestive system tumours. 2019; p. 16–19.
MeSH terms
LinkOut - more resources
Full Text Sources
Other Literature Sources
Medical
Research Materials
Miscellaneous
