. 2021 May 18;17(5):e1008999.
doi: 10.1371/journal.pcbi.1008999. eCollection 2021 May.

Real-time single-cell characterization of the eukaryotic transcription cycle reveals correlations between RNA initiation, elongation, and cleavage

Affiliations

Real-time single-cell characterization of the eukaryotic transcription cycle reveals correlations between RNA initiation, elongation, and cleavage

Jonathan Liu et al. PLoS Comput Biol. .

Abstract

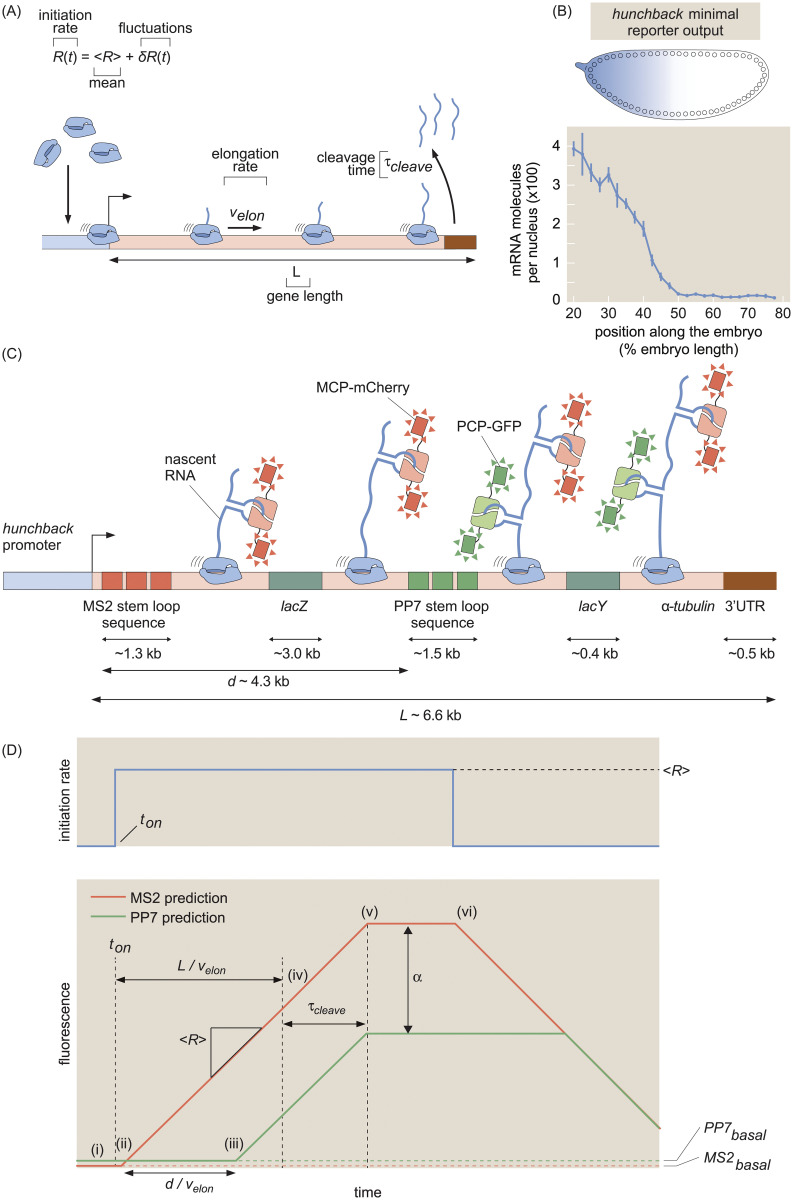
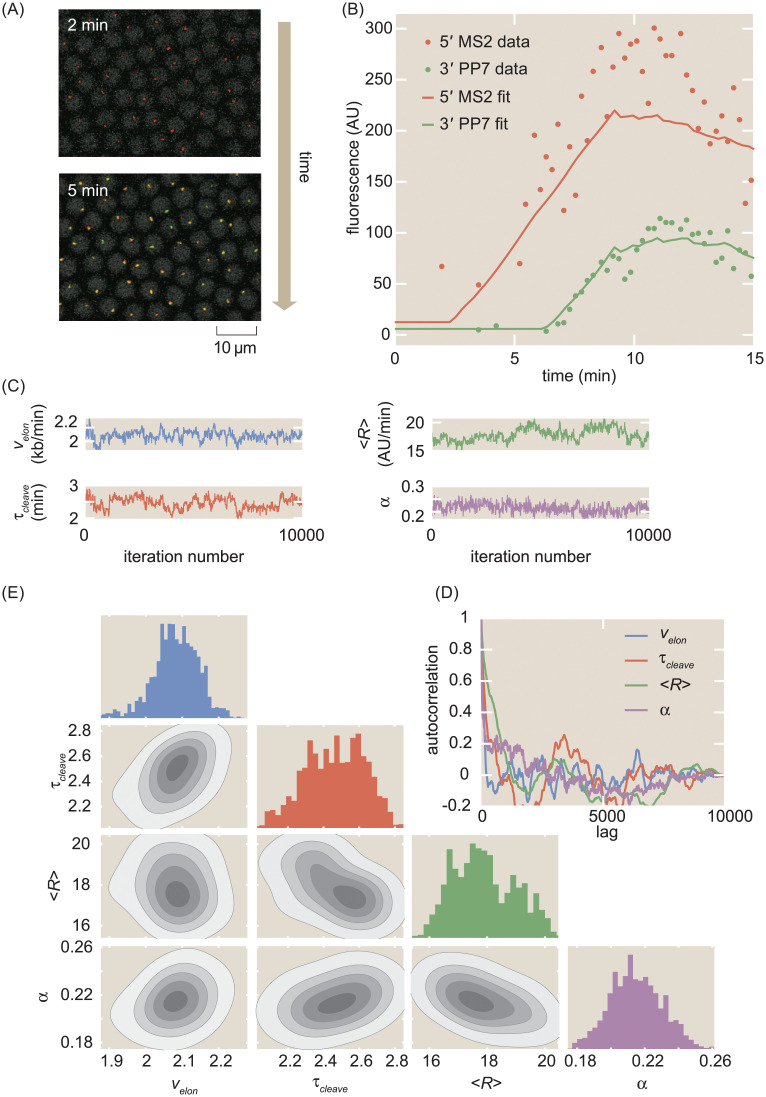
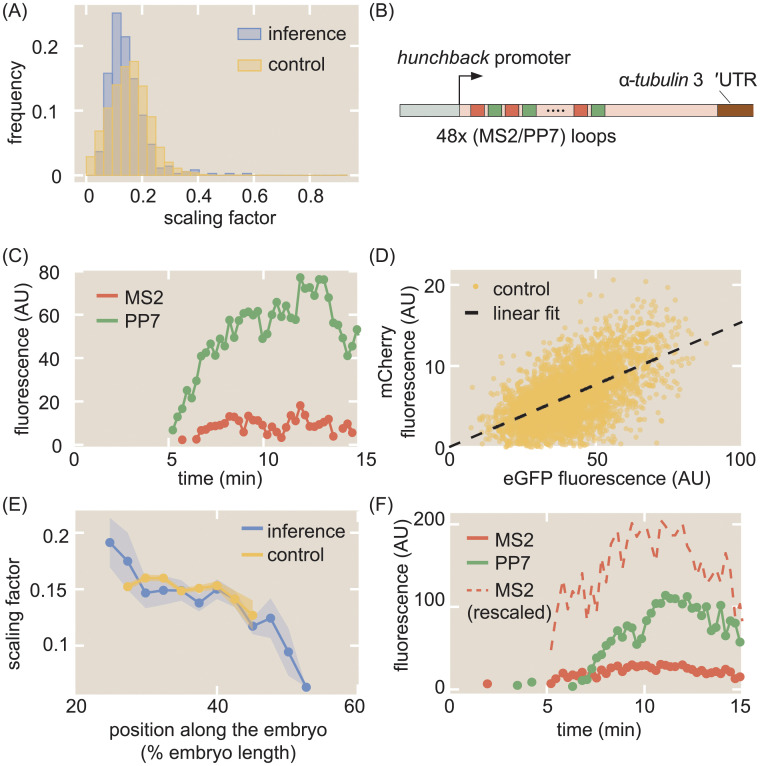
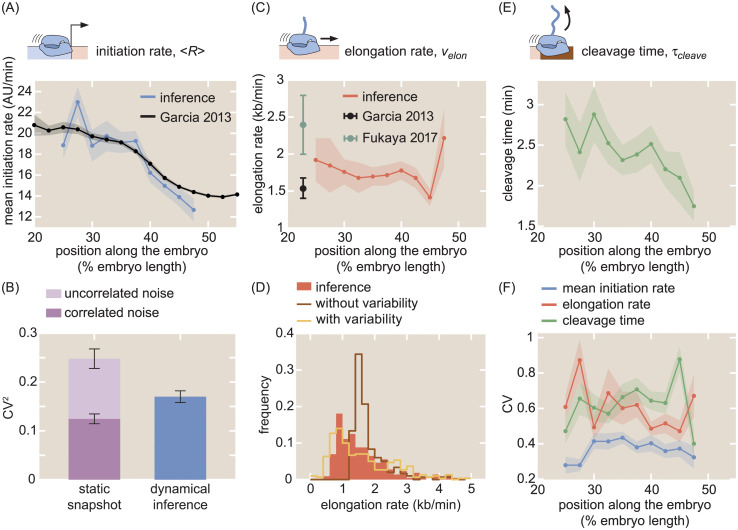
The eukaryotic transcription cycle consists of three main steps: initiation, elongation, and cleavage of the nascent RNA transcript. Although each of these steps can be regulated as well as coupled with each other, their in vivo dissection has remained challenging because available experimental readouts lack sufficient spatiotemporal resolution to separate the contributions from each of these steps. Here, we describe a novel application of Bayesian inference techniques to simultaneously infer the effective parameters of the transcription cycle in real time and at the single-cell level using a two-color MS2/PP7 reporter gene and the developing fruit fly embryo as a case study. Our method enables detailed investigations into cell-to-cell variability in transcription-cycle parameters as well as single-cell correlations between these parameters. These measurements, combined with theoretical modeling, suggest a substantial variability in the elongation rate of individual RNA polymerase molecules. We further illustrate the power of this technique by uncovering a novel mechanistic connection between RNA polymerase density and nascent RNA cleavage efficiency. Thus, our approach makes it possible to shed light on the regulatory mechanisms in play during each step of the transcription cycle in individual, living cells at high spatiotemporal resolution.


Conflict of interest statement

The authors have declared that no competing interests exist.

Figures

Fig 1
Fig 1. Theoretical model of the transcription cycle and experimental setup.
(A) Simple model of the transcription cycle, incorporating nascent RNA initiation, elongation, and cleavage. (B) The reporter construct, which is driven by the hunchback P2 minimal enhancer and promoter, is expressed in a step-like fashion along the anterior-posterior axis of the fruit fly embryo. (C) Transcription of the stem loops results in fluorescent puncta with the 5’ mCherry signal appearing before the signal from 3’ GFP. Only one stem loop per fluorophore is shown for clarity, but the actual construct contains 24 repeats of each stem loop. (D, top) Relationship between fluorescence trace profiles and model parameters for an initiation rate consisting of a pulse of constant magnitude 〈R〉. (D, bottom, i) At first, the zero initiation rate results in no fluorescence other than the basal levels MS2basal and PP7basal (red and green dashed lines). (ii) When initiation commences at time ton, RNAP molecules load onto the promoter and elongation of nascent transcripts occurs, resulting in a constant increase in the MS2 signal (red curve). (iii) After time dvelon, the first RNAP molecules reach the PP7 stem loops and the PP7 signal also increases at a constant rate. (iv) After time Lvelon, the first RNAP molecules reach the end of the gene, and (v) after the cleavage time τcleave, these first nascent transcripts are cleaved. The subsequent loss of fluorescence is balanced by the addition of new nascent transcripts, resulting in a plateauing of the signal. (vi) Once the initiation rate shuts off, no new RNAP molecules are added and both fluorescence signals will start to decrease due to cleavage of the nascent transcripts still on the gene. Because elongation continues after initiation has ceased, the 5’ MS2 signal begins decreasing before the 3’ PP7 signal. The MS2 and PP7 fluorescent signals are rescaled to be in the same arbitrary units with the calibration factor α. (Data in (B) adapted from [25] with the line representing the mean and error bars representing the standard error across 24 embryos).
Fig 2
Fig 2. MCMC inference procedure.
(A) Snapshots of confocal microscopy data over time, with MS2-mCherry (red) and PP7-eGFP (green) puncta reporting on transcription activity. Gray circles correspond to iRFP-labeled histones whose fluorescence is used as a fiduciary marker for cell nucleus segmentation (see Methods and materials for details). (B) Sample single-cell MS2 and PP7 fluorescence (points) together with best-fits of the model using MCMC inference (curves). (C) Raw MCMC inference chains for the elongation rate velon, cleavage time τcleave, mean initiation rate 〈R〉, and calibration factor α for the inference results of a sample single cell. (D) Auto-correlation function for the raw chains in (A) as a function of lag (i.e. inference sample number). (E) Corner plot of the raw chains shown in (C).
Fig 3
Fig 3. Calibration of MS2 and PP7 fluorescence signals.
(A) Histogram of inferred values of α at the single-cell level from inference (blue), along with histogram of α values from the control experiment (yellow). (B) Schematic of construct used to measure the calibration factor α using 24 interlaced MS2/PP7 loops (48 loops in total). (C) Sample single-cell MS2 (red) and PP7 (green) traces from this control experiment. (D) Scatter plot of MS2 and PP7 fluorescence values for each time point (yellow) along with linear best fit (black) resulting in α = 0.154 ± 0.001. (E) Position-dependent mean value of α in both the inference (blue) and the control experiment (yellow). (F) Representative raw and rescaled MS2 and PP7 traces for a sample single cell in the inference data set. (A, D, E, data were collected for 314 cells across 4 embryos for the interlaced reporter, and for 355 cells across 7 embryos for the reporter with MS2 on the 5’ and PP7 on the 3’ of the gene (Fig 1C); shaded regions in (E) reflect standard error of the mean. Measurement conditions for both experiments are described in Methods and materials).
Fig 4
Fig 4. Inferred transcription-cycle parameters.
(A) Mean inferred transcription initiation rate as a function of embryo position (blue), along with rescaled previously reported results (black, [25]). (B) Comparison of the squared CV of the mean initiation rate inferred using our approach (blue) or obtained from examining the fluorescence of transcription spots in a single snapshot (light plus dark purple). While snapshots captured a significant amount of uncorrelated noise (light purple), our inference accounts mostly for correlated noise (compare blue and dark purple). See Section K in S1 File and S8 Fig for details. (C) Inferred elongation rate as a function of embryo position (red), along with previously reported results (black, [25]; teal, [26]). (D) Distribution of inferred single-cell elongation rates in the anterior 40% of embryo (red), along with best fit to mean and standard deviation using single-molecule simulations with and without RNAP-to-RNAP variability (gold and brown, respectively, see Section M in S1 File for details). (E) Inferred cleavage time as a function of embryo position. (F) CV of the mean initiation rate (blue), elongation rate (red), and cleavage time (green) as a function of embryo position. (A, C, E, shaded error reflects standard error of the mean across 355 nuclei in 7 embryos, or of previously reported mean results; B, F, shaded error or black error bars represent bootstrapped standard errors of the CV or CV2 for 100 bootstrap samples each; C, error bars reflect standard error of the mean for [25] and lower (25%) and upper (75%) quintiles of the full distribution from [26]).
Fig 5
Fig 5. Single-cell correlations between transcription cycle parameters.
Spearman rank correlation coefficients and associated p-values between (A) mean initiation rate and cleavage time, (B) mean initiation rate and elongation rate, (C) elongation rate and cleavage time, and (D) mean RNAP density and cleavage time. Blue points indicate single-cell values; black points and error bars indicate mean and SEM, respectively, binned across x-axis values. Lines and shaded regions indicate generalized linear model fit and 95% confidence interval, respectively, and are shown for ease of visualization (see Methods and materials for details).

Similar articles

Cited by

References

    1. Alberts B. Molecular biology of the cell. Sixth edition. ed. New York, NY: Garland Science, Taylor and Francis Group; 2015.
    1. Spitz F, Furlong EE. Transcription factors: from enhancer binding to developmental control. Nat Rev Genet. 2012;13(9):613–26. 10.1038/nrg3207 - DOI - PubMed
    1. De La Mata M, Alonso CR, Kadener S, Fededa JP, Blaustein M, Pelisch F, et al.. A slow RNA polymerase II affects alternative splicing in vivo. Molecular Cell. 2003;12(2):525–532. 10.1016/j.molcel.2003.08.001 - DOI - PubMed
    1. Tian B, Manley JL. Alternative polyadenylation of mRNA precursors. Nature Reviews Molecular Cell Biology. 2016;18(1):18–30. 10.1038/nrm.2016.116 - DOI - PMC - PubMed
    1. Pinto PAB, Henriques T, Freitas MO, Martins T, Domingues RG, Wyrzykowska PS, et al.. RNA polymerase II kinetics in polo polyadenylation signal selection. EMBO Journal. 2011;30(12):2431–2444. 10.1038/emboj.2011.156 - DOI - PMC - PubMed

Publication types

LinkOut - more resources