

Systematic and Random Mapping Errors in Structure - Function Analysis of the Macula
- PMID: 34003906
- PMCID: PMC7900880
- DOI: 10.1167/tvst.10.2.21
Systematic and Random Mapping Errors in Structure - Function Analysis of the Macula
Abstract
Purpose: Quantify the spatial error in mapping perimetric stimuli for structure-function analysis resulting from the choice of mapping scheme and eye movements.
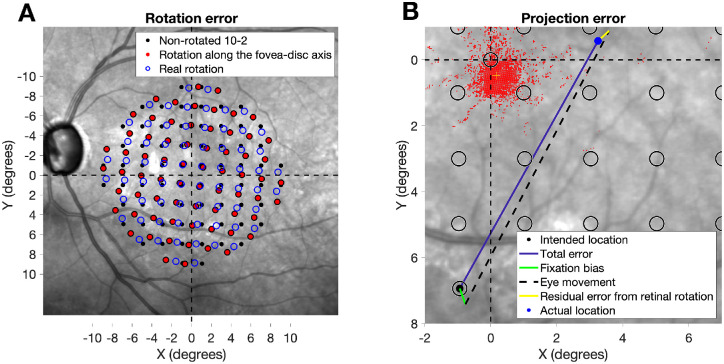
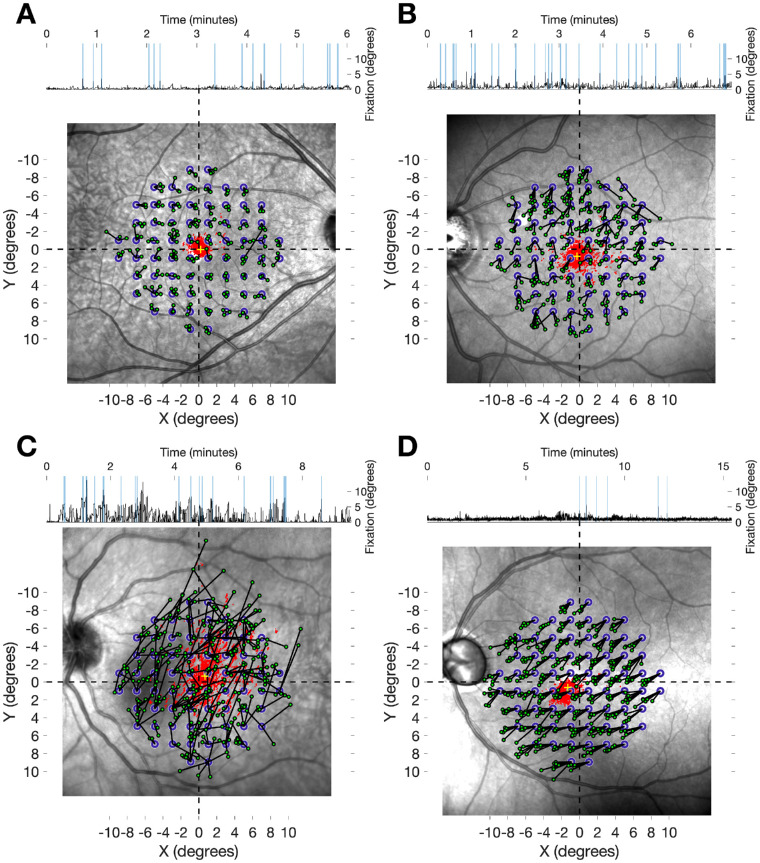
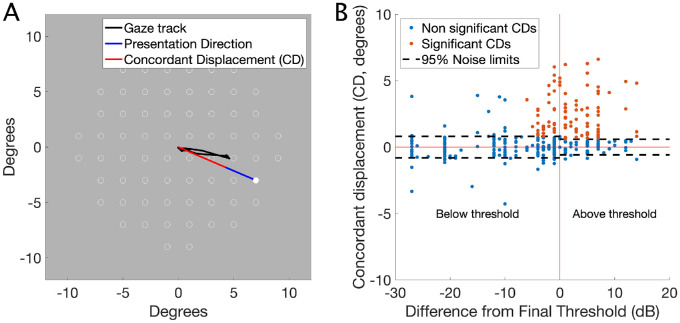
Methods: We analyzed data from 17 healthy and 30 glaucomatous participants. Structural data of the macula were collected with a spectral-domain optical coherence tomography. We extracted eye movement data and projection locations from a fundus tracking perimeter and quantified the retinal location mapping error (distance between the actual and the intended stimulus location in degrees from the fovea) for non-tracked perimetry in a 10-2 grid. First, we evaluated whether rotating the 10-2 grid to match the fovea-disc axis improved mapping accuracy. Second, we analyzed the effect of eccentric fixation, random eye movements, and gaze attraction from seen stimuli on projection accuracy and spread of fixation, measured with the 95% bivariate contour ellipse area (95% BCEA). We used generalized linear mixed models for our statistical analyses.
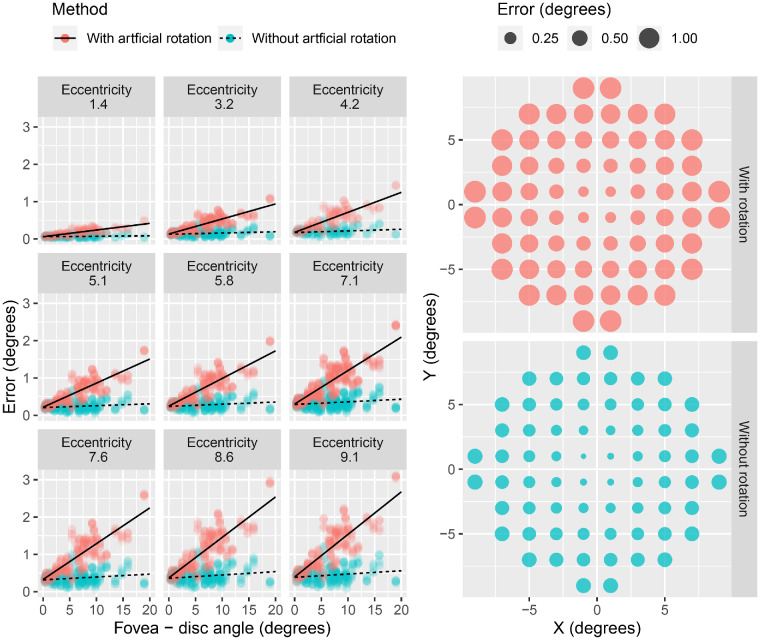
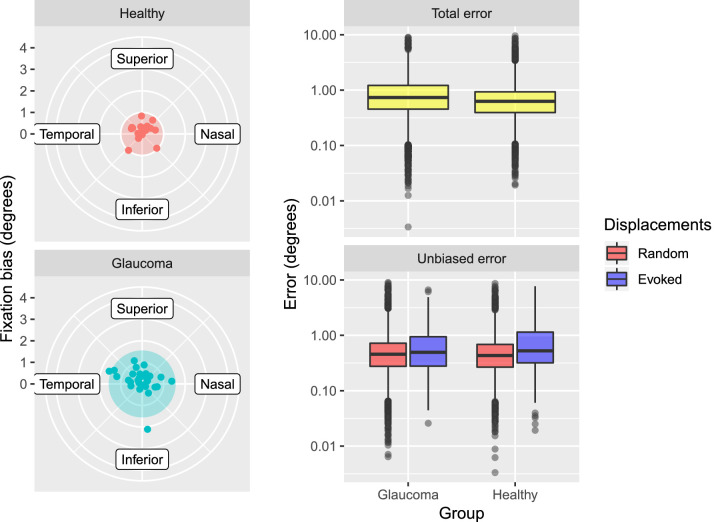
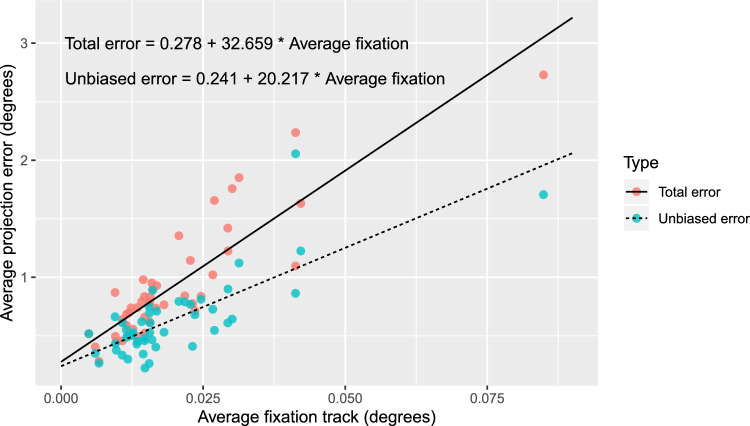
Results: Rotating the 10-2 grid to match the fovea-disc axis significantly increased the mapping error (P < 0.001). Eye movements evoked by seen stimuli significantly increased the projection error during the test (P < 0.001). Removing such eye movements significantly reduced the 95% BCEA (P < 0.001). Eccentric fixation also significantly contributed to the projection error (P < 0.001), and its effect was larger in glaucoma patients (P < 0.001).
Conclusions: Rotating the perimetric grid to match the fovea-disc axis is not recommended. Fixation eccentricity and instability should be taken into account for structure-function analyses.
Translational relevance: Accounting for fixation can improve structure-function mapping in glaucoma.
Conflict of interest statement
Disclosure:
Figures
Similar articles
-
A basis for customising perimetric locations within the macula in glaucoma.Ophthalmic Physiol Opt. 2018 Mar;38(2):164-173. doi: 10.1111/opo.12435. Epub 2018 Jan 8. Ophthalmic Physiol Opt. 2018. PMID: 29315706 Free PMC article.
-
Evidence for alterations in fixational eye movements in glaucoma.BMC Ophthalmol. 2018 Aug 3;18(1):191. doi: 10.1186/s12886-018-0870-7. BMC Ophthalmol. 2018. PMID: 30075758 Free PMC article.
-
Diagnosis of Early-Stage Glaucoma by Grid-Wise Macular Inner Retinal Layer Thickness Measurement and Effect of Compensation of Disc-Fovea Inclination.Invest Ophthalmol Vis Sci. 2015 Aug;56(9):5681-90. doi: 10.1167/iovs.15-17208. Invest Ophthalmol Vis Sci. 2015. PMID: 26313303
-
Development of a test grid using Eye Movement Perimetry for screening glaucomatous visual field defects.Graefes Arch Clin Exp Ophthalmol. 2018 Feb;256(2):371-379. doi: 10.1007/s00417-017-3872-x. Epub 2017 Dec 28. Graefes Arch Clin Exp Ophthalmol. 2018. PMID: 29282563 Free PMC article.
-
Relating optical coherence tomography to visual fields in glaucoma: structure-function mapping, limitations and future applications.Clin Exp Optom. 2019 May;102(3):291-299. doi: 10.1111/cxo.12844. Epub 2018 Nov 29. Clin Exp Optom. 2019. PMID: 30499141 Review.
Cited by
-
Microperimetry Reliability Assessed From Fixation Performance.Transl Vis Sci Technol. 2023 May 1;12(5):21. doi: 10.1167/tvst.12.5.21. Transl Vis Sci Technol. 2023. PMID: 37219509 Free PMC article.
-
Prediction of Retinal Ganglion Cell Counts Considering Various Displacement Methods From OCT-Derived Ganglion Cell-Inner Plexiform Layer Thickness.Transl Vis Sci Technol. 2022 May 2;11(5):13. doi: 10.1167/tvst.11.5.13. Transl Vis Sci Technol. 2022. PMID: 35575777 Free PMC article.
-
A Practical Framework for the Integration of Structural Data Into Perimetric Examinations.Transl Vis Sci Technol. 2024 Jun 3;13(6):19. doi: 10.1167/tvst.13.6.19. Transl Vis Sci Technol. 2024. PMID: 38916881 Free PMC article.
References
-
- Turpin A, McKendrick AM, Johnson CA, Vingrys AJ. Properties of perimetric threshold estimates from full threshold, ZEST, and SITA-like strategies, as determined by computer simulation. Invest Ophthalmol Vis Sci. 2003; 44(11): 4787–4795. - PubMed
MeSH terms
LinkOut - more resources
Full Text Sources
Other Literature Sources
Medical
