. 2021 Sep 4;187(1):336-360.
doi: 10.1093/plphys/kiab222.

Nitric oxide coordinates growth, development, and stress response via histone modification and gene expression

Affiliations

Nitric oxide coordinates growth, development, and stress response via histone modification and gene expression

Alexandra Ageeva-Kieferle et al. Plant Physiol. .

Abstract

Nitric oxide (NO) is a signaling molecule with multiple regulatory functions in plant physiology and stress response. In addition to direct effects on transcriptional machinery, NO executes its signaling function via epigenetic mechanisms. We report that light intensity-dependent changes in NO correspond to changes in global histone acetylation (H3, H3K9, and H3K9/K14) in Arabidopsis (Arabidopsis thaliana) wild-type leaves, and that this relationship depends on S-nitrosoglutathione reductase and histone deacetylase 6 (HDA6). The activity of HDA6 was sensitive to NO, demonstrating that NO participates in regulation of histone acetylation. Chromatin immunoprecipitation sequencing and RNA-seq analyses revealed that NO participates in the metabolic switch from growth and development to stress response. This coordinating function of NO might be particularly important in plant ability to adapt to a changing environment, and is therefore a promising foundation for mitigating the negative effects of climate change on plant productivity.


Figures

Figure 1
Figure 1
Light-dependent NO emissions and nitrite and S-nitrosothiol accumulation in Arabidopsis plants. A–C, NO emission of single Arabidopsis plants. Plants were placed in an Arabidopsis cuvette and NO emission was measured by chemiluminescence using an ultra-high sensitive NO analyzer. Temperature and dark and light conditions were applied as indicated. Light intensity is given as PPFD (μmol photons m−2 s−1). Means ± se of at least three independent experiments (N ≥ 3) are shown. D, Experimental setup for treatments with different light conditions. Four-week-old plants grown on soil under short day cycles (10/14 h light/dark, 20/17°C) were transferred at noon (11:00) for 4 h to dark (D, T 22°C), LL (T 22°C), or HL (T 30°C). E–G, Determination of S-nitrosothiol and nitrite content after exposure to different light conditions. Total S-nitrosothiol (E) and nitrite (F) levels were determined after 4 h. Means + se of three independent experiments (N = 3) are shown. Letters are assigned to bars based on one-way analysis of variance (ANOVA) with Tukey’s post hoc test. Two-way ANOVA results: in (E) difference among light and temperature conditions – P = 0.009, difference between wt and gsnor mutant – P = 0.004. Pairwise comparisons were performed using the Holm-Sidak test: D versus HL – P = 0.020, D versus LL – P = 0.014. In (F) difference among light and temperature conditions – P = 0.011. Pairwise comparisons: D versus HL – P = 0.017, D versus LL – P = 0.029. G, Total S-nitrosothiol levels of wt and gsnor plants were determined at 06:00, 10:00, 11:30, 14:00, 18:00, and 21:00. The light period was from 07:00 to 17:00. Means ± se of at least three independent experiments (N ≥ 3) are shown. Shaded portions in the graph represent dark conditions.
Figure 2
Figure 2
Different light conditions lead to altered H3 acetylation in wt and gsnor plants. A, Immunoblot detection of histone modifications. Four-week-old plants were exposed for 4 h to the indicated light conditions. Histones were extracted and analyzed for the indicated histone marks. B–D, Quantitative analyses of the immunodetected bands of the different histone marks. Signal intensity was determined with Image J software. The mean ± se of at least five independent experiments (N ≥ 5) is shown. Intensities are given relative to the histone acetylation level in wt under D conditions, which was set to 1. Significant deviations from this constant were determined by Holm adjustment after one-way ANOVA (**P ≤ 0.01, *P ≤ 0.05).
Figure 3
Figure 3
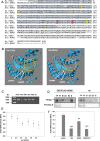
S-Nitrosation of Arabidopsis HDA6. A, Amino acid sequence alignment of human HDA2 and Arabidopsis HDA6. The alignment was performed using Clustal Omega. Cysteine residues that are S-nitrosated in human HDA2 are marked in red, other conserved cysteines are indicated in yellow. HDA region is highlighted in gray. B, Structural modeling of Arabidopsis HDA6. The HDA domain of Arabidopsis HDA6 (amino acids 18–386, Uniprot entry Q9FML2) was modeled using the SwissProt Modeling server with human HDA2 as a template (PDB code: 4LXZ). The 3D models were visualized with Swiss-PdbViewer. Cysteine residues that are S-nitrosylated in human HDA2, as well as the corresponding putative redox-sensitive cysteines of HDA6, are indicated in yellow. The bound HDAC inhibitor suberanilohydroxamic acid (green) in human HDA2 indicates its active center, which is highlighted in each enzyme with an orange circle. Recombinant FLAG-HDA6 was produced in Arabidopsis. C, RT-PCR of transgenic 35S:FLAG-HDA6 Arabidopsis lines. Five 35S:FLAG-HDA6–containing lines, A18-A21, and A23, were identified. cDNA of wt was used as a negative control. Predicted size of FLAG-HDA6 is around 1,470 bp. D, Immunoblot of plant-produced FLAG-HDA6. Total protein (TP) of the transgenic line A18 and wt was subjected to FLAG resin and recombinant protein was eluted three times (E1–E3). TP, flow-through (FT), E1-E3, and boiled beads (B) were analyzed by immunoblotting. Anti-FLAG-tag antibody (1:1,000) was used for immunodetection. Predicted size of FLAG-HDA6 is 57 kDa. One representative experiment of at least three replicates is shown. E, Inhibition of FLAG-HDA6 activity by GSNO. The recombinant plant FLAG-HDA6 was incubated with 0.1–1,000 μM GSNO for 20 min and its activity was determined. Mean ± se of three independent experiments (N = 3) is shown (F) Activity of FLAG-HDA6 after treatment with 1 μM TSA, 1 mM GSNO and 1 mM GSNO/5 mM DTT. HDA activity was measured using Fluorogenic HDA Activity Assay. Mean ± se of at least three independent experiments (N ≥ 3) is shown. One-way ANOVA (DF = 3; P < 0,001) was performed with Holm-Sidak post hoc test for each treatment group versus the control group (FLAG-HDA6 activity), **P ≤ 0.01, ***P ≤ 0.001.
Figure 4
Figure 4
Different light conditions lead to altered H3 acetylation in wt and hda6 plants. A, Immunoblot detection of histone modifications. Four-week-old plants were exposed for 4 h to the indicated light conditions. Histones were extracted and analyzed for the indicated histone marks. B–D, Quantitative analysis of the immunodetected bands of the different histone marks. Signal intensity was determined with Image J software. Mean ± se of at least three independent experiments (N ≥ 3) is shown. Intensities are given relative to the histone acetylation level in wt under D conditions, which was set to 1. Significant deviations from this constant were determined by Holm adjustment after one-way ANOVA (*P ≤ 0.05).
Figure 5
Figure 5
Characteristics of ChIP-seq samples. A, PCA. The projection onto the top two principal components (30% and 27% of variance, respectively) shows a clustering of biological replicates. Two independent ChIP-seq experiments were performed (N = 2). B, Chromosomal location of H3K9ac peaks averaged for each line. The number of peaks in each 500 kb chromosomal bin of the Arabidopsis genome is shown. The centromeric and pericentromeric regions of each chromosome are characterized by a very low number of peaks. Black: wt, blue: gsnor, red: hda6. C, total number of identified peaks for wt, gsnor, and hda6. Boxes show 25% and 75% quantiles, the white line represents the median, and the whiskers indicate the extreme values. Lower-case letters mark groups that are statistically different (Kruskal Wallis test with post hoc Dunn test, P < 0.05). D, Location of H3K9ac peaks relative to genes. Histogram of distances of peak summits to the closest annotated TSS. The distribution shows a maximum at 200–300-bp downstream of the TSS. E, Distribution of H3K9ac peaks according to the genomic region of the summit (relative to the closest TSS). UTR, untranslated region.
Figure 6
Figure 6
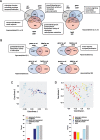
Differential acetylation in mutants. A, B, Overlap of differentially acetylated peaks. Venn diagrams of significantly changed peaks (adjusted P-value < 0.05) in LL versus D (A) and mutants versus wt (B) comparisons. Boxes show major themes among significantly enriched GO terms (adjusted P-value < 0.05) for the respective partition. C and D, MDS analysis of significantly enriched GO terms (adjusted P-value < 0.05) among the genes with TSS closest to significantly upregulated or downregulated acetylation peaks (adjusted P-value < 0.05) that changed for both mutants versus wt under LL conditions. Only GO terms from the biological process ontology are shown in the plots. Each circle corresponds to an enriched GO term and circle size is proportional to the number of differentially acetylated genes (C: upregulated, D: downregulated) assigned to the GO term. The enriched GO terms are arranged in two dimensions such that their distance reflects approximately how distinct the corresponding sets of differential genes are from each other, that is, neighboring circles share a large fraction of genes. Each enriched GO term is colored by its membership in the top-level categories, which are grouped into five themes. If a GO term belongs to multiple top-level terms, a pie chart within the circle indicates the relative fraction of each theme. The total distribution of themes across all enriched GO terms is depicted in the bar plot underneath.
Figure 7
Figure 7
Differential gene regulation in mutants. A and B, Overlap of differentially expressed genes. Venn diagrams of significantly changed genes (adjusted P-value < 0.05) in LL versus D (A) and mutants versus wt (B) comparisons. C and D, MDS analysis of significantly enriched GO terms (adjusted P-value < 0.05) among the significantly upregulated or downregulated genes (adjusted P-value < 0.05) changed for both mutants versus wt under LL conditions. Only GO terms from the biological process ontology are shown in the plots. Each circle corresponds to an enriched GO term and circle size is proportional to the number of differentially regulated genes assigned (C: upregulated, D: downregulated) to the GO term. See Figure 6 for further details about the plots.
Figure 8
Figure 8
Gene level integration of ChIP-seq and RNA-seq datasets for both mutants under LL conditions. Comparative visualization of H3K9ac and gene expression. ChIP-seq (solid lines) and RNA-seq (dashed lines) results of selected genes involved in growth/development (AT4G34200: D-3-phosphoglycerate dehydrogenase, AT1G78060: Glycosyl hydrolase family protein) and stress response (AT3G14430: GRIP/coiled-coil protein, AT1G53165: Protein kinase superfamily protein, AT5G04930: Aminophospholipid ATPase 1, AT5G56550: oxidative stress 3) are shown. Wt: black, gsnor: blue, hda6: red.
Figure 9
Figure 9
Schematic illustration of the regulatory function of NO on histone acetylation in light and dark conditions. Light-induced production of NO/GSNO results in enhanced inhibition of HDA6, and increases histone acetylation gene transcription (left side). In dark conditions, HDA6 activity is enhanced because of less NO/GSNO production. As a consequence, histone acetylation and gene transcription are decreased. In both situations, GSNOR activity is required for fine-tuning the SNO levels.
Figure 10
Figure 10
Under stress conditions GSNOR and HDA6 differentially modulate H3K9ac of genes involved in growth/development and stress response. The model illustrates that GSNOR and HDA6 act in similar pathways responsible for regulating an identical set of growth/development-related genes as well as stress-related genes. Although GSNOR and HDA6 function is required for deacetylation and repression of genes involved in growth/development, both enzymes are also involved in acetylation and enhanced expression of stress-responsive genes, suggesting that GSNOR and HDA6 function as molecular switches between both physiological processes.

References

    1. Ageeva-Kieferle A, Rudolf EE, Lindermayr C (2019) Redox-dependent chromatin remodeling: a new function of nitric oxide as architect of chromatin structure in plants. Front Plant Sci 10: 625. - PMC - PubMed
    1. An L, Liu Y, Zhang M, Chen T, Wang X (2005) Effects of nitric oxide on growth of maize seedling leaves in the presence or absence of ultraviolet-B radiation. J Plant Physiol 162: 317–326 - PubMed
    1. Apelt F, Breuer D, Olas JJ, Annunziata MG, Flis A, Nikoloski Z, Kragler F, Stitt M (2017) Circadian, carbon, and light control of expansion growth and leaf movement. Plant Physiol 174: 1949–1968 - PMC - PubMed
    1. Avonce N, Leyman B, Mascorro-Gallardo JO, Van Dijck P, Thevelein JM, Iturriaga G (2004) The Arabidopsis trehalose-6-P synthase AtTPS1 gene is a regulator of glucose, abscisic acid, and stress signaling. Plant Physiol 136: 3649–3659 - PMC - PubMed
    1. Ayyappan V, Sripathi VR, Kalavacharla VK, Saha MC, Thimmapuram J, Bhide KP, Fiedler E (2019) Genome-wide identification of histone methylation (H3K9me2) and acetylation (H4K12ac) marks in two ecotypes of switchgrass (Panicum virgatum L.). BMC Genomics 20: 667. - PMC - PubMed

Publication types

LinkOut - more resources