. 2021 Aug 31;33(8):2701-2715.
doi: 10.1093/plcell/koab139.

EAR domain-containing transcription factors trigger PRC2-mediated chromatin marking in Arabidopsis

Affiliations

EAR domain-containing transcription factors trigger PRC2-mediated chromatin marking in Arabidopsis

Fernando Baile et al. Plant Cell. .

Erratum in

  • Erratum.
    [No authors listed] [No authors listed] Plant Cell. 2022 Jan 20;34(1):700. doi: 10.1093/plcell/koab233. Plant Cell. 2022. PMID: 34689204 Free PMC article. No abstract available.

Abstract

Polycomb group (PcG) complexes ensure that every cell in an organism expresses the genes needed at a particular stage, time, or condition. However, it is still not fully understood how PcG complexes PcG-repressive complex 1 (PRC1) and PRC2 are recruited to target genes in plants. Recent findings in Arabidopsis thaliana support the notion that PRC2 recruitment is mediated by different transcription factors (TFs). However, it is unclear how all these TFs interact with PRC2 and whether they also recruit PRC1 activity. Here, by using a system to bind selected TFs to a synthetic promoter lacking the complexity of PcG target promoters in vivo, we show that while binding of the TF VIVIPAROUS1/ABSCISIC ACID-INSENSITIVE3-LIKE1 recapitulates PRC1 and PRC2 marking, the binding of other TFs only renders PRC2 marking. Interestingly, all these TFs contain an Ethylene-responsive element binding factor-associated Amphiphilic Repression (EAR) domain that triggers both HISTONE DEACETYLASE COMPLEX and PRC2 activities, connecting two different repressive mechanisms. Furthermore, we show that different TFs can have an additive effect on PRC2 activity, which may be required to maintain long-term repression of gene expression.


Figures

Figure 1
Figure 1
LexA BD fusion proteins bind to the synthetic promoter in vivo. A, Bar chart showing the RY element (indicated in orange) as the most significantly enriched cis-regulatory motif found at the 500 bp region upstream of the ATG of genes marked with H2AK121ub/H3K27me3 in WT that become upregulated in the bmi1 abc mutant (n = 1030 genes; see Supplemental Data Set S1). Analysis was carried out using TAIR Motif finder tool (https://www.arabidopsis.org/tools/bulk/motiffinder/index.jsp). Other significantly enriched 6-mer motifs are also shown. B, Schematic representation of the synthetic GUS reporter locus. The LexO element recognized by the LexA BD and the catalase intron are indicated. Numbered arrows indicate the positions of the primer pairs used to examine the binding of the fusion proteins to the synthetic locus. C, D, Bar charts showing BD, DB-VAL1, BD-BMI1A, and BD-RING1B enrichment at the GUS reporter locus determined by ChIP using anti-LexA BD antibody. WT/pLexO:GUS_1 plants (-) were used as a negative control. Results are indicated as percentage of input. Error bars represent standard deviation of n = 2–3 independent pools of tissue. Significant differences at position 2 compared to control plants determined by two-sided Student’s t test are indicated (***P < 0.001)
Figure 2
Figure 2
VAL1 directs PRC1, PRC2, and HDAC activities to target genes. A–C, H2AK121ub, H3K27me3, and H3ac levels at the GUS reporter locus in WT/pLexO:GUS_1/BD, WT/pLexO:GUS_1/BD-VAL1, WT/pLexO:GUS_1/BD-BMI1A, and WT/pLexO:GUS_1/BD-RING1B plants. Numbers at the x-axis indicate the positions of amplified regions as indicated in Figure 1B. Results are indicated as percentage of input. Error bars indicate standard deviation of n = 2 biological replicates. Significant differences at position 4 compared to WT/pLexO:GUS_1/BD are indicated as determined by two-sided Student’s t test (**P < 0.01; *P < 0.05; “ns” not significant). D, Box plot showing GUS activity levels in WT/pLexO:GUS_1, WT/pLexO:GUS_1/BD, WT/pLexO:GUS_1/BD-VAL1, WT/pLexO:GUS_1/BD-BMI1A, and WT/pLexO:GUS_1/BD-RING1B seedlings at 7 DAG. RFU indicates relative fluorescence units. Activity was tested in independent seedlings (N ≥ 13, combined from two independent experiments). In each case, the median (segment inside rectangle), the mean (cross inside the rectangle), upper and lower quartiles (boxes), and minimum and maximum values (whiskers) are indicated. P-value of differences between WT/pLexO:GUS_1/BD and the other plants determined by two-sided Student’s t-test are indicated. “ns” indicates not significant. E, F, Schematic representation of the experiment shown in F, in which the levels of H2AK121ub and H3K27me3 at the reporter locus were compared between WT/pLexO:GUS_1/BD-VAL1 and bmi1abc/pLexO:GUS_1/BD-VAL1 plants. Results are indicated as percentage of input. Error bars indicate standard deviation of n = 2 biological replicates. Significant difference at position 4 is indicated as determined by two-sided Student’s t test (***P < 0.001; *P < 0.05)
Figure 3
Figure 3
Synthetic tethering of BD-KNU, BD-FLC, or BD-ERF10 triggers PRC2 and HDAC activities but not PRC1 activity. A, Box plots showing GUS activity levels in WT/pLexO:GUS_1, WT/pLexO:GUS_1/BD, WT/pLexO:GUS_1/BD-KNU, WT/pLexO:GUS_1/BD-FLC, and WT/pLexO:GUS_1/BD-ERF10 seedlings at 7 DAG indicated as RFU. Activity was tested in independent seedlings (N ≥ 18, combined from two independent experiments). In each case, the median (segment inside rectangle), the mean (cross inside the rectangle), upper and lower quartiles (boxes), and minimum and maximum values (whiskers) are indicated. P-value of differences between WT/pLexO:GUS_1/BD and the other plants determined by two-sided Student’s t-test are indicated. B–D, H3K27me3, H3ac, and H2AK121ub levels at the GUS reporter locus in different plants. Results are indicated as percentage of input. Numbers at the x-axis indicate the positions of amplified regions as indicated in Figure 1B. Error bars indicate standard deviation of n = 2 independent pools of tissue. Significant differences compared to WT/pLexO:GUS_1/BD determined by two-sided Student’s t test are indicated (*P < 0.05; “ns” not significant). One replicate of WT/pLexO:GUS_1/BD-VAL1 was included as an additional control (orange dotted line). E, Schematic representation of the p(G + 2T)LexO:GUS construct in which one GAGA and two TELOBOX motifs were inserted upstream of the LexO. F, H3K27me3 levels at the GUS reporter locus in WT/pLexO:GUS_1 and WT/p(G + 2T)LexO:GUS_1 plants (left), and WT/pLexO:GUS_1 and WT/p(G + 2T)LexO:GUS_1/BD-VAL1 (right). Results are indicated as percentage of input. Error bars indicate standard deviation of n = 2 independent pools of tissue. Significant differences at position 4 determined by two-sided Student’s t test are indicated (*P < 0.05). G, Box plot showing GUS activity levels in WT/pLexO:GUS_1, WT/p(G + 2T)LexO:GUS_1 and WT/p(G + 2T)LexO:GUS_1/BD-VAL1 plants. Activity was tested in N = 14 independent seedlings at 7 DAG. P-value of differences determined by two-sided Student’s t test are indicated
Figure 4
Figure 4
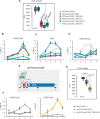
The EAR domain connects PRC2 marking and H3 deacetylation. A, Schematic representation of the domains present at TFs related to PRC2 recruitment. The TFs analyzed in this work are indicated. B, C, Comparison of H3K27me3 and H3ac levels at the GUS reporter locus in WT/pLexO:GUS_1/BD-KNU and WT/pLexO:GUS_1/BD-KNU(-EAR) plants. Numbers at the x-axis indicate the positions of amplified regions as indicated in Figure 1B. Results are indicated as percentage of input. Error bars indicate standard deviation of n = 2 independent pools of tissue. Significant differences at position 4 determined by two-sided Student’s t test are indicated (*P < 0.05). D, Box plot showing GUS activity levels in WT/pLexO:GUS_1/BD, WT/pLexO:GUS_1/BD-KNU, and WT/pLexO:GUS_1/BD-KNU(-EAR) seedlings at 7 DAG indicated as RFU. Activity was tested in independent seedlings (N ≥ 12, combined from two independent experiments). The median (segment inside rectangle), the mean (cross inside the rectangle), upper and lower quartiles (boxes), and minimum and maximum values (whiskers) are indicated. P-value of differences determined by two-sided Student’s t test are indicated. “ns” indicates not significant. E, F, H3K27me3 and H3ac levels at the GUS reporter locus in WT/pLexO:GUS_1/BD and WT/pLexO:GUS_1/BD-EAR plants. Results are indicated as percentage of input. Error bars indicate standard deviation of n = 2 independent pools of tissue. Significant differences between WT/pLexO:GUS_1/BD and WT/pLexO:GUS_1/BD-EAR determined by two-sided Student’s t test are indicated (*P < 0.05). G, Box plot showing GUS activity levels in the same plants indicated as RFU. Activity was tested in independent seedlings (N ≥ 15, combined from two independent experiments). P-value of difference between WT/pLexO:GUS_1/BD and WT/pLexO:GUS_1/BD-EAR plants determined by two-sided Student’s t test are indicated. H, H2AK121ub levels at the reporter locus in the different plants. Results are indicated as percentage of input. Error bars indicate standard deviation of n = 2 independent pools of tissue. No significant differences (“ns”) were detected according to two-sided Student’s t test
Figure 5
Figure 5
EMF1 recruitment results in the incorporation of H3K27me3 and the removal of H3K4me3 and H3ac. A, H3K27me3 and H2AK121ub levels at the GUS reporter locus in WT/pLexO:GUS_1/BD and WT/pLexO:GUS_1/BD-EMF1 plants. Numbers at the x-axis indicate the positions of amplified regions as indicated in Figure 1B. Results are indicated as percentage of input. Error bars indicate standard deviation of n = 2–3 biological replicates. Significant differences at position 4 compared to WT/pLexO:GUS_1/BD are indicated as determined by two-sided Student’s t test (*P < 0.05; “ns” indicates not significant). B, H3K4me3 and H3ac levels at the GUS reporter locus in the different plants. Results are indicated as percentage of input. Error bars indicate standard deviation of n = 2 independent pools of tissue. Significant differences at position 4 are indicated as determined by two-sided Student’s t test (*P < 0.05). C, Box plots showing GUS activity levels in WT/pLexO:GUS_1/BD and WT/pLexO:GUS_1/BD-EMF1 seedlings at 7 DAG. RFU indicates relative fluorescence units. Activity was tested in independent seedlings (N ≥ 20, combined from two independent experiments). In each case, the median (segment inside rectangle), the mean (cross inside the rectangle), upper and lower quartiles (boxes), and minimum and maximum values (whiskers) are indicated. P-value of differences between WT/pLexO:GUS_1/BD and WT/pLexO:GUS_1/BD-EMF1 plants determined by two-sided Student’s t test are indicated. D, Drawing summarizing the histone modifying complexes recruited by VAL1 or by other EAR-containing TFs to promote transcriptional repression
None

Comment in

References

    1. Beh LY, Colwell LJ, Francis NJ (2012) A core subunit of Polycomb repressive complex 1 is broadly conserved in function but not primary sequence. Proc Natl Acad Sci U S A 109: E1063–E1071 - PMC - PubMed
    1. Bloomer RH, Hutchison CE, Bäurle I, Walker J, Fang X, Perera P, Velanis CN, Gümüs S, Spanos C, Rappsilber J, et al. (2020) The Arabidopsis epigenetic regulator ICU11 as an accessory protein of Polycomb Repressive Complex 2. Proc Natl Acad Sci U S A 117: 16660–16666 - PMC - PubMed
    1. Bratzel F, López-Torrejón G, Koch M, Del Pozo JC, Calonje M (2010) Keeping cell identity in Arabidopsis requires PRC1 RING-finger homologs that catalyze H2A monoubiquitination. Curr Biol 20: 1853–1859 - PubMed
    1. Calonje M (2014) PRC1 marks the difference in plant PcG repression. Mol Plant 7: 459–471 - PubMed
    1. Calonje M, Sanchez R, Chen L, Sung ZR (2008) EMBRYONIC FLOWER1 participates in polycomb group-mediated AG gene silencing in Arabidopsis. Plant Cell 20: 277–291 - PMC - PubMed

Publication types

MeSH terms