

Quantitative interactions: the disease outcome of Botrytis cinerea across the plant kingdom
- PMID: 34003931
- PMCID: PMC8496218
- DOI: 10.1093/g3journal/jkab175
Quantitative interactions: the disease outcome of Botrytis cinerea across the plant kingdom
Abstract
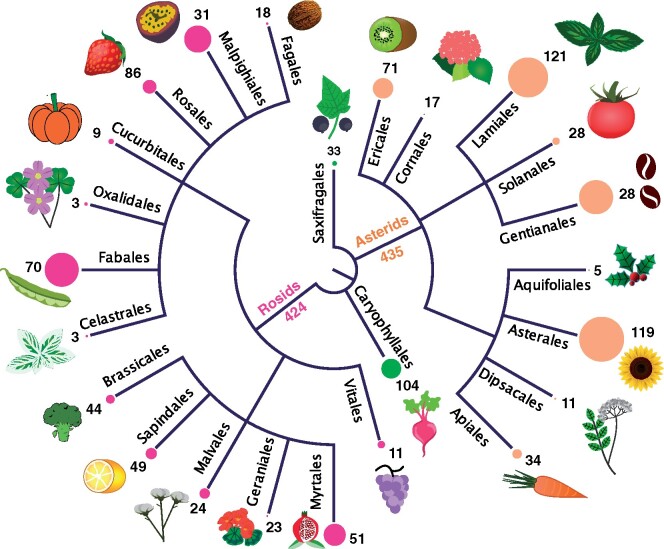
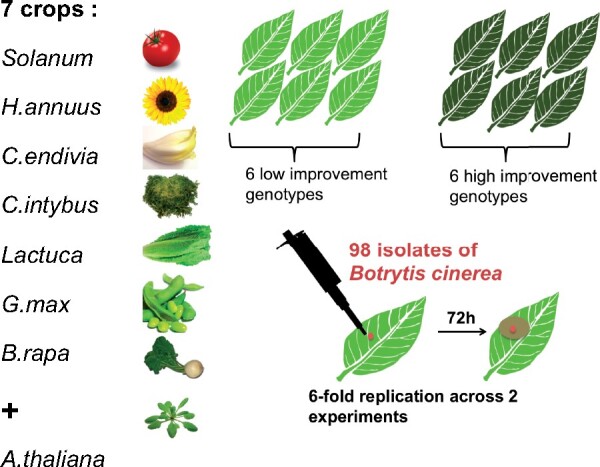
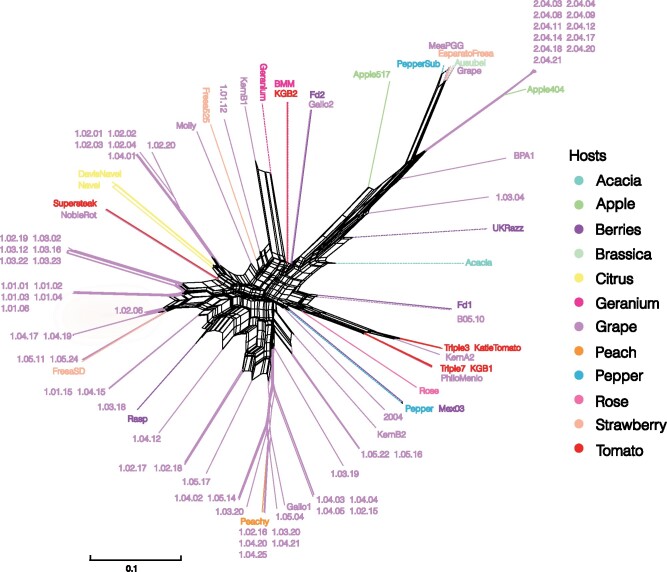
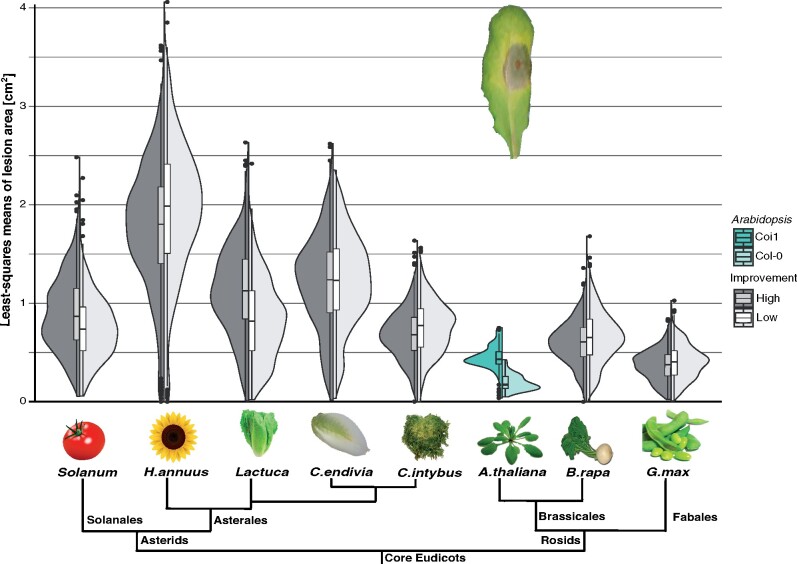
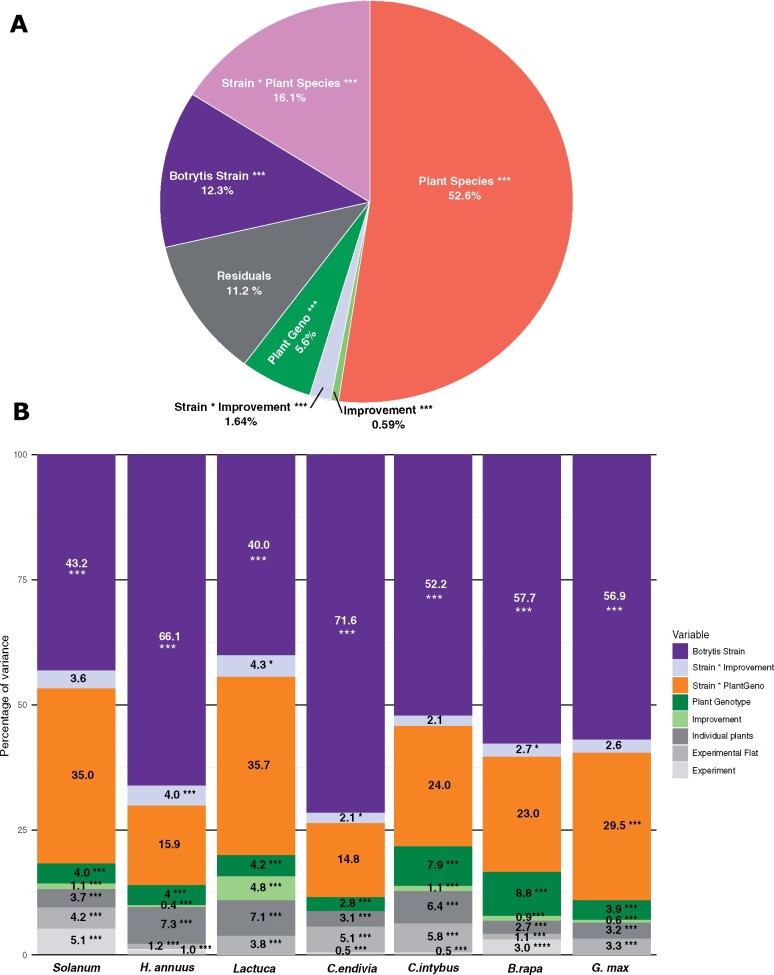
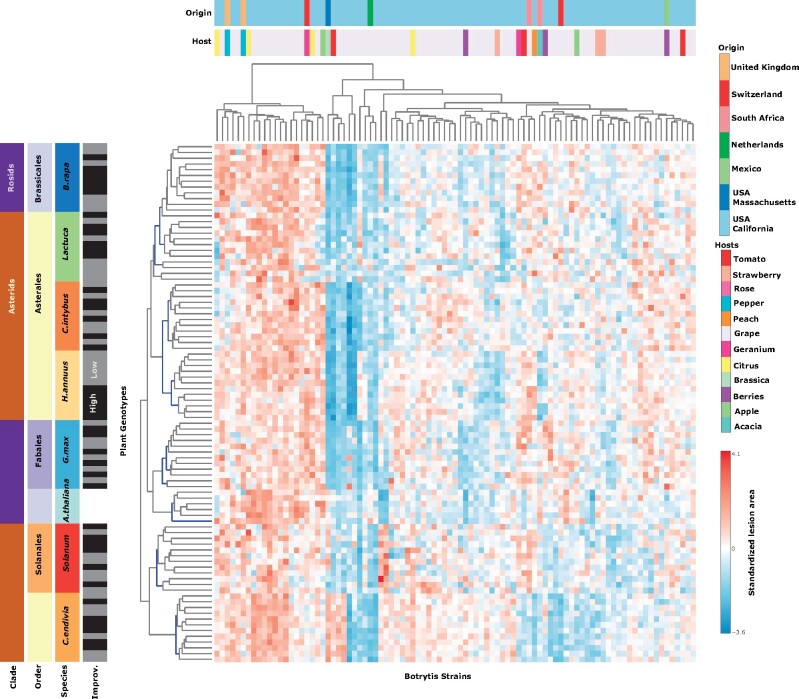
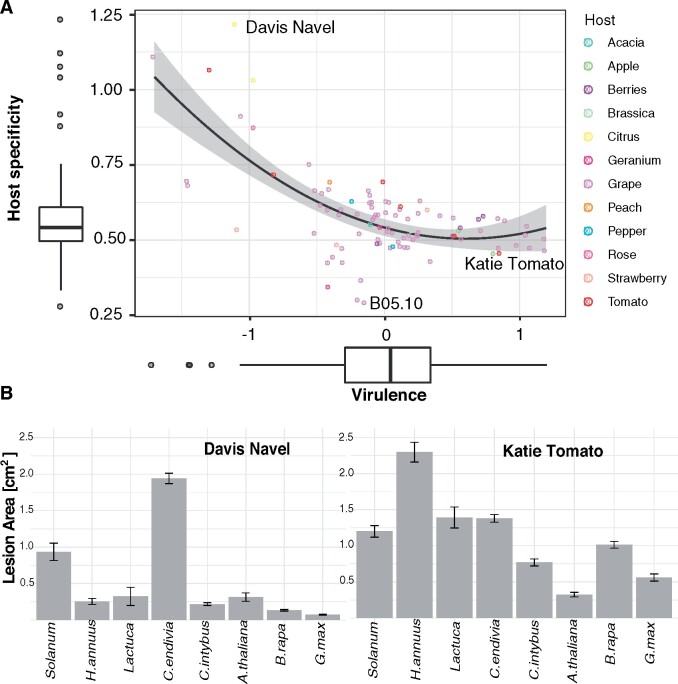
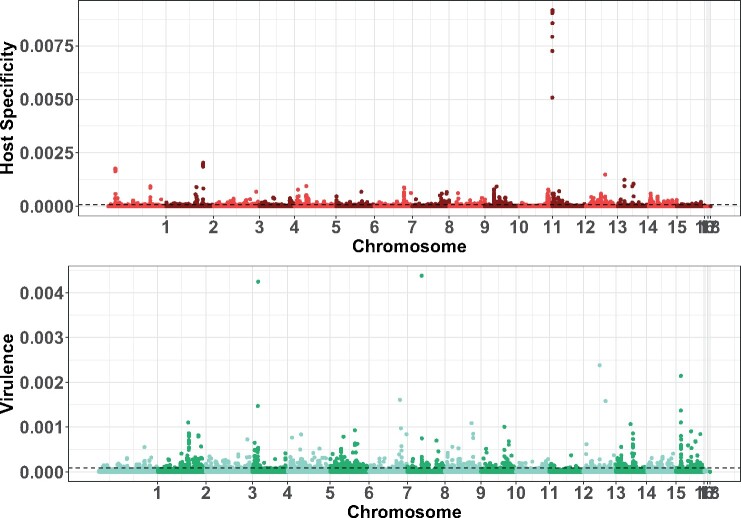
Botrytis cinerea is a fungal pathogen that causes necrotic disease on more than a thousand known hosts widely spread across the plant kingdom. How B. cinerea interacts with such extensive host diversity remains largely unknown. To address this question, we generated an infectivity matrix of 98 strains of B. cinerea on 90 genotypes representing eight host plants. This experimental infectivity matrix revealed that the disease outcome is largely explained by variations in either the host resistance or pathogen virulence. However, the specific interactions between host and pathogen account for 16% of the disease outcome. Furthermore, the disease outcomes cluster among genotypes of a species but are independent of the relatedness between hosts. When analyzing the host specificity and virulence of B. cinerea, generalist strains are predominant. In this fungal necrotroph, specialization may happen by a loss in virulence on most hosts rather than an increase of virulence on a specific host. To uncover the genetic architecture of Botrytis host specificity and virulence, a genome-wide association study (GWAS) was performed and revealed up to 1492 genes of interest. The genetic architecture of these traits is widespread across the B. cinerea genome. The complexity of the disease outcome might be explained by hundreds of functionally diverse genes putatively involved in adjusting the infection to diverse hosts.
Keywords: Botrytis cinerea; fungus; generalist pathogen; host specificity; plant domestication; plant–pathogen interactions; polygenic virulence.
© The Author(s) 2021. Published by Oxford University Press on behalf of Genetics Society of America.
Conflict of interest statement
None declared.
Figures
Similar articles
-
Genetic and molecular landscapes of the generalist phytopathogen Botrytis cinerea.Mol Plant Pathol. 2024 Jan;25(1):e13404. doi: 10.1111/mpp.13404. Epub 2023 Dec 1. Mol Plant Pathol. 2024. PMID: 38037862 Free PMC article. Review.
-
Polygenic strategies for host-specific and general virulence of Botrytis cinerea across diverse eudicot hosts.Genetics. 2025 Jul 9;230(3):iyaf079. doi: 10.1093/genetics/iyaf079. Genetics. 2025. PMID: 40488422 Free PMC article.
-
A novel Botrytis cinerea-specific gene BcHBF1 enhances virulence of the grey mould fungus via promoting host penetration and invasive hyphal development.Mol Plant Pathol. 2019 May;20(5):731-747. doi: 10.1111/mpp.12788. Mol Plant Pathol. 2019. PMID: 31008573 Free PMC article.
-
Defects in the Ferroxidase That Participates in the Reductive Iron Assimilation System Results in Hypervirulence in Botrytis Cinerea.mBio. 2020 Aug 4;11(4):e01379-20. doi: 10.1128/mBio.01379-20. mBio. 2020. PMID: 32753496 Free PMC article.
-
Recent Advances in the Study of the Plant Pathogenic Fungus Botrytis cinerea and its Interaction with the Environment.Curr Protein Pept Sci. 2017;18(10):976-989. doi: 10.2174/1389203717666160809160915. Curr Protein Pept Sci. 2017. PMID: 27526927 Review.
Cited by
-
Genetic and molecular landscapes of the generalist phytopathogen Botrytis cinerea.Mol Plant Pathol. 2024 Jan;25(1):e13404. doi: 10.1111/mpp.13404. Epub 2023 Dec 1. Mol Plant Pathol. 2024. PMID: 38037862 Free PMC article. Review.
-
Quantification of Botrytis cinerea Growth in Arabidopsis thaliana.Bio Protoc. 2023 Aug 20;13(16):e4740. doi: 10.21769/BioProtoc.4740. eCollection 2023 Aug 20. Bio Protoc. 2023. PMID: 37638304 Free PMC article.
-
Polygenic pathogen networks influence transcriptional plasticity in the Arabidopsis-Botrytis pathosystem.Genetics. 2023 Jul 6;224(3):iyad099. doi: 10.1093/genetics/iyad099. Genetics. 2023. PMID: 37216906 Free PMC article.
-
A Simulation Study to Reveal the Epidemiology and Aerosol Transmission Characteristics of Botrytis cinerea in Grape Greenhouses.Pathogens. 2024 Jun 13;13(6):505. doi: 10.3390/pathogens13060505. Pathogens. 2024. PMID: 38921802 Free PMC article.
-
Challenges and Opportunities Arising from Host-Botrytis cinerea Interactions to Outline Novel and Sustainable Control Strategies: The Key Role of RNA Interference.Int J Mol Sci. 2024 Jun 20;25(12):6798. doi: 10.3390/ijms25126798. Int J Mol Sci. 2024. PMID: 38928507 Free PMC article. Review.
References
-
- Atwell S, Corwin JA, Soltis N, Zhang W, Copeland D, et al. 2018. Resequencing and association mapping of the generalist pathogen Botrytis cinerea. bioRxiv. 489799.
-
- Barrett LG, Kniskern JM, Bodenhausen N, Zhang W, Bergelson J. 2009. Continua of specificity and virulence in plant host-pathogen interactions: causes and consequences. New Phytol. 183:513–529. - PubMed
-
- Berens ML, Berry HM, Mine A, Argueso CT, Tsuda K. 2017. Evolution of hormone signaling networks in plant defense. Annu Rev Phytopathol. 55:401–425. - PubMed
Publication types
MeSH terms
Supplementary concepts
LinkOut - more resources
Full Text Sources
Other Literature Sources