

Predictive Association of Pre-Operative Defect Areas in the Outer Retinal Layers With Visual Acuity in Macular Hole Surgery
- PMID: 34003987
- PMCID: PMC8054630
- DOI: 10.1167/tvst.10.4.7
Predictive Association of Pre-Operative Defect Areas in the Outer Retinal Layers With Visual Acuity in Macular Hole Surgery
Abstract
Purpose: The purpose of this study was to develop methods to model the external limiting membrane (ELM) and ellipsoid zone (EZ) within the elevated cuff surrounding a macular hole (MH) to determine if the predicted size of the defect in these layers after virtual flattening was associated with the actual postoperative defect and best-corrected visual acuity (BCVA).
Methods: Patients were included who had undergone successful MH surgery. The defects in the ELM and EZ after virtual flattening were modeled using in-house software. Main outcomes were postoperative defects in ELM and EZ at 2 months and BCVA at 12 months.
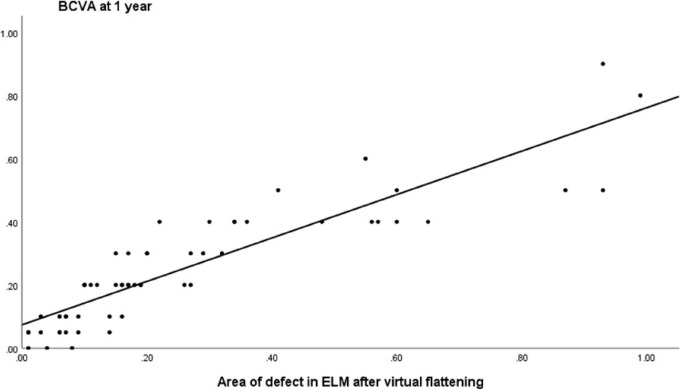
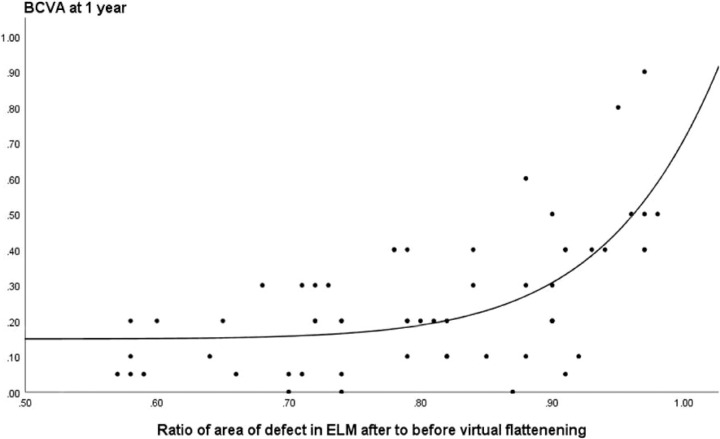
Results: Fifty-eight patients were included. BCVA improved from 0.87 (0.31) logMAR pre-operatively to 0.26 (0.21) at 12 months (P < 0.001). For both the ELM and EZ, the predicted virtually flattened pre-operative defects were associated with the actual postoperative defects at 2 months (R2 = 0.33, P < 0.01 and R2 = 0.50, P < 0.01, respectively). There was a significant association of BCVA at 12 months (adjusted R2 = 0.85) with the pre-operative modeled area of the defect in the ELM (P < 0.01) and to a lesser extent with the defect in the EZ (P < 0.01) and base of the MH (P < 0.01).
Conclusions: Virtually flattening of the pre-operative defect in the ELM provides important predictive information of visual acuity. Incorporation of tools into commercially available optical coherence tomography (OCT) devices to facilitate such measurements would provide the clinician with important prognostic information.
Translational relevance: We have developed methodology that can potentially be used to predict the postoperative state of the outer retinal layers and the associated visual outcome in patients undergoing surgery for MH.
Conflict of interest statement
Disclosure:
Figures
References
-
- Kelly NE, Wendel RT. Vitreous surgery for idiopathic macular holes. Results of a pilot study. Arch Ophthalmol. 1991; 109(5): 654–659. - PubMed
-
- Lois N, Burr J, Norrie J, et al. .. Full-thickness Macular Hole and Internal Limiting Membrane Peeling Study (FILMS) Group. Invest Ophthalmol Vis Sci. 2011; 1;52(3): 1586–1592. - PubMed
-
- Freeman WR, Azen SP, Kim JW, el-Haig W, Mishell DR 3rd, Bailey I. Vitrectomy for the treatment of full- thickness stage 3 or 4 macular holes. The Vitrectomy for Macular Hole Study Group. Results of a 21 multicentered randomized clinical trial. Arch Ophthalmol. 1997; 115: 11–21. - PubMed
-
- Ch'ng SW, Patton N, Ahmed M, et al. .. The Manchester Large Macular Hole Study: is it time to reclassify large macular holes? Am J Ophthalmol. 2018; 195: 36–42. - PubMed
-
- Michalewska Z, Michalewski J, Adelman RA, Nawrocki J.. Inverted internal limiting membrane flap technique for large macular holes. Ophthalmology. 2010; 117(10): 2018–2025. - PubMed
MeSH terms
LinkOut - more resources
Full Text Sources
Other Literature Sources
