

High-Pass Visual Acuity Loss and Macular Structure-Function Relationship in Patients With Primary Open-Angle Glaucoma
- PMID: 34004003
- PMCID: PMC8083119
- DOI: 10.1167/tvst.10.4.26
High-Pass Visual Acuity Loss and Macular Structure-Function Relationship in Patients With Primary Open-Angle Glaucoma
Abstract
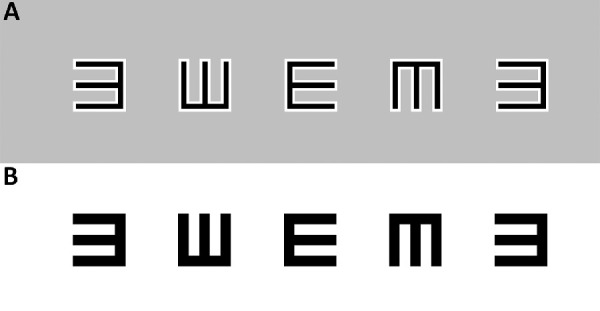
Purpose: The Logarithm of the Minimum Angle of Resolution (logMAR) chart is the most common clinical test for assessing central visual function in glaucoma. However, based on the use of these charts, visual acuity (VA) often remains normal even when severe macular damage exists. Here, we aim to investigate the potential advantages of high-pass VA in detecting glaucoma compared with conventional VA.
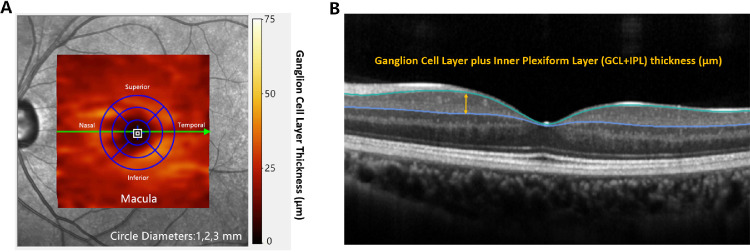
Methods: Monocular best-corrected VA measurements were compared for a novel high-pass electronic VA chart (e-chart) and a conventional e-chart in 113 primary open-angle glaucoma (POAG) patients with normal logMAR VA and 65 age-similar healthy controls. One hundred thirty-nine POAG patients underwent spectral-domain optical coherence tomography (SD-OCT) for measurement of macular ganglion cell layer plus inner plexiform layer (GCL+IPL) thickness. Structure-function relationships between OCT measurements and the two VAs were compared. The enrolled eyes were divided into two groups for further analyses according to macular visual field (MVF) defects, specifically two or more adjacent abnormal points within the 12 central sites of 30-2 VF.
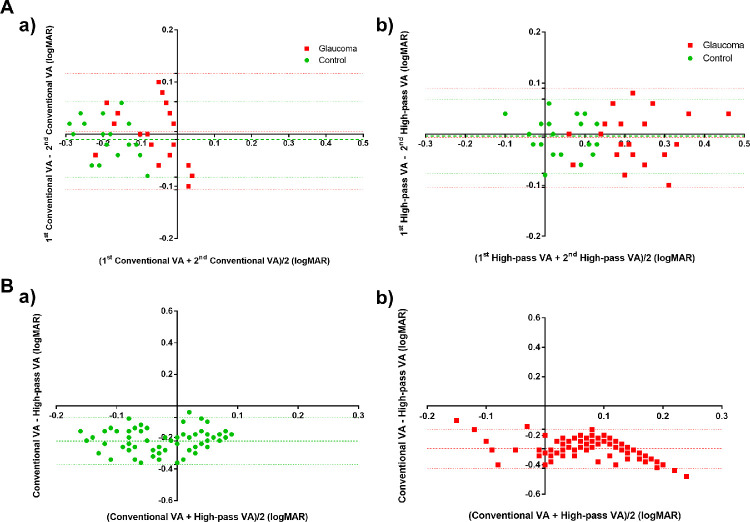
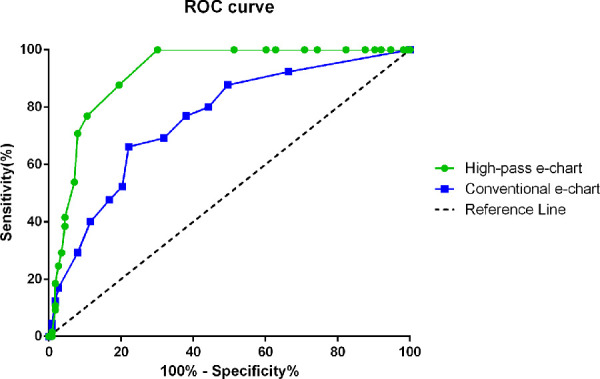
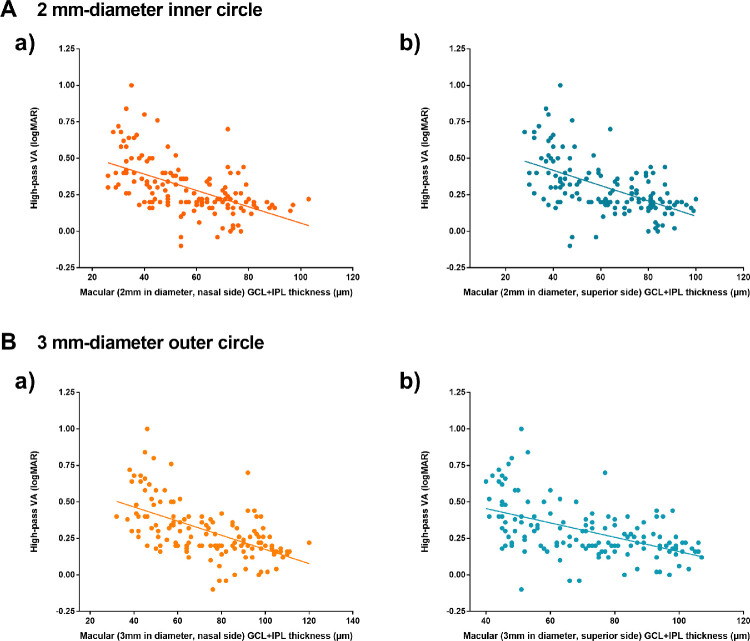
Results: The mean deviation (MD) of 30-2 VF test was -12.77 ± 7.47 dB for glaucoma group and -1.70 ± 1.12 dB for control group. The mean difference of the two VAs was slightly larger in glaucoma group (0.29 logMAR) than in control group (0.22 logMAR). The area under the receiver operating characteristic curve of the high-pass e-chart was larger than that of conventional e-chart (0.917 vs. 0.757, P < 0.001). Significant correlations between high-pass VA and GCL+IPL thickness were found only in the MVF-damaged group. Compared with conventional VA, high-pass VA demonstrates stronger correlations with nasal-side macular GCL+IPL thickness (Fisher's Z-test, two-tailed, P2mmin diameter = 0.033 and P3mmin diameter = 0.005).
Conclusions: Compared with conventional VA, high-pass VA displays slightly higher sensitivity to visual loss in glaucoma and has a stronger correlation with the nasal-side macular GCL+IPL thickness.
Translational relevance: The high-pass acuity test has the potential to be used as an ancillary tool to monitor glaucoma over time.
Conflict of interest statement
Disclosure:
Figures

Similar articles
-
Low-Contrast High-Pass Visual Acuity Might Help to Detect Glaucoma Damage: A Structure-Function Analysis.Front Med (Lausanne). 2021 May 14;8:680823. doi: 10.3389/fmed.2021.680823. eCollection 2021. Front Med (Lausanne). 2021. PMID: 34055847 Free PMC article.
-
Ganglion Cell-Inner Plexiform Layer Thickness in Different Glaucoma Stages Measured by Optical Coherence Tomography.Ophthalmic Res. 2018;59(3):148-154. doi: 10.1159/000478052. Epub 2017 Sep 7. Ophthalmic Res. 2018. PMID: 28877522
-
Segmented inner plexiform layer thickness as a potential biomarker to evaluate open-angle glaucoma: Dendritic degeneration of retinal ganglion cell.PLoS One. 2017 Aug 3;12(8):e0182404. doi: 10.1371/journal.pone.0182404. eCollection 2017. PLoS One. 2017. PMID: 28771565 Free PMC article.
-
Relationship between visual acuity and retinal structures measured by spectral domain optical coherence tomography in patients with open-angle glaucoma.Invest Ophthalmol Vis Sci. 2014 Jul 17;55(8):4801-11. doi: 10.1167/iovs.13-13052. Invest Ophthalmol Vis Sci. 2014. PMID: 25034596
-
The diagnostic accuracy and prognostic value of OCT for the evaluation of the visual function in children with a brain tumour: A systematic review.PLoS One. 2021 Dec 23;16(12):e0261631. doi: 10.1371/journal.pone.0261631. eCollection 2021. PLoS One. 2021. PMID: 34941930 Free PMC article.
Cited by
-
Value of optical coherence tomography measurement of macular thickness and optic disc parameters for glaucoma screening in patients with high myopia.World J Clin Cases. 2023 May 16;11(14):3187-3194. doi: 10.12998/wjcc.v11.i14.3187. World J Clin Cases. 2023. PMID: 37274056 Free PMC article.
References
-
- Jonas JB, Aung T, Bourne RR, Bron AM, Ritch R, Panda-Jonas S. Glaucoma. Lancet. 2017; 390: 2183–2193. - PubMed
-
- Tham YC, Li X, Wong TY, Quigley HA, Aung T, Cheng CY.. Global prevalence of glaucoma and projections of glaucoma burden through 2040: a systematic review and meta-analysis. Ophthalmology. 2014; 121: 2081–2090. - PubMed
-
- Kerrigan-Baumrind LA, Quigley HA, Pease ME, Kerrigan DF, Mitchell RS.. Number of ganglion cells in glaucoma eyes compared with threshold visual field tests in the same persons. Invest Ophthalmol Vis Sci. 2000; 41: 741–748. - PubMed
-
- Heilmann K, Richardson KT (eds). Glaucoma: conceptions of a disease: pathogenesis, diagnosis, therapy. Philadelphia: WB Saunders, 1978.
Publication types
MeSH terms
LinkOut - more resources
Full Text Sources
Miscellaneous
