. 2021 May 26;288(1951):20210458.
doi: 10.1098/rspb.2021.0458. Epub 2021 May 19.

Restricted dispersal in a sea of gene flow

Affiliations

Restricted dispersal in a sea of gene flow

L Benestan et al. Proc Biol Sci. .

Abstract

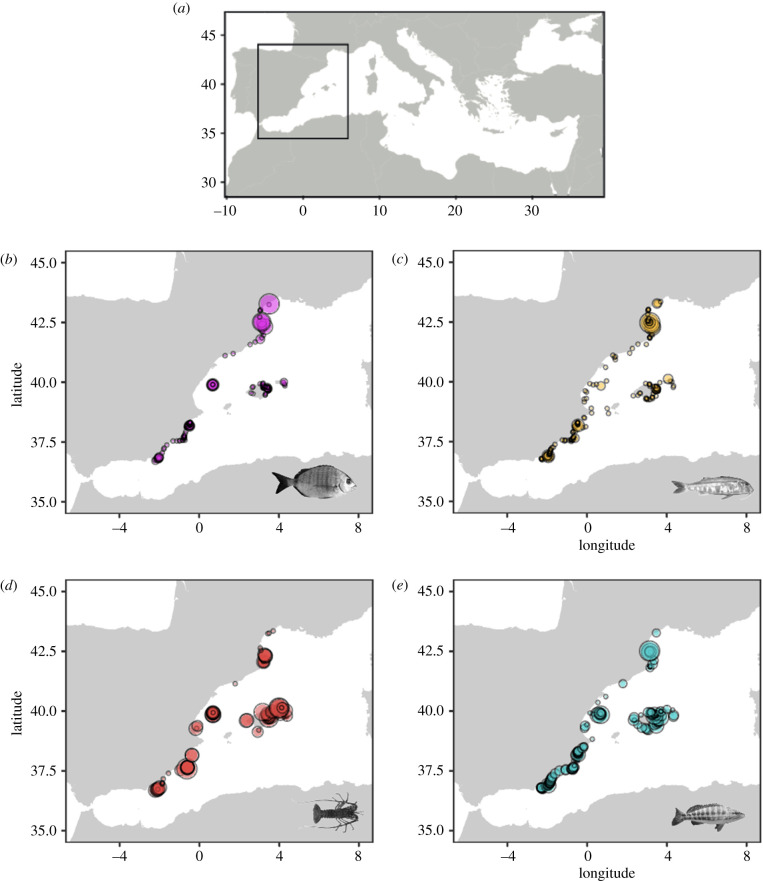
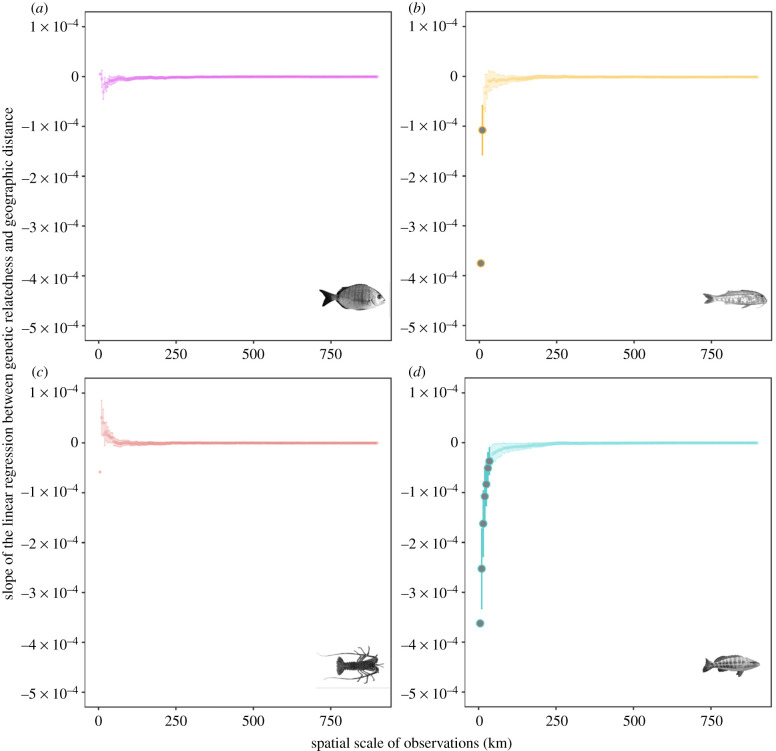
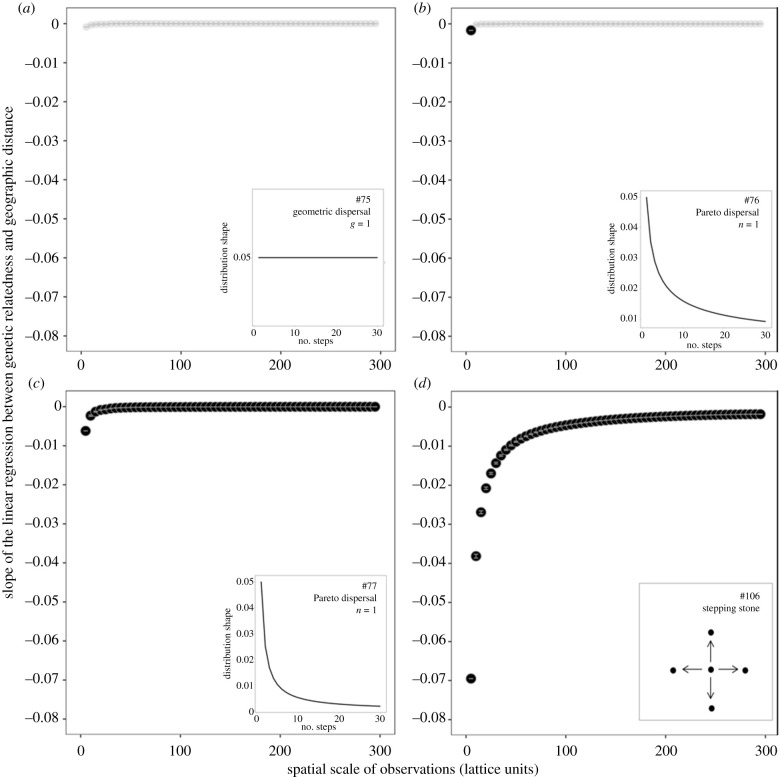
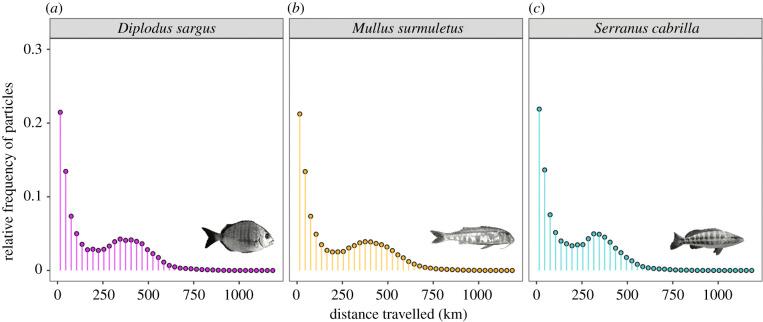
How far do marine larvae disperse in the ocean? Decades of population genetic studies have revealed generally low levels of genetic structure at large spatial scales (hundreds of kilometres). Yet this result, typically based on discrete sampling designs, does not necessarily imply extensive dispersal. Here, we adopt a continuous sampling strategy along 950 km of coast in the northwestern Mediterranean Sea to address this question in four species. In line with expectations, we observe weak genetic structure at a large spatial scale. Nevertheless, our continuous sampling strategy uncovers a pattern of isolation by distance at small spatial scales (few tens of kilometres) in two species. Individual-based simulations indicate that this signal is an expected signature of restricted dispersal. At the other extreme of the connectivity spectrum, two pairs of individuals that are closely related genetically were found more than 290 km apart, indicating long-distance dispersal. Such a combination of restricted dispersal with rare long-distance dispersal events is supported by a high-resolution biophysical model of larval dispersal in the study area, and we posit that it may be common in marine species. Our results bridge population genetic studies with direct dispersal studies and have implications for the design of marine reserve networks.

Keywords: dispersal; gene flow; isolation by distance; marine reserves; relatedness.


Figures

Figure 1.
Figure 1.
Sampling design. Four species were sampled as continuously as possible along 950 km of coast in the north-western Mediterranean Sea for a total of 1299 individuals. (a) White seabream (Diplodus sargus) (n = 276), (b) red mullet (Mullus surmuletus) (n = 312), (c) European spiny lobster (Palinurus elephas) (n = 243), and (d) comber (Serranus cabrilla) (n = 456). The size of circles reflects the number of individuals per site (mean = 2, range 1–31 samples). A total of 615 sites were sampled. (Online version in colour.)
Figure 2.
Figure 2.
Empirical spatial genetic patterns. The slope of the linear regression between genetic relatedness and geographic distance among pairs of individuals at various spatial scales of observation. Slope averages and error bars from a resampling procedure (see Methods). Note the logarithmic scale on the slope. The slopes that are statistically significant following the standardized effect size (SES) procedure (see Methods) are highlighted in bold. (a) White seabream (Diplodus sargus), (b) red mullet (Mullus surmuletus), (c) European spiny lobster (Palinurus elephas), and (d) comber (Serranus cabrilla). (Online version in colour.)
Figure 3.
Figure 3.
Results from four representative genetic simulations. The slope of the linear regression between genetic relatedness and geographic distance among pairs of samples at various spatial scales of observation. Slope averages and error bars from a resampling procedure (see Methods). The slopes that are statistically significant following the standardized effect size (SES) procedure (see Methods) are highlighted in bold. The four panels show four scenarios with different dispersal kernels that vary in the proportion of long-distance dispersal. Total emigration rate = 0.1 for all simulations with the following dispersal function: (a) geometric, g = 1, (b) Pareto, n = 0.5, (c) Pareto, n = 1, and (d) stepping stone (dispersal between neighbouring nodes only). The dispersal kernel used for each panel is illustrated in the inset (the numbers 75, 76, 77, and 106 refer to the simulation ID in electronic supplementary material table S4, where the details of the simulation parameters are presented). The four simulations illustrate the range of the results that were observed in the simulations, from a slight increase in IBD at small spatial scales and a pattern that is never significant (a) to a marked increase in IBD at small spatial scales and a pattern that is significant at all spatial scales (d).
Figure 4.
Figure 4.
Dispersal distance distributions as simulated by the high-resolution biophysical model of the north-western Mediterranean. Relative frequencies of binned (30 km bin-width) larval dispersal distances for (a) white seabream (Diplodus sargus, magenta), (b) red mullet (Mullus surmuletus, orange), and (c) comber (Serranus cabrilla, turquoise) reveal that dispersal is occurring most frequently at short distances around 15 km, but long-distance dispersal events with secondary peaks between 300 and 400 km related to the advection of larvae with ocean currents in the order of 0.1 m s−1 are also captured. These results are consistent with the combination of restricted and long-distance dispersal suggested by the empirical and simulated genetic data. (Online version in colour.)

References

    1. Kelley JL, Brown AP, Therkildsen NO, Foote AD. 2016. The life aquatic: advances in marine vertebrate genomics. Nat. Rev. Genet. 17, 523-534. (10.1038/nrg.2016.66) - DOI - PubMed
    1. Grummer JA, Beheregaray LB, Bernatchez L, Hand BK, Luikart G, Narum SR, Taylor EB. 2019. Aquatic landscape genomics and environmental effects on genetic variation. Trends Ecol. Evol. 34, 641-654. (10.1016/j.tree.2019.02.013) - DOI - PubMed
    1. McCauley DJ, Pinsky ML, Palumbi SR, Estes JA, Joyce FH, Warner RR. 2015. Marine defaunation: animal loss in the global ocean. Science 347, 1255641. (10.1126/science.1255641) - DOI - PubMed
    1. Lowe WH, Allendorf FW. 2010. What can genetics tell us about population connectivity? Mol. Ecol. 19, 3038-3051. (10.1111/j.1365-294X.2010.04688.x) - DOI - PubMed
    1. Magris RA, Andrello M, Pressey RL, Mouillot D, Dalongeville A, Jacobi MN, Manel S. 2018. Biologically representative and well-connected marine reserves enhance biodiversity persistence in conservation planning. Conserv. Lett. 11, e12439. (10.1111/conl.12439) - DOI

Publication types

LinkOut - more resources