. 2021 Jun 10;184(12):3222-3241.e26.
doi: 10.1016/j.cell.2021.04.021. Epub 2021 May 17.

A taxonomy of transcriptomic cell types across the isocortex and hippocampal formation

Affiliations

A taxonomy of transcriptomic cell types across the isocortex and hippocampal formation

Zizhen Yao et al. Cell. .

Abstract

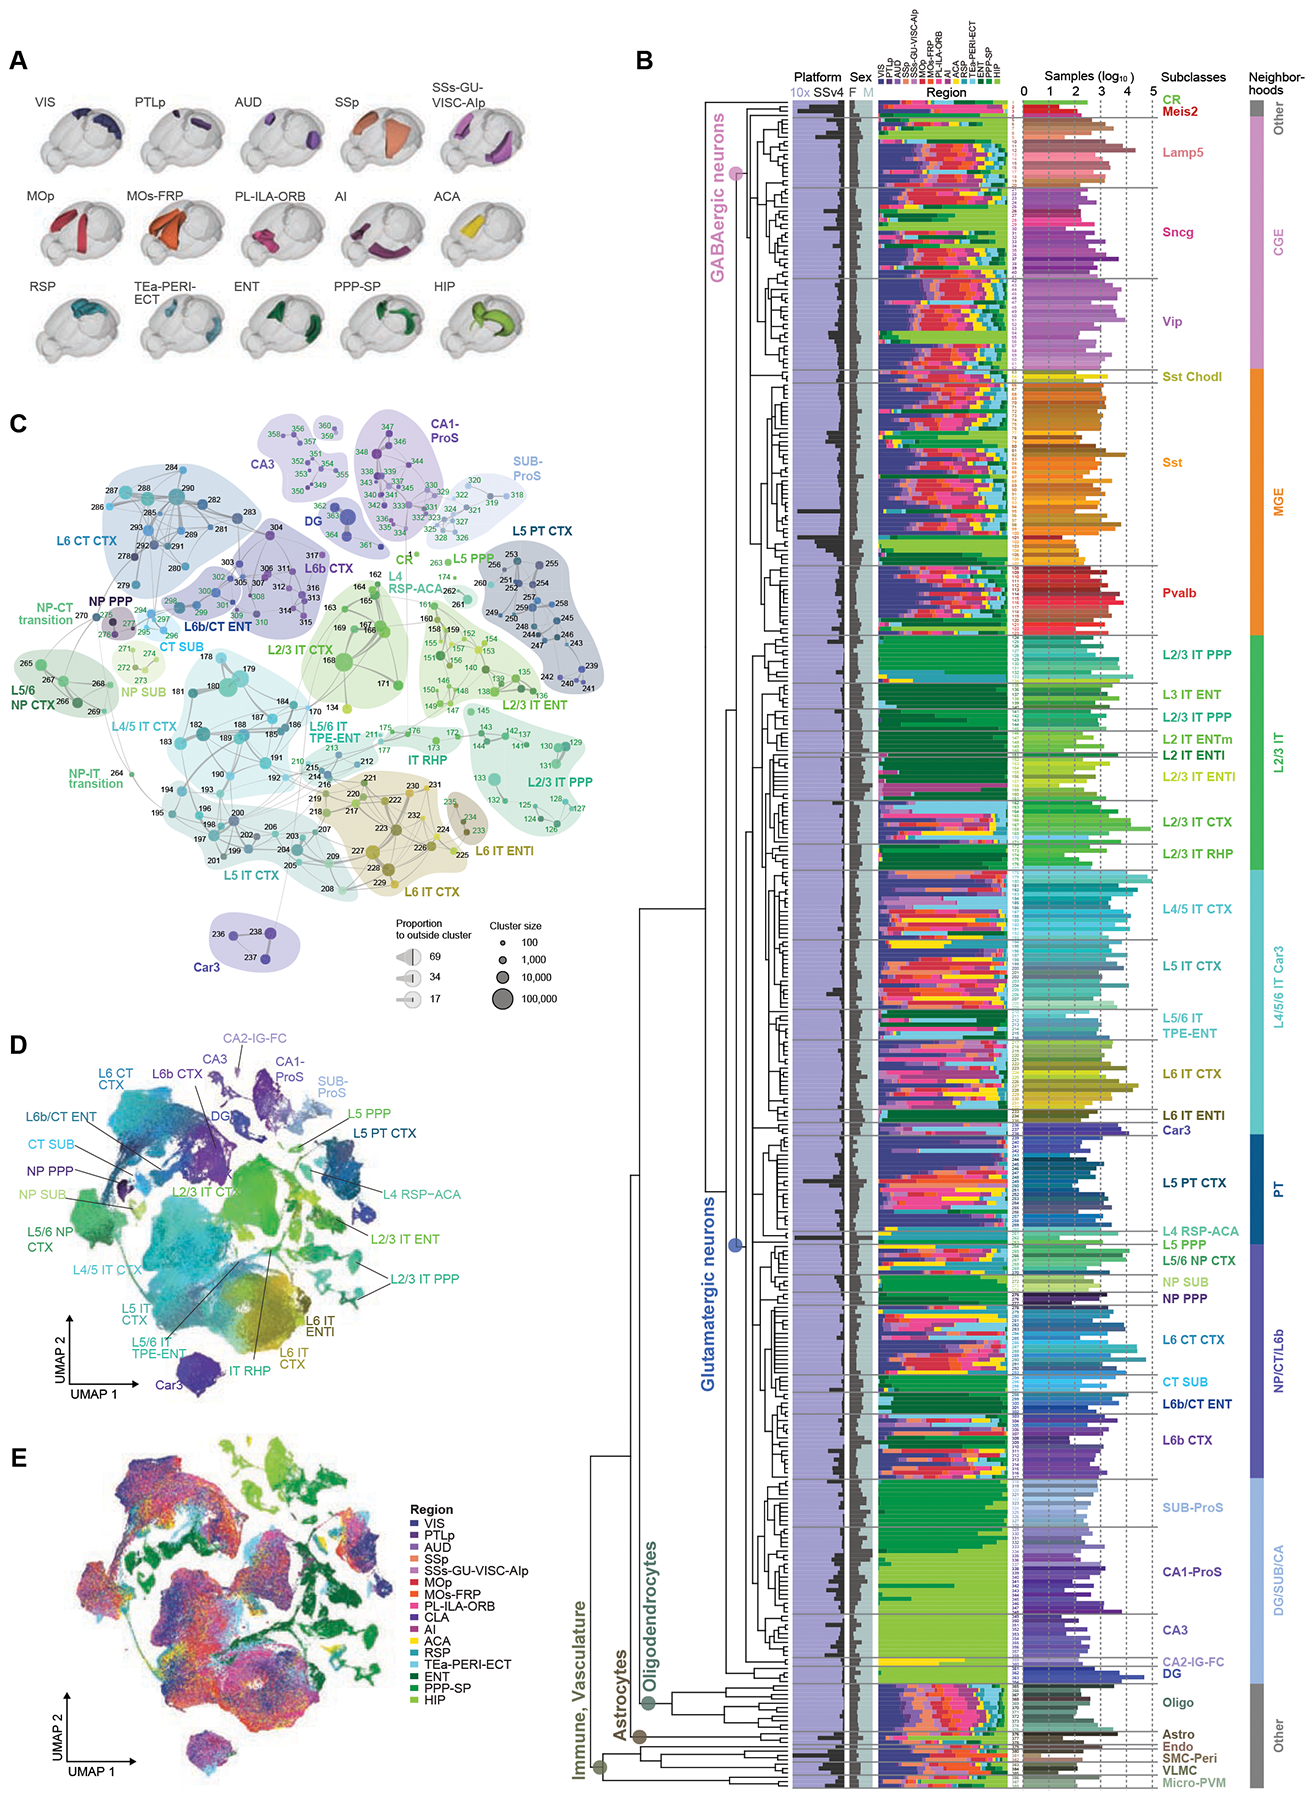
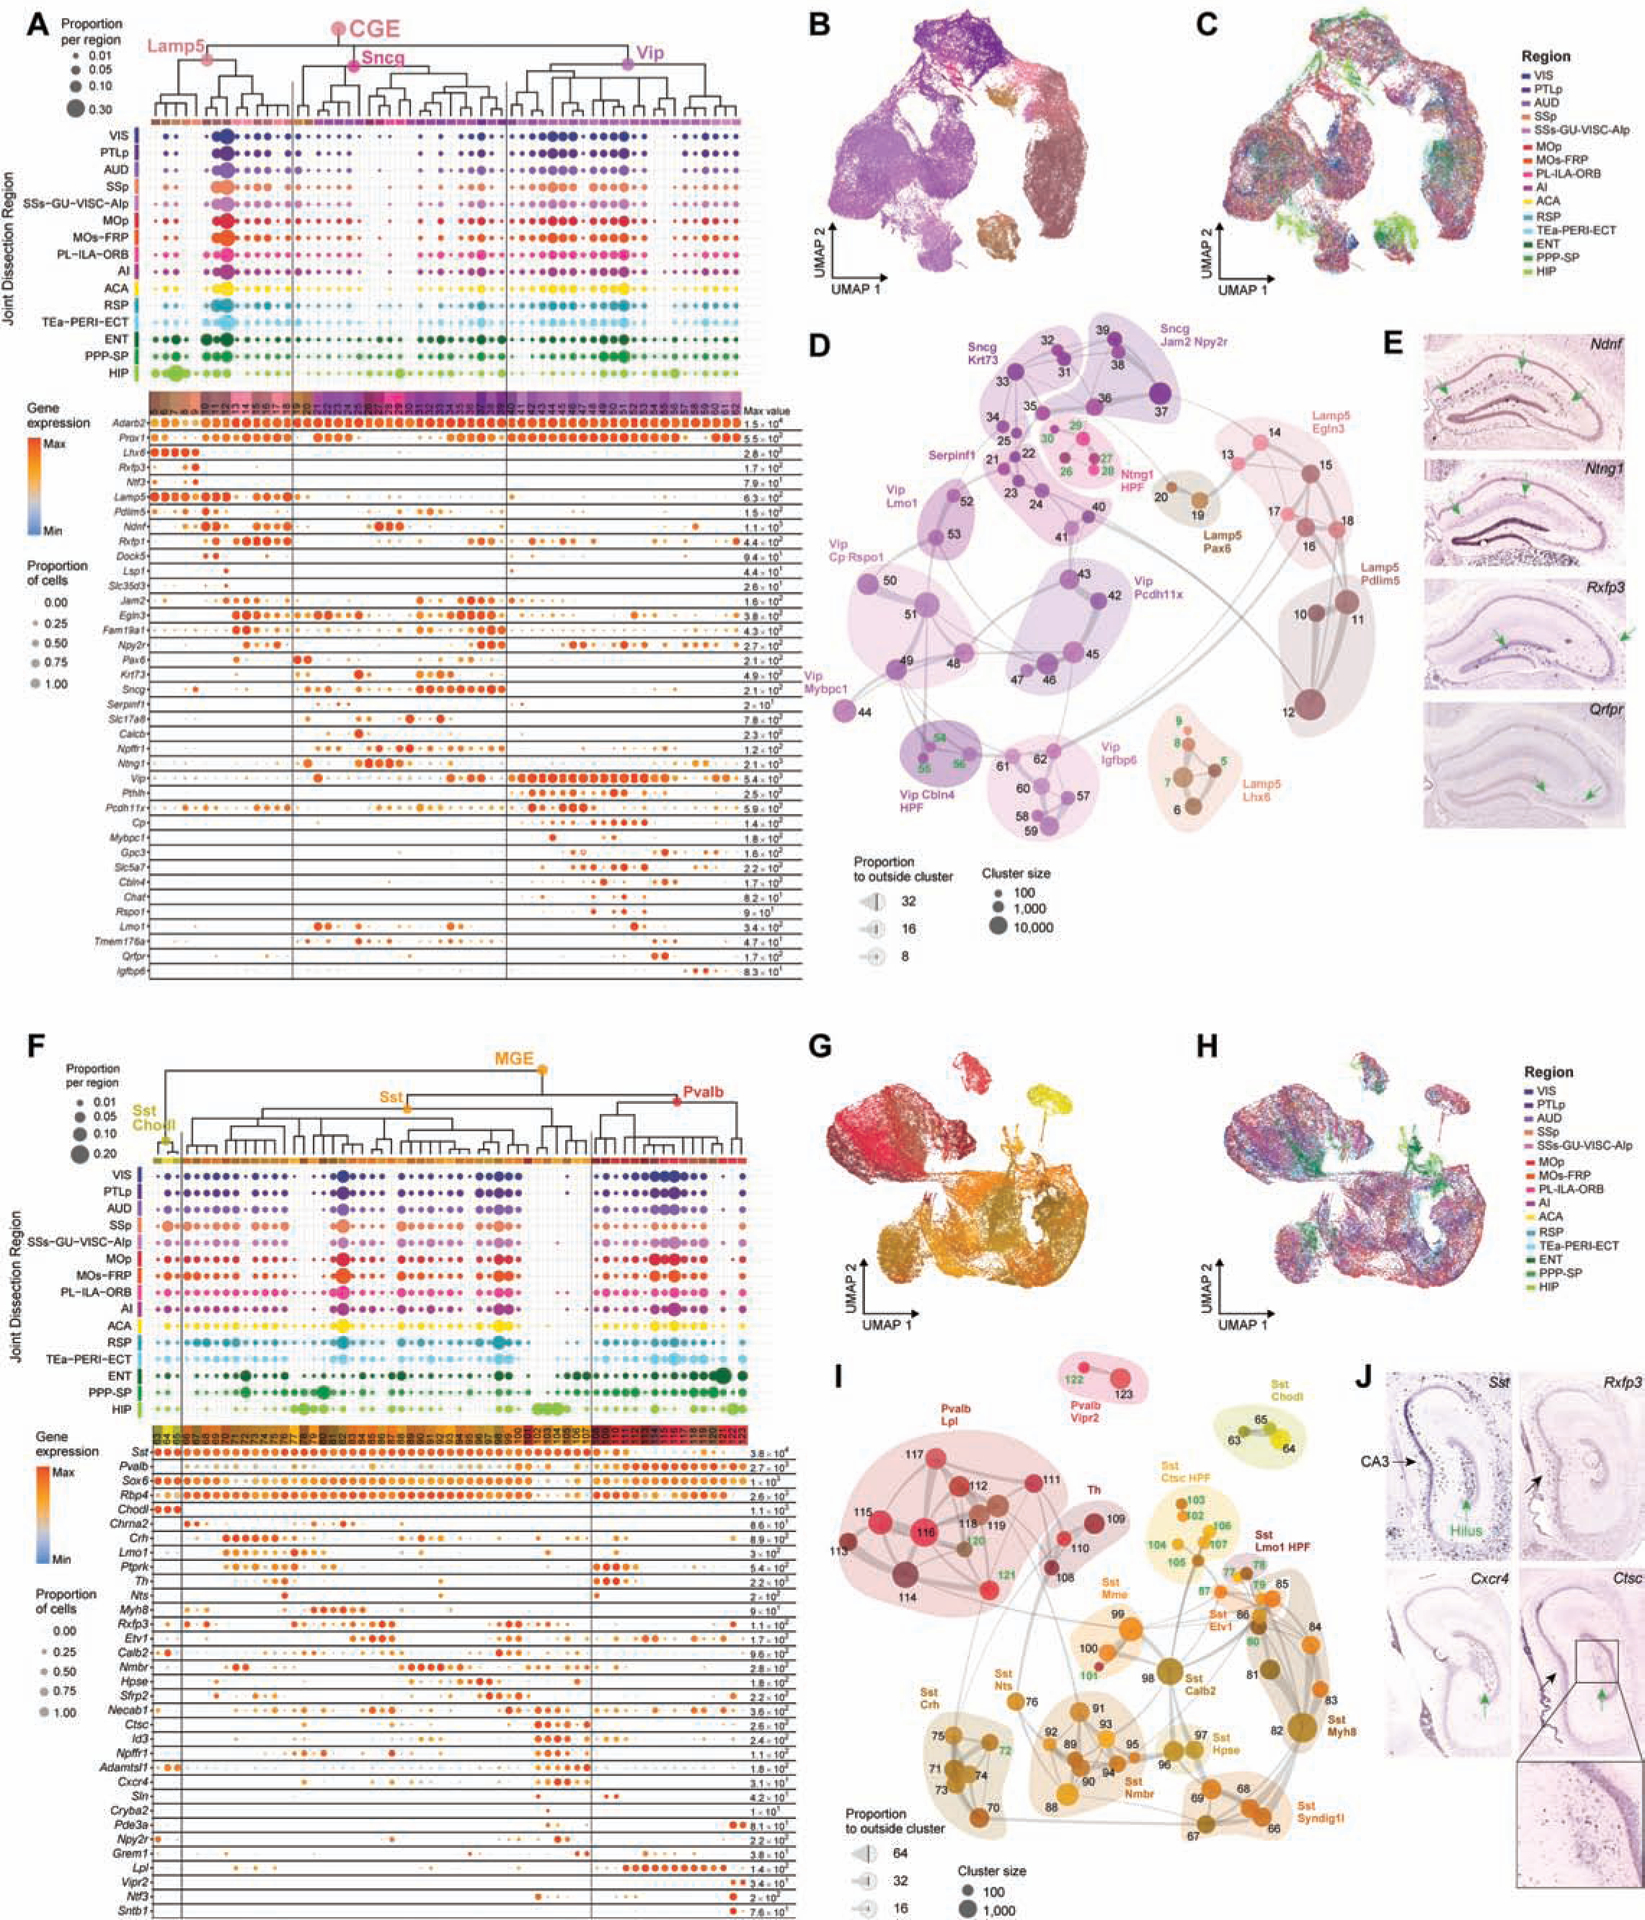
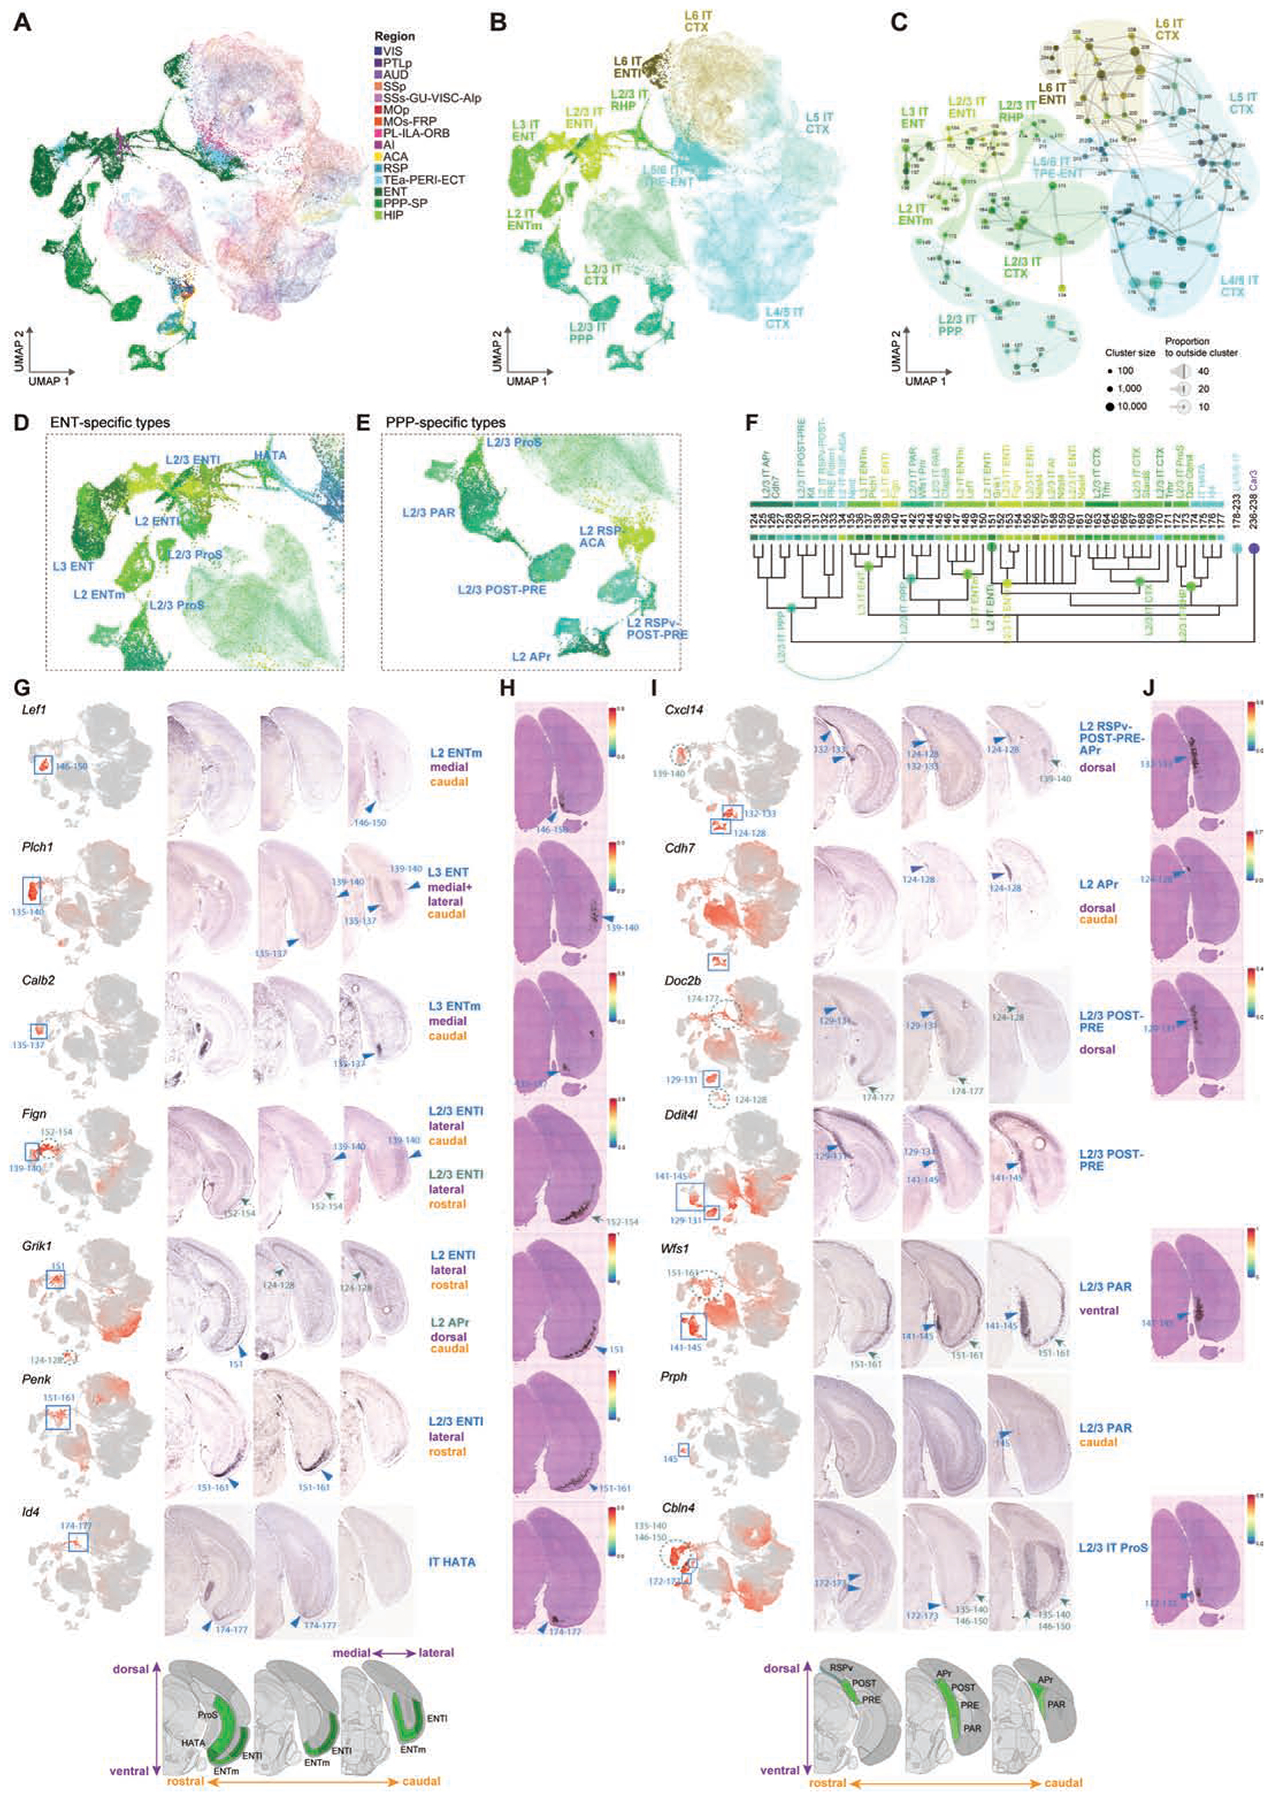
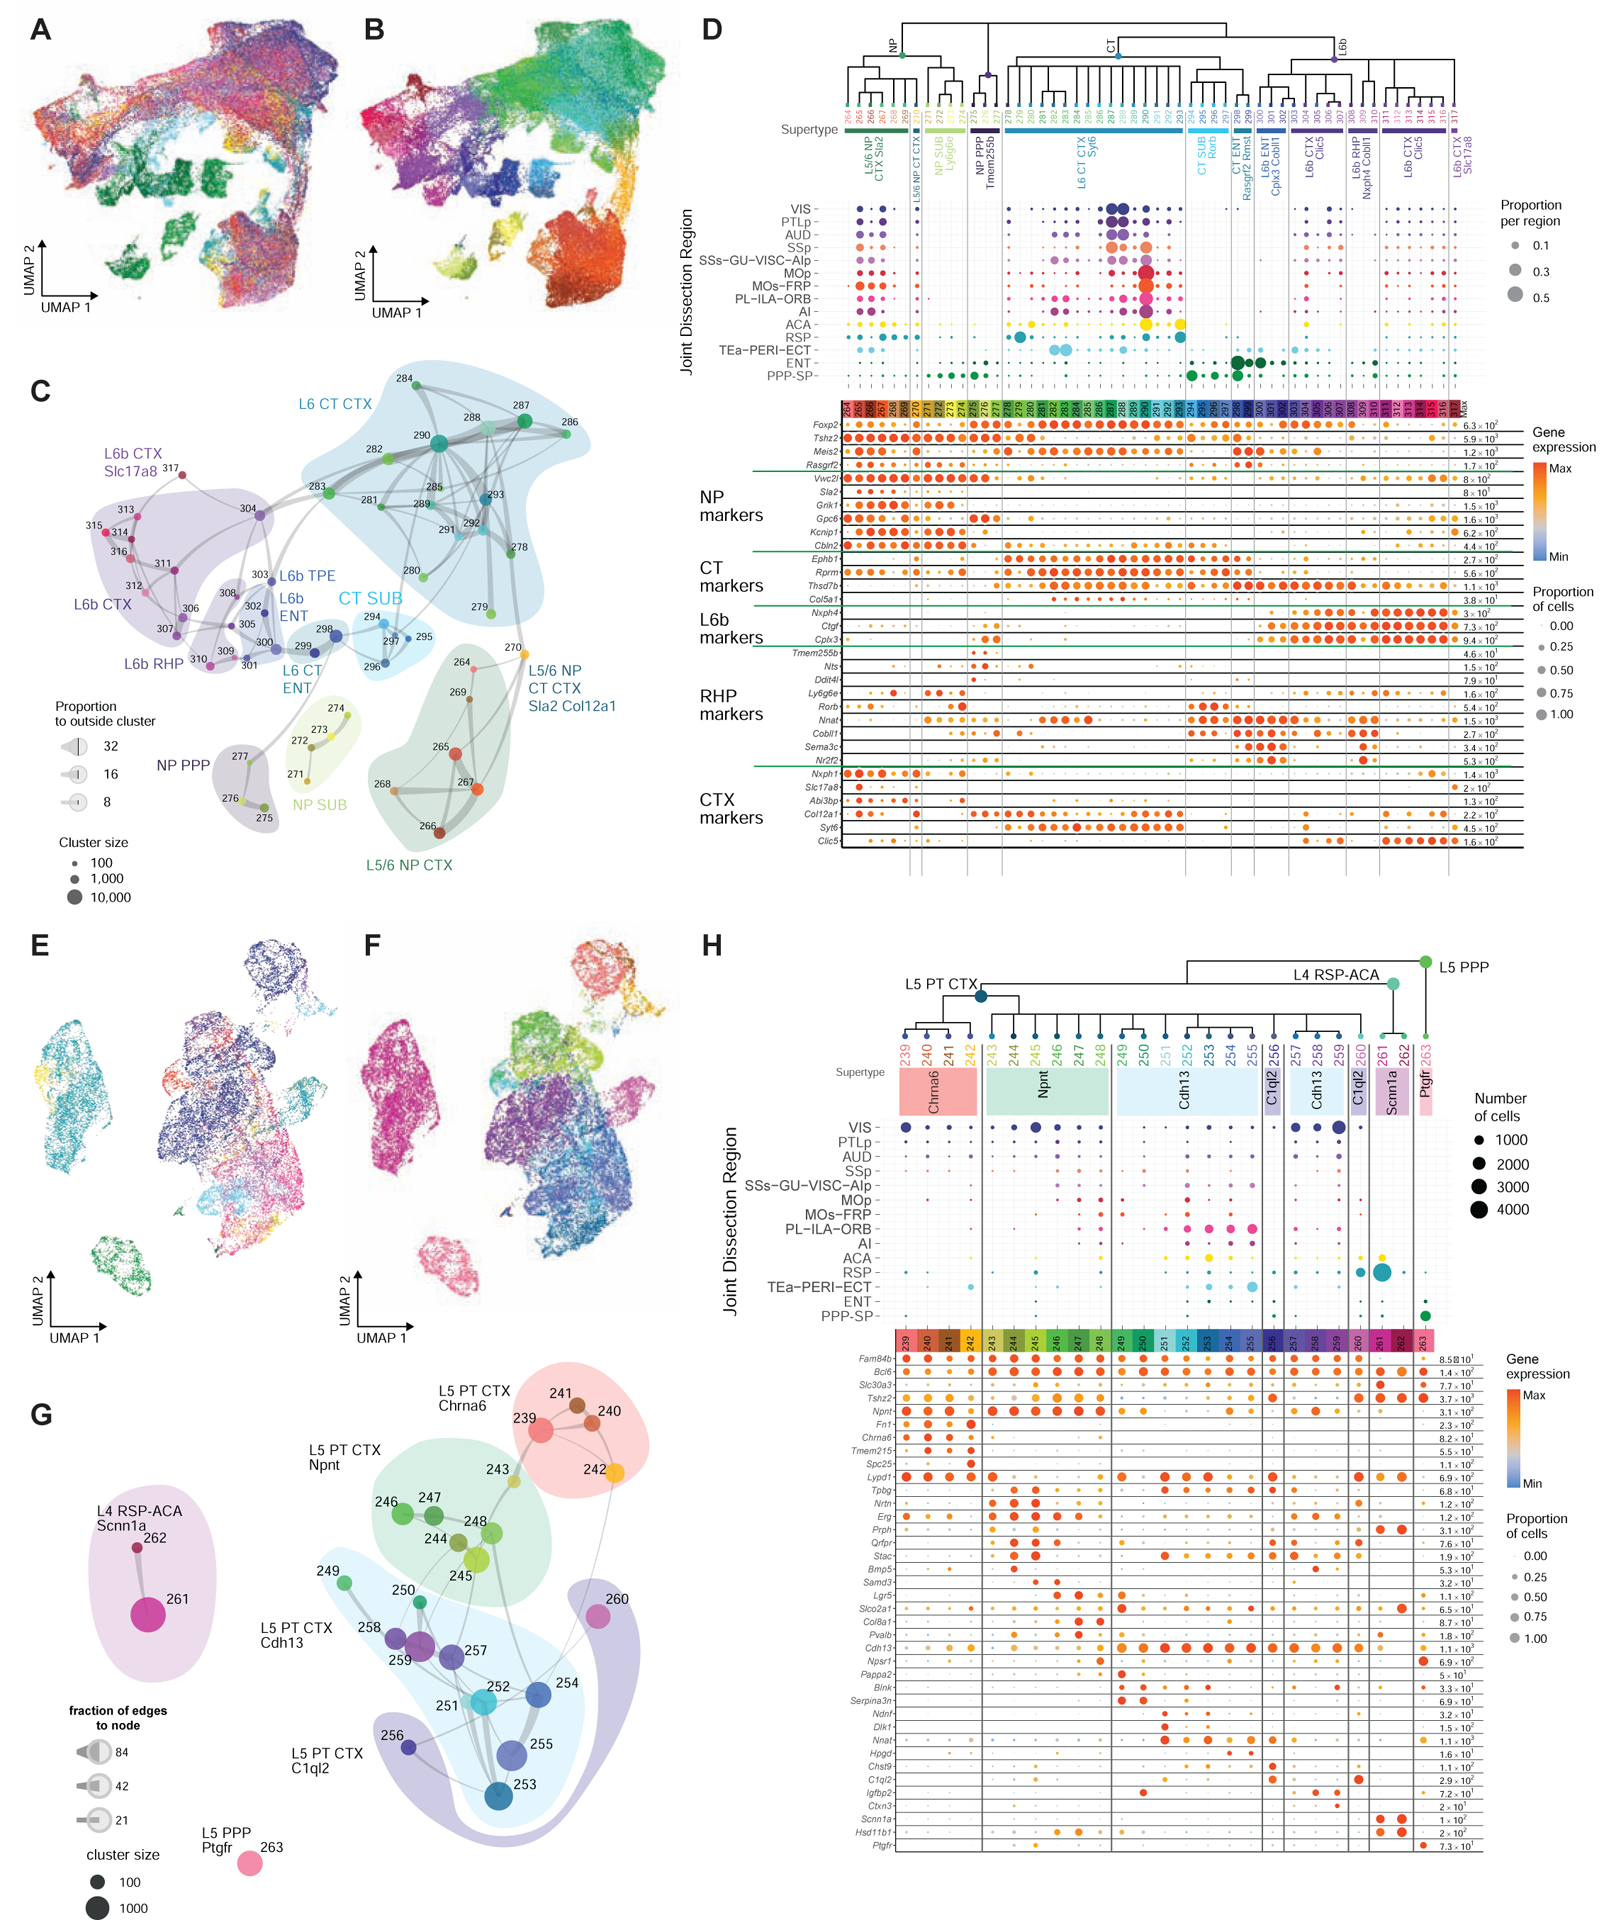
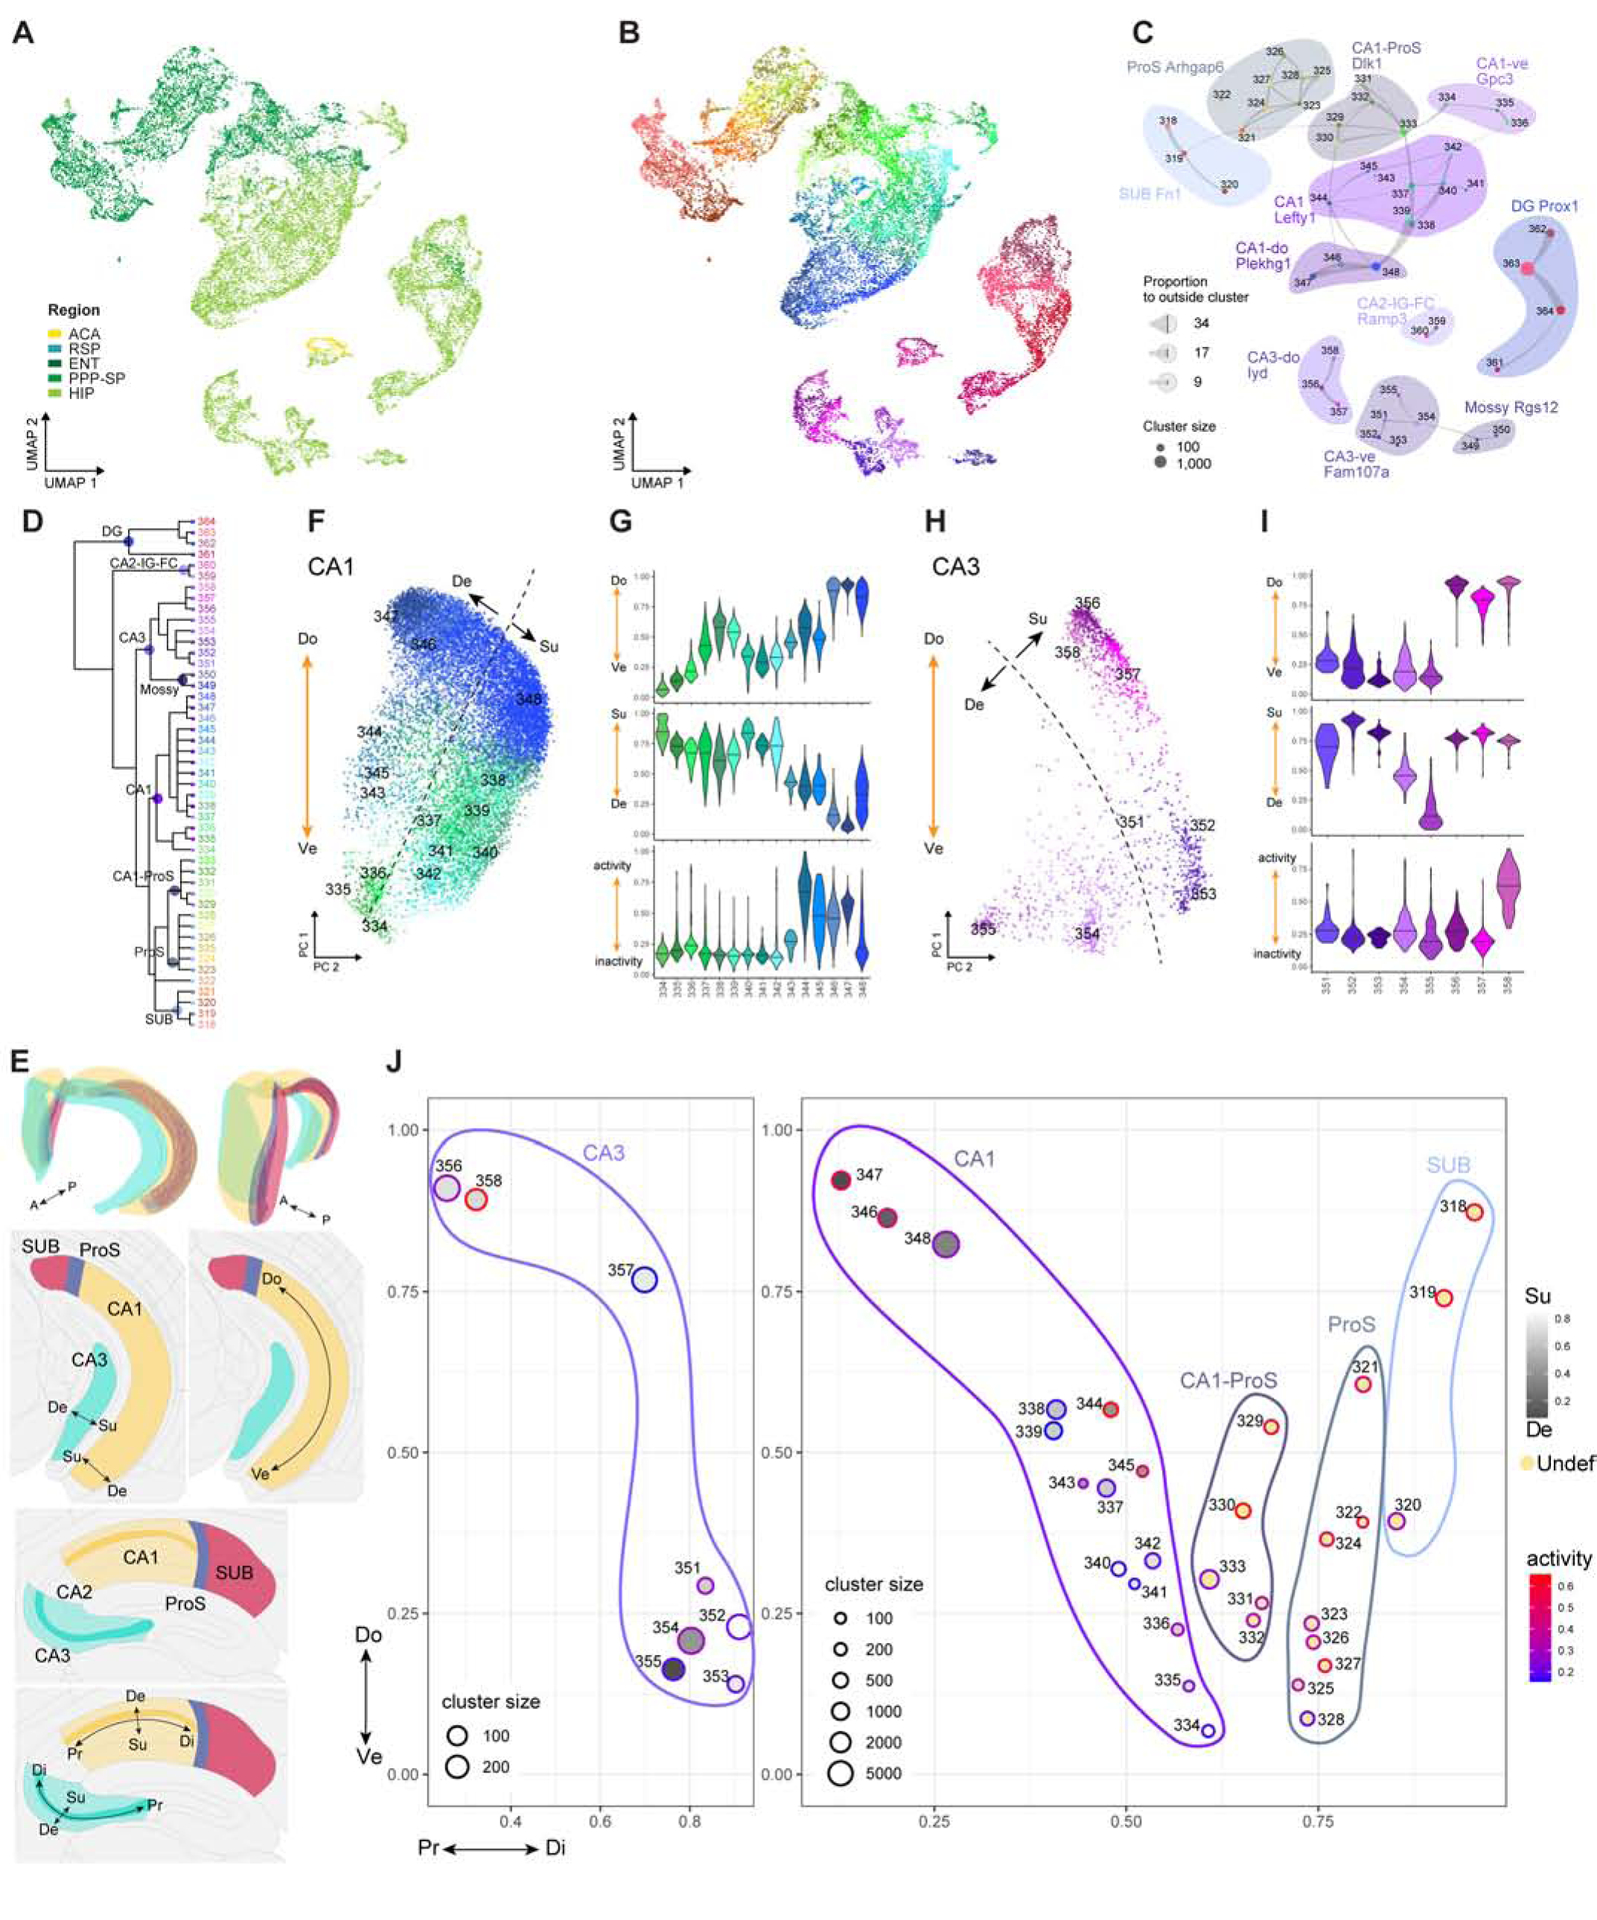
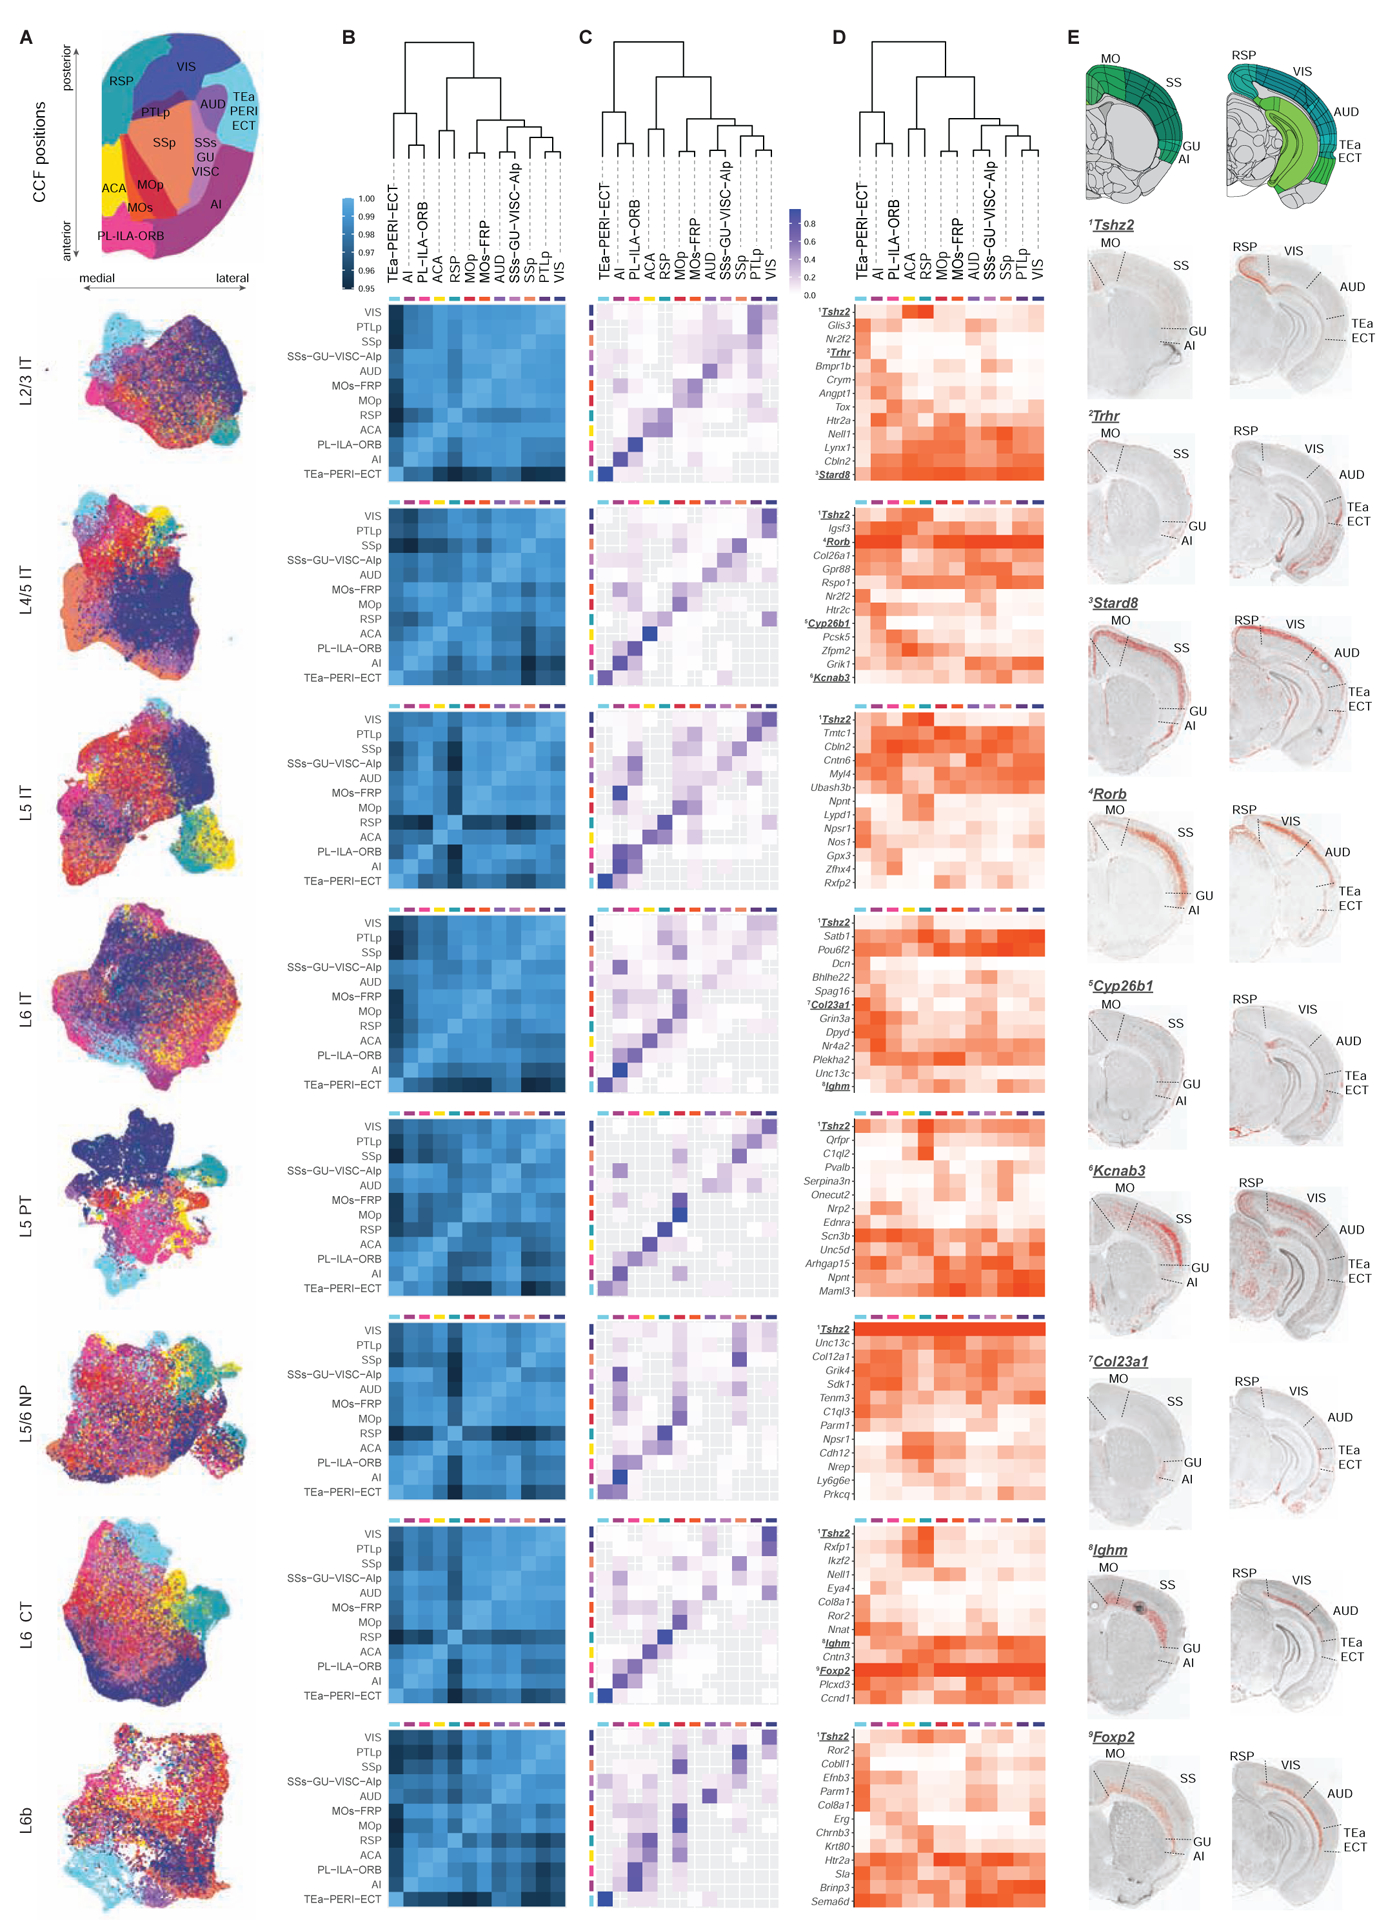
The isocortex and hippocampal formation (HPF) in the mammalian brain play critical roles in perception, cognition, emotion, and learning. We profiled ∼1.3 million cells covering the entire adult mouse isocortex and HPF and derived a transcriptomic cell-type taxonomy revealing a comprehensive repertoire of glutamatergic and GABAergic neuron types. Contrary to the traditional view of HPF as having a simpler cellular organization, we discover a complete set of glutamatergic types in HPF homologous to all major subclasses found in the six-layered isocortex, suggesting that HPF and the isocortex share a common circuit organization. We also identify large-scale continuous and graded variations of cell types along isocortical depth, across the isocortical sheet, and in multiple dimensions in hippocampus and subiculum. Overall, our study establishes a molecular architecture of the mammalian isocortex and hippocampal formation and begins to shed light on its underlying relationship with the development, evolution, connectivity, and function of these two brain structures.

Keywords: GABAergic; cell type; cortex; excitatory neuron; glutamatergic; hippocampus; interneuron; single-cell RNA sequencing; single-cell transcriptomics.


Conflict of interest statement

Declaration of interests The authors declare no competing interests.

Figures

Figure 1.
Figure 1.. Transcriptomic cell type taxonomy of the isocortex and hippocampal formation.
(A) Overview of sampled brain regions rendered in Allen CCFv3. The PPP-SP joint region includes PAR-POST-PRE-SUB-ProS. (B) The transcriptomic taxonomy tree of 388 clusters organized in a dendrogram (10xv2: n = 1,169,213; SSv4: n = 73,346). Bar plots represent fractions of cells profiled according to platform, sex, and region, and the total number of cells per cluster on a log10 scale. (C) Constellation plot of the global relatedness between glutamatergic types. Each cluster is represented by a dot, positioned at the cluster centroid in UMAP coordinates shown in D. Clusters are grouped by subclass. Clusters with more than 80% of cells derived from HPF are labeled green. (D-E) UMAP representation of glutamatergic types colored by cluster (D) or region (E). See also Tables S1–S4, Methods S1, Data S1, Figure S2.
Figure 2.
Figure 2.. GABAergic cell types of isocortex and hippocampal formation.
(A) Dendrogram of CGE clusters followed by dot plots showing proportion of cells within each cluster derived from each region of dissection and marker gene expression in each cluster from the 10xv2 dataset. Dot size and color indicate proportion of expressing cells and average expression level in each cluster, respectively. (B-C) UMAP representation of CGE clusters, colored by cluster (B) or region (C). (D) Constellation plot of CGE clusters using UMAP coordinates shown in B. Clusters are grouped by supertype. Clusters with more than 80% of cells derived from HPF are labeled green. (E) RNA ISH from Allen Mouse Brain Atlas (ABA) for select markers expressed in the HPF-specific CGE supertypes. (F-J) Same as A-E but for MGE clusters. See also Figure S1, Data S1.
Figure 3.
Figure 3.. Comparison of glutamatergic cell types in isocortex and hippocampal formation.
(A) Correspondence of HPF clusters to CTX subclasses, represented as a proportion of total matches. Lower panel shows the number of differentially expressed genes between each HPF cluster and its best-matched CTX cluster. (B) Overview of glutamatergic cell types across all regions in CTX and HPF. Cell types are shown by supertypes and clusters within each supertype. CTX and HPF are separated by a solid line. Cell types in each CTX and RHP region (but not HIP) are displayed according to their layer specificity from top down. Cell types from RHP regions are aligned with those from CTX based on their similarity in layer specificity. IT types are shaded with pinkish ovals, PT, NP, CT and L6b types with yellowish ovals, and HIP types with blueish ovals. Each oval spans the major region(s) cells in each supertype come from. Within CTX, most supertypes span all areas. Some clusters within a given supertype exhibit preference for one or a few areas, and these clusters are shown as smaller ovals contained within the larger supertype oval. Cell types with similar projection patterns (intratelecephalic, extratelencephalic/subcerebral, or corticothalamic) are grouped by large brackets. See also Figures S2–S3.
Figure 4.
Figure 4.. Transcriptomic relationship and anatomical distribution of IT-like cell types in retrohippocampal regions.
(A-B) UMAP representation of IT neurons from CTX and HPF, colored by region (A) or subclass (B). The CTX neurons are faded out. (C) Constellation plot of IT types from CTX and HPF. Clusters are grouped by subclass. (D-E) Enlarged view of UMAP in B of ENT- (D) or PPP-specific (E) types colored by cluster. (F) Dendrogram of CTX, ENT and PPP IT clusters with branches annotated by subclass and supertype. (G) Anatomical annotation of various supertypes marked in D. UMAP representations, as in B, show expression of select supertype marker genes in red (blue boxes). RNA ISH images of supertype markers along three rostral to caudal sections reveal specific locations of the different supertypes (blue arrowheads). Green dashed circles and green arrows show additional expression sites of markers. (H) Spatial verification of supertypes shown in G using Visium. Spatial RNA-seq barcoded spots are labeled by prediction score for specified supertype. (I-J) Same as G-H but for supertypes marked in E.
Figure 5.
Figure 5.. Parallel sets of NP/CT/L6b and L5 PT related cell types in isocortex and hippocampal formation.
(A-B) UMAP representation of NP/CT/L6b cell types from CTX and HPF, colored by region (A) or cluster (B). (C) Constellation plot of NP/CT/L6b clusters. Clusters are grouped by supertype. (D) Dendrogram of NP/CT/L6b clusters followed by dot plots showing proportion of cells within each cluster derived from each region of dissection and marker gene expression in each cluster from the 10xv2 dataset. Clusters are grouped by supertype. (E-H) Same as A-D but for L5 PT related cell types. Regional dot plot in H shows number of cells per cluster and region. See also Figure S4.
Figure 6.
Figure 6.. Multi-dimensional distribution of glutamatergic cell types in hippocampus and subiculum.
(A-B) UMAP representation of DG/SUB/CA cell types, colored by region (A) or cluster (B). (C) Constellation plot of DG/SUB/CA clusters. Clusters are grouped by supertype. (D) Dendrogram of DG/SUB/CA clusters with annotation of major branches. (E) 3D and 2D schematics showing spatial axes within hippocampus and subiculum: proximal-distal (Pr-Di), superficial-deep (Su-De), and dorsal-ventral (Do-Ve). Images are rendered from CCFv3. (F) 2D PCA plot for CA1cells. PC1 corresponds to the Do-Ve axis. Dashed line shows the putative Su-De separation. (G) Violin plots showing distribution of CA1 clusters along Do-Ve, Su-De and activity axes. (H-I) Same as F-G but for CA3 cells. (J) Summary of cell type variation in Pr-Di, Do-Ve, Su-De and activity dimensions for CA3, CA1, ProS, and SUB. Each circle represents a cluster, for which the average values for its cell members along each of the four dimensions are computed. See also Figure S5, Data S1.
Figure 7.
Figure 7.. Regional gradients of distribution of glutamatergic cell types in isocortex.
(A) UMAP plots of isocortical cells in different subclasses. At the top is a 2D flatmap representation of isocortical regions according to their positions in CCFv3. (B) Heatmap of correlation between cortical regions for each subclass. At the top of B-D is a dendrogram of cortical regions generated based on their average gene expression within each subclass and concatenated across all subclasses. (C) Confusion matrix of the predictability of cortical regions for each subclass. Rows and columns correspond to the actual and predicted regional identities of cells, with the rows adding up to 1. (D) Heatmap of region-specific marker genes for each subclass. Color corresponds to fraction of cells expressing the given gene in each region. (E) RNA ISH images for numbered genes in D, showing regional distribution of marker gene expression for specific subclasses. See also Figures S6–S8, Data S1.

Comment in

References

    1. Bienkowski MS, Bowman I, Song MY, Gou L, Ard T, Cotter K, Zhu M, Benavidez NL, Yamashita S, Abu-Jaber J, et al. (2018). Integration of gene expression and brain-wide connectivity reveals the multiscale organization of mouse hippocampal networks. Nat Neurosci 21, 1628–1643. - PMC - PubMed
    1. Butler A, Hoffman P, Smibert P, Papalexi E, and Satija R (2018). Integrating single-cell transcriptomic data across different conditions, technologies, and species. Nat Biotechnol 36, 411–420. - PMC - PubMed
    1. Cadwell CR, Bhaduri A, Mostajo-Radji MA, Keefe MG, and Nowakowski TJ (2019).Development and Arealization of the Cerebral Cortex. Neuron 103, 980–1004. - PMC - PubMed
    1. Cembrowski MS, and Spruston N (2019). Heterogeneity within classical cell types is the rule: lessons from hippocampal pyramidal neurons. Nat Rev Neurosci 20, 193–204. - PubMed
    1. Cembrowski MS, Wang L, Lemire AL, Copeland M, DiLisio SF, Clements J, and Spruston N (2018). The subiculum is a patchwork of discrete subregions. eLife 7, e37701. - PMC - PubMed

Publication types