. 2021 Jun 10;184(12):3143-3162.e32.
doi: 10.1016/j.cell.2021.04.022. Epub 2021 May 17.

The PP2A-Integrator-CDK9 axis fine-tunes transcription and can be targeted therapeutically in cancer

Affiliations

The PP2A-Integrator-CDK9 axis fine-tunes transcription and can be targeted therapeutically in cancer

Stephin J Vervoort et al. Cell. .

Abstract

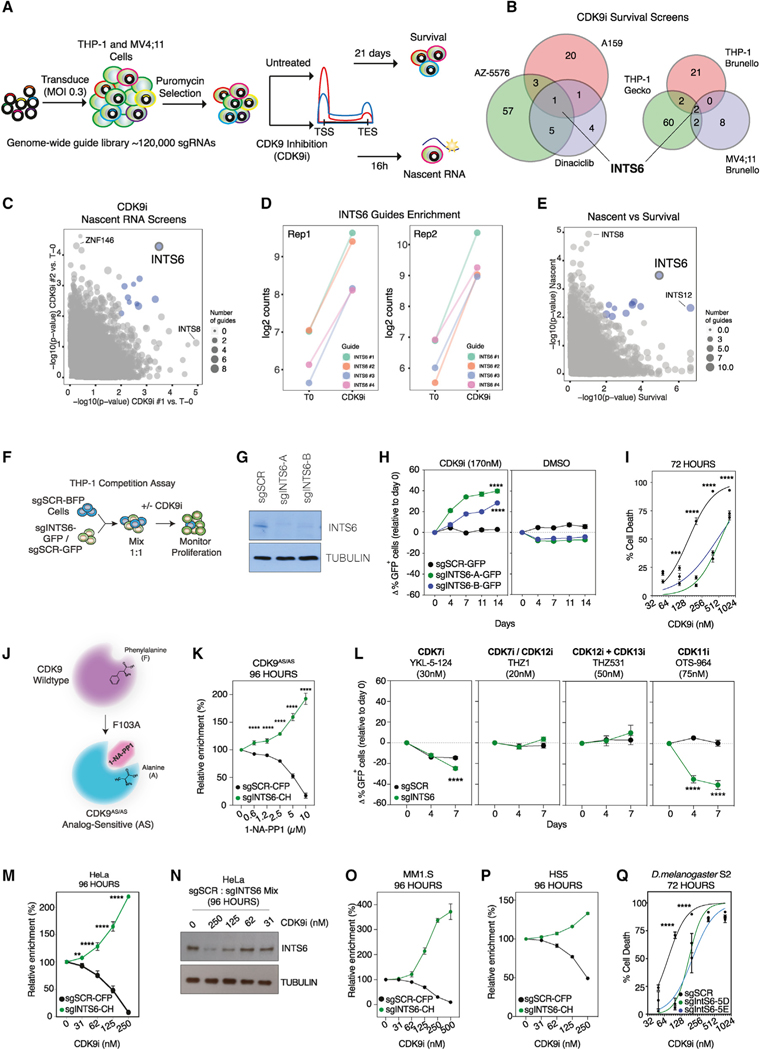
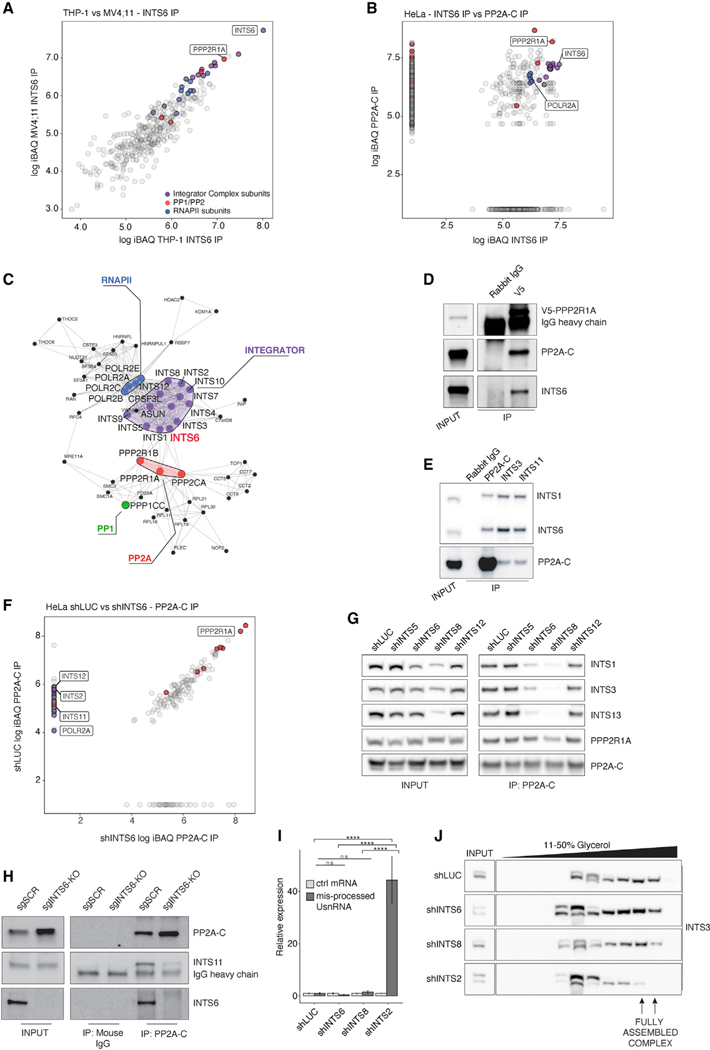
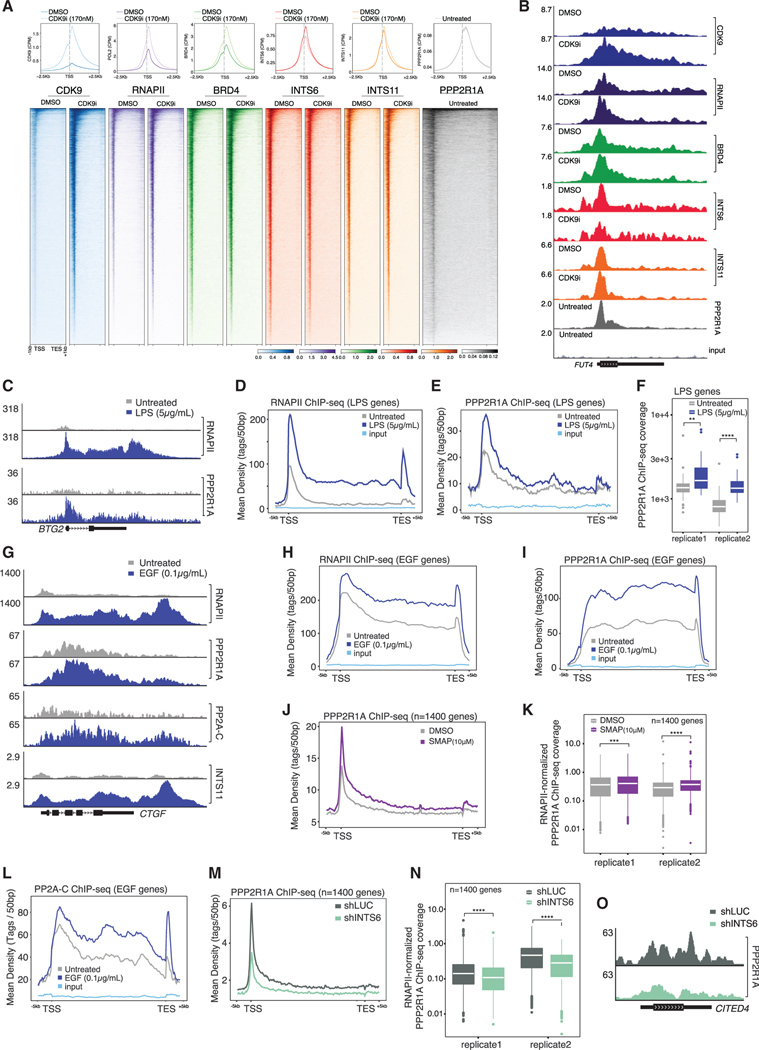
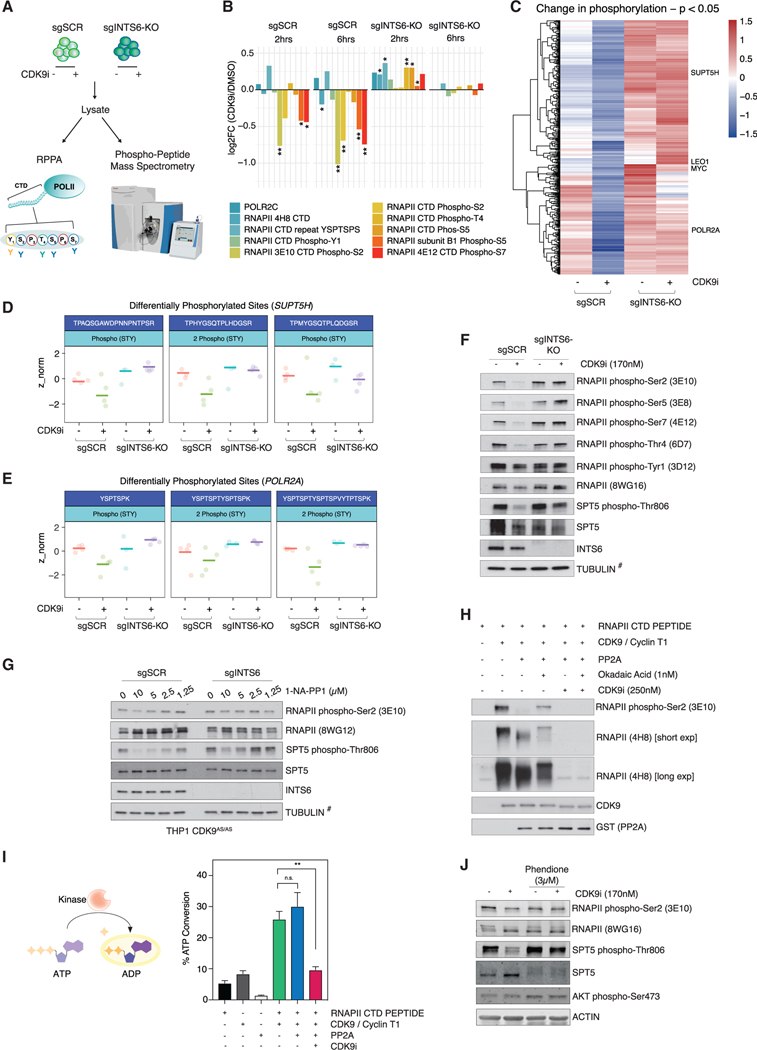
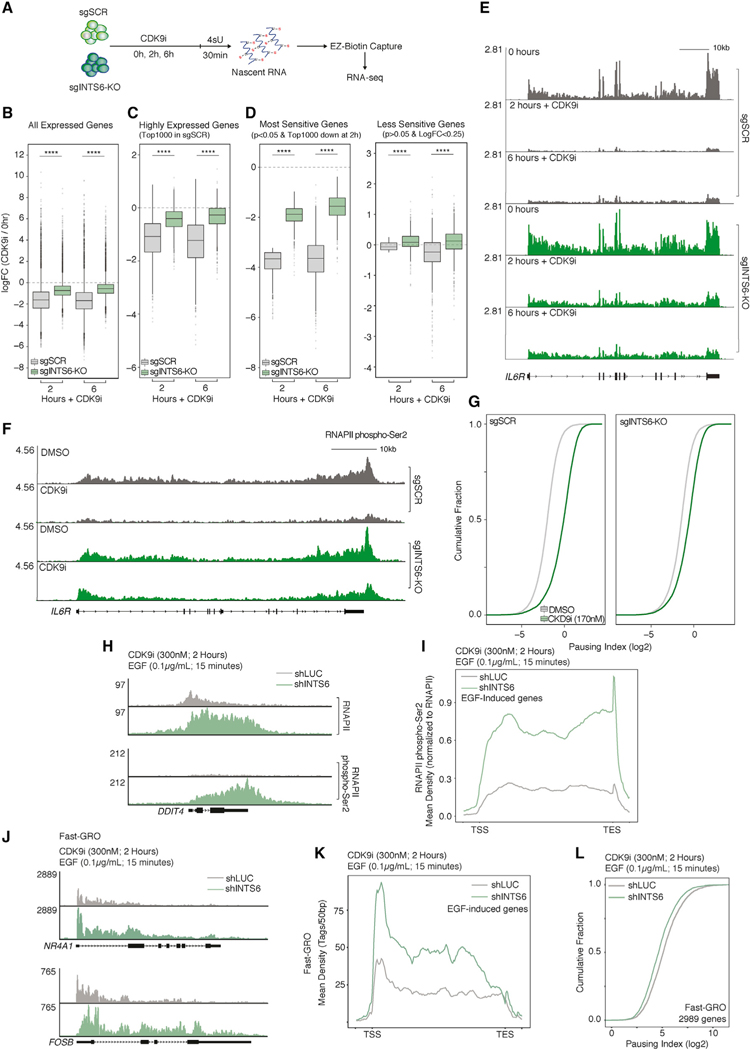
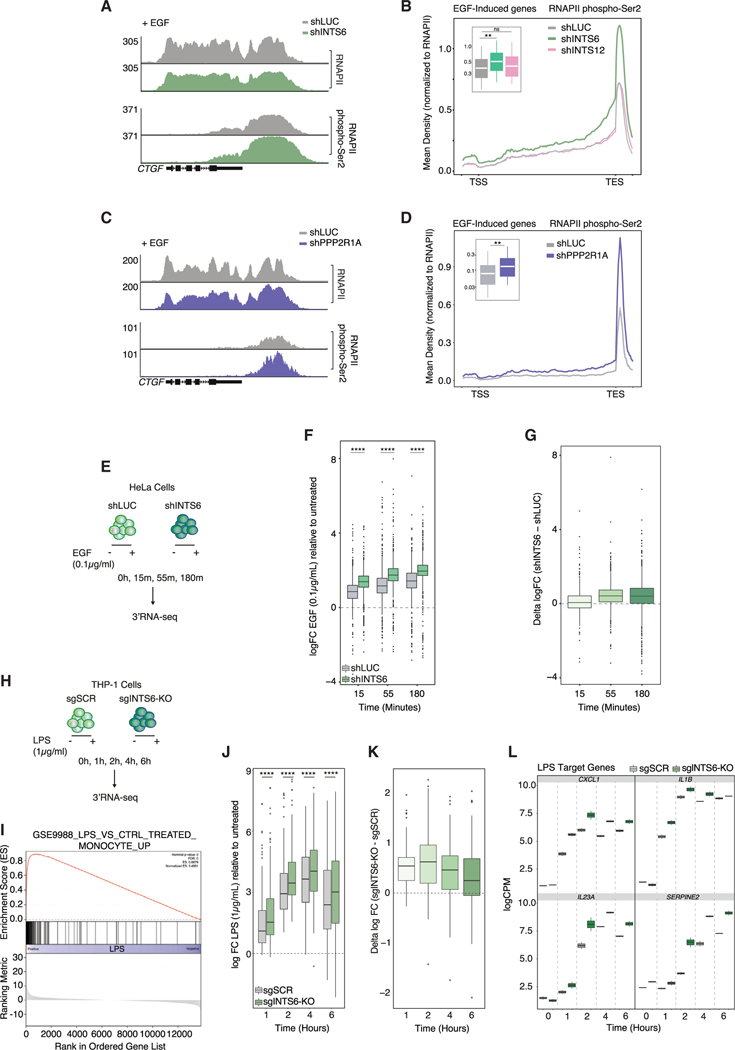
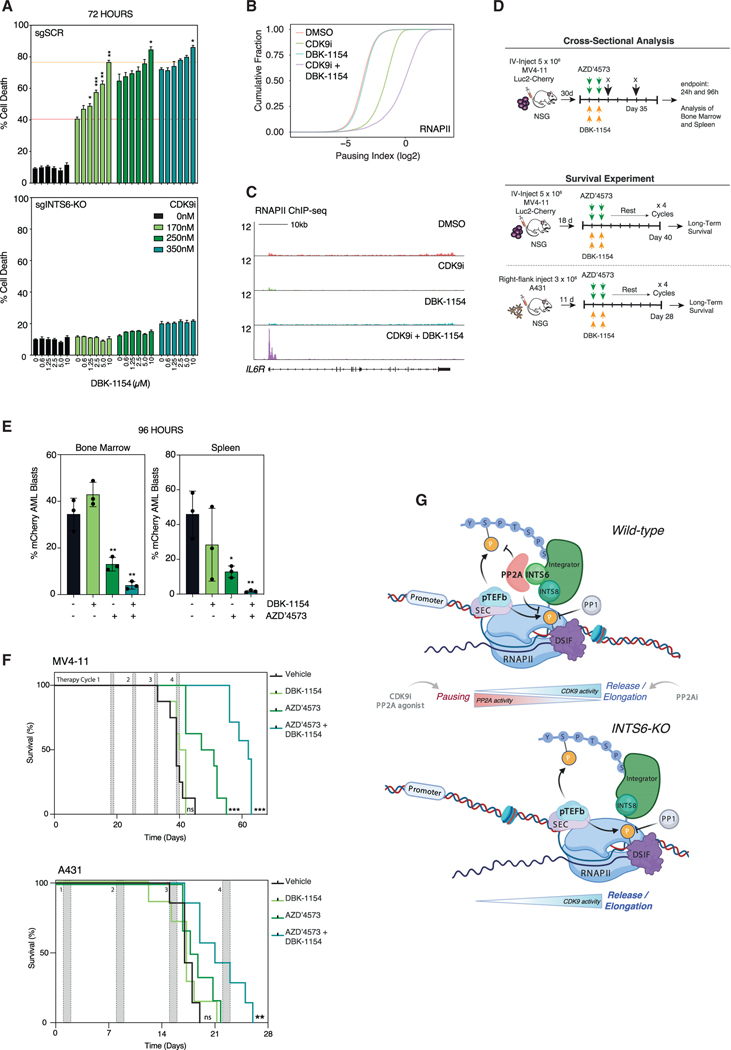
Gene expression by RNA polymerase II (RNAPII) is tightly controlled by cyclin-dependent kinases (CDKs) at discrete checkpoints during the transcription cycle. The pausing checkpoint following transcription initiation is primarily controlled by CDK9. We discovered that CDK9-mediated, RNAPII-driven transcription is functionally opposed by a protein phosphatase 2A (PP2A) complex that is recruited to transcription sites by the Integrator complex subunit INTS6. PP2A dynamically antagonizes phosphorylation of key CDK9 substrates including DSIF and RNAPII-CTD. Loss of INTS6 results in resistance to tumor cell death mediated by CDK9 inhibition, decreased turnover of CDK9 phospho-substrates, and amplification of acute oncogenic transcriptional responses. Pharmacological PP2A activation synergizes with CDK9 inhibition to kill both leukemic and solid tumor cells, providing therapeutic benefit in vivo. These data demonstrate that fine control of gene expression relies on the balance between kinase and phosphatase activity throughout the transcription cycle, a process dysregulated in cancer that can be exploited therapeutically.

Keywords: CDK9; CRISPR-Cas9 screen; CTD; Integrator; PP2A; PP2A activation; RNA polymerase II; cancer; pause-release; phosphatase; transcriptional elongation.


Conflict of interest statement

Declaration of interests The Johnstone laboratory receives funding support from Roche, BMS, Astra Zeneca, and MecRx. R.W.J. is a shareholder in MecRx and receives consultancy payments.

Figures

Figure 1.
Figure 1.. Loss of INTS6 confers resistance to CDK9 inhibition
(A) CRISPR-Cas9 genome-wide screens: Cas9-THP-1 and MV4;11 cells were transduced with a genome-wide sgRNA library and cultured with DMSO or CDK9i for 21 days (survival) or 16 h (nascent RNA). (B) Enriched sgRNAs (CDK9i versus untreated; Tend) in THP-1-Cas9 survival screens using different CDK9 inhibitors (left) and sgRNA libraries (right), adjusted p value <0.1 for >3 sgRNAs. (C) Enriched sgRNAs for THP-1-Cas9 nascent RNA screens (significance relative to T0). (D) Enrichment of INTS6 targeting sgRNAs in CDK9i-treated THP-1-Cas9 cells. (E) Comparison of enriched sgRNAs for nascent RNA and survival screens. (F) Competitive proliferation assays for (H) and (L); cells expressing Cas9 and GFP/BFP-sgRNAs were mixed 1:1 and cultured with DMSO or under selective pressure. (G and H) Western blot (G) and competitive proliferation assay (H) for THP-1-Cas9 cells expressing indicated sgRNAs and treated as indicated. (I) Annexin-V analysis of THP-1-Cas9 cells expressing indicated sgRNAs. (J) Schematic of analog-sensitive (AS) mutant CDK9 (CDK9AS/AS) bound by the inhibitory ATP analog 1-NA-PP1. (K) Competitive proliferation assay for THP1 CDK9AS/AS cells expressing CFP-Cas9/sgSCR or mCherry(CH)-Cas9/sgINTS6 treated with 1-NA-PP1. (L) Competitive proliferation assay for THP-1-Cas9 cells expressing indicated sgRNAs treated with indicated CDK inhibitors. (M) Competitive proliferation assay for HeLa cells expressing CFP-Cas9/sgSCR or CH-Cas9/sgINTS6 treated with CDK9i. (N) Western blot of HeLa cells expressing sgSCR or sgINTS6 (mixed) treated with CDK9i. (O and P) Competitive proliferation assay for (O) MM1.S and (P) HS5 cells expressing CFP-Cas9/sgSCR or CH-Cas9/sgINTS6 treated with CDK9i. (Q) Annexin-V analysis of D. melanogaster S2-Cas9 expressing SCR or IntS6 sgRNAs. Blue dots (C and E) represent nominal p value <0.01. (G)–(I), (K)–(N), and (Q) are representative of 3 experiments. (O) and (P) are representative of 2 experiments. (H), (I), (K)–(M), and (Q) were analyzed by 2-way ANOVA, **p < 0.01, ***p < 0.001, ****p < 0.0001. See also Figure S1 and Table S1.
Figure 2.
Figure 2.. INTS6 bridges the interaction between Integrator and PP2A
(A) Log10 iBAQ protein scores for INTS6 IP mass spectrometry (MS) experiments in THP-1 versus MV4;11 cells (filtered for isotype-control). (B) Log10 iBAQ proteins scores for INTS6 versus PP2A-C IP MS experiments from HeLa nuclear extract. (C) Protein-protein interaction network of INTS6, RNAPII, and PP2A interaction partners identified in THP-1, MV4;11, and HeLa INTS6 IPs. (D and E) CoIP western blot of (D) endogenous V5-tagged PPP2R1A IP in THP-1 cells and (E) endogenous PP2A-C, INTS3, and INTS11 IPs in HeLa cell nuclear extract. (F) Log10 iBAQ proteins scores for PP2A-C IP MS experiments from shLUC versus shINTS6 HeLa cell chromatin extract. (G and H) PP2A-C coIP western blot in (G) shLUC-, shINTS5-, shINTS6-, shINTS8-, and shINTS12-infected HeLa cell nuclear extract, and (H) THP-1-Cas9 sgSCR/INTS6-KO cells. (I) Relative expression of misprocessed UsnRNA from shLUC-, shINTS6-, shINTS8-, or shINTS2-infected HeLa cells, normalized to 18S ribosomal RNA. GUSB is used as control mRNA. (J) Glycerol gradient fractions of nuclear extracts from shLUC-, shINTS6-, shINTS8-, or shINTS2-infected HeLa cells. IP MS experiments are representative of 3 (THP-1) or 2 (HeLa, MV4;11) experiments. Western blots are representative of 3 experiments. qPCR was analyzed by one-way ANOVA with Tukey’s HSD post hoc test, ****p < 0.0001. See also Figure S2.
Figure 3.
Figure 3.. INTS6-dependent dynamic recruitment of PP2A at actively transcribed genes
(A and B) (A) Average TSS ChIP-seq profiles, metagene occupancy heatmaps and (B) representative ChIP-seq signal (FUT4 locus) for indicated proteins in THP-1 cells treated with CDK9i for 2 h. (C) Representative RNAPII and PPP2R1A ChIP signal (BTG2 locus) in THP-1 cells treated with LPS for 3 h. (D and E) Average gene profiles for (D) RNAPII and (E) PPP2R1A ChIP-seq at LPS-induced genes (n = 35) in THP-1 cells treated as per (C). (F) PPP2R1A ChIP-seq coverage at LPS-induced genes under indicated conditions. (G) Representative ChIP-seq signal (CTGF locus) for indicated proteins in HeLa cells treated with EGF (0.1 μg/mL; 15 min). INTS11 ChIP-seq tracks from Gardini et al. (2014). (H and I) Average ChIP-seq profiles for (H) RNAPII and (I). PPP2R1A at EGF-induced genes (n = 50) in HeLa cells treated as per (G). (J and K) (J) Average PPP2R1A ChIP-seq profile and (K) RNAPII-normalized PPP2R1A ChIP-seq coverage at PP2A-occupied genes (n = 1398, defined in S3F) in HeLa cells treated with 10 μM SMAP for 2 h. (L) Average ChIP-seq profile for PP2A-C at EGF-induced genes in HeLa cells treated with EGF. (M and N) (M) Average PPP2R1A ChIP-seq profile and N. RNAPII-normalized PPP2R1A ChIP-seq coverage at PP2A-occupied genes in shLUC- and shINTS6-infected HeLa cells. (O) Representative PPP2R1A ChIP-seq signal (CITED4 locus) in shLUC- and shINTS6-infected HeLa. (F), (K), and (N) were analyzed by unpaired, two-sided Student’s t test, **p < 0.01, ***p < 0.001, ****p < 0.0001.
Figure 4.
Figure 4.. Loss of INTS6/PP2A results in decreased turnover of CDK9 substrates
(A) Phosphorylation studies in THP-1-Cas9 sgSCR/sgINTS6-KO cells. (B) RNAPII CTD reverse phase protein array (RPPA): log fold change in relative fluorescence intensity for indicated antibodies in CDK9i-treated versus untreated THP-1-Cas9 sgSCR/sgINTS6-KO cells. (C) Heatmap of phospho-peptide Z scores in THP-1-Cas9 sgSCR/sgINTS6-KO cells treated for 2 h, p value <0.05. Differentially phosphorylated. (D and E) (D) SUPT5H and (E) POL2RA peptides in THP-1-Cas9 sgSCR/sgINTS6-KO cells treated for 2 h. (F) Western blot of THP-1-Cas9 sgSCR/sgINTS6-KO cells treated as indicated for 2 h. (G) Western blot of THP-1 CDK9AS/AS sgSCR/sgINTS6 cells treated with 1-NA-PP1 for 2 h. (H) In vitro recombinant kinase/phosphatase assay; recombinant RNAPII CTD peptide was incubated with ATP, CDK9/cyclinT1, and/or PP2A as indicated for 30 min. (I) ADPGlo assay (left) and quantitation of ATP to ADP conversion by recombinant CDK9/cyclin T1 incubated with recombinant RNAPII CTD peptide, PP2A, and/or CDK9i as indicated for 30 min. (J) Western blot of THP-1 cells treated as indicated (15 min pre-treatment with Phendione; CDK9i, 2 h). 3 (RPPA) and 10 (phospho-peptide MS) biological replicates were analyzed. Western blots are representative of 3 experiments. (I) represents the mean ± SEM of 3 experiments. For (F) and (G), TUBULIN (#) is representative of individual blots for phospho-CTD and phospho-SPT5 sites. RPPA was analyzed using Welch unpaired t test and ADPGlo assay was analyzed using an unpaired student’s test, *p < 0.05, **p < 0.01. See also Figure S4 and Table S2.
Figure 5.
Figure 5.. INTS6/PP2A loss overrides CDK9i-induced transcriptional pausing
(A) 4sU labeling and analysis of nascent transcription in THP-1-Cas9 sgSCR/sgINTS6-KO cells. (B–D) Log fold change in 4sU-seq signal (CPM; CDK9i versus untreated) in THP-1-Cas9 sgSCR/sgINTS6-KO cells for (B) all expressed, (C) highly expressed (top 1,000; untreated sgSCR cells), and (D) the most and least sensitive genes to CDK9i. (E) 4sU-seq signal (IL6R locus) under indicated conditions. (F) RNAPII pS2 ChIP-seq signal (IL6R locus) in THP-1-Cas9 sgSCR/sgINTS6-KO cells treated for 2 h. (G) Pausing index in THP-1-Cas9 sgSCR/sgINTS6-KO cells treated for 2 h. (H) RNAPII and RNAPII pS2 ChIP-seq signal (DDIT4 locus) in shLUC- and shINTS6-infected HeLa cells treated with CDK9i and EGF. (I) Average RNAPII pS2 ChIP-seq profile under the same conditions at EGF-response genes (n = 50). (J) Fast-GRO signal (FOSB locus) in shLUC or shINTS6 infected HeLa cells treated with CDK9i and EGF. (K) Average Fast-GRO signal across EGF response genes. (L) Fast-GRO pausing index for CDK9i-treated shLUC- and shINTS6-infected HeLa cells at highest-expressed genes. (B)–(D) were analyzed by unpaired, two-sided Student’s t test, ****p < 0.0001. See also Figure S5.
Figure 6.
Figure 6.. The INTS6/PP2A axis fine-tunes acute transcriptional responses
(A and B) (A) RNAPII and RNAPII pS2 ChIP-seq signal (CTGF locus), and (B) average RNAPII pS2 ChIP-seq profile at EGF-response genes (n = 50) in shLUC-, shINTS6-, and shINTS12-infected HeLa cells after EGF treatment, with quantification of the total RNAPII-normalized pS2 ChIP-seq coverage. (C and D) (C) RNAPII and RNAPII pS2 ChIP-seq signal (CTGF locus), and (D) average RNAPII pS2 ChIP-seq profile at EGF-response genes in shLUC- and shPPP2R1A-infected HeLa cells after EGF treatment, with quantification of the total RNAPII-normalized pS2 ChIP-seq coverage. (E) Acute EGF stimulation of shLUC- and shINTS6-infected HeLa cells. (F) Log fold change (CPM) in EGF-treated versus untreated shLUC- and shINTS6-infected HeLa cells. (G) Log fold change difference between shLUC- and shINTS6-infected HeLa cells (EGF versus untreated). (H) Acute LPS stimulation of THP-1-Cas9 sgSCR/sgINTS6-KO cells. (I) GSEA profile of THP-1-Cas sgSCR cells treated with LPS for 2 h. (J) Log fold change (CPM) in LPS-treated versus untreated THP-1-Cas9 sgSCR and sgINTS6-KO cells. (K) Log fold change difference between THP-1-Cas9 sgINTS6-KO and sgSCR cells (LPS versus untreated). (L) LPS-target gene expression in THP-1-Cas9 sgSCR and sgINTS6-KO cells (LPS versus untreated). (B), (D), (F), and (J) were analyzed by unpaired, two-sided Student’s t test, **p < 0.01, ***p < 0.001, ****p < 0.0001. See also Figure S6.
Figure 7.
Figure 7.. Therapeutic and molecular synergy between PP2A agonist and CDK9i
(A) Annexin-V analysis of THP-1-Cas9 sgSCR and sgINTS6-KO cells treated with CDK9i, DBK-1154, or combination. Orange lines indicate single agent CDK9i activity and maximal synergistic activity with DBK-1154. (B) RNAPII ChIP-seq pausing index in THP-1 cells treated with CDK9i (170 nM, 2 h) with/without 15 min pre-treatment with DBK-1154 (10 μM). (C) Representative RNAPII ChIP-seq signal (IL6R) locus under the same conditions as (B). (D) Schematic of in vivo cross-sectional analysis and survival experiments. (E) Quantitation of mCherry-positive AML blasts in bone marrow and spleen post-therapy. (F) Kaplan-Meier survival curves at the conclusion of 4 rounds of therapy for MV4–11 and A431 tumor models. 1 mouse in the MV4–11 cohort (combination group) and 1 mouse in the A431 cohort (AZD′4573 group) were censored due to acute toxicity. (G) Schematic of Integrator/PP2A/CDK9 axis. (A) represents the mean ± SEM of 3 experiments, (E) represents the mean ± SD of 3 mice/group, and (F) represents 8 (MV4–11) or 7 (A431) mice per group. (A) was analyzed by 2-way ANOVA, (E) was analyzed by Student’s t-test, and (F) was analyzed by log-rank (Mantel-Cox) test, *p < 0.05, **p < 0.01, ***p < 0.001. See also Figure S7.

References

    1. Adelman K, and Lis JT (2012). Promoter-proximal pausing of RNA polymerase II: emerging roles in metazoans. Nat. Rev. Genet 13, 720–731. - PMC - PubMed
    1. Akama-Garren EH, Joshi NS, Tammela T, Chang GP, Wagner BL, Lee DY, Rideout WM 3rd, Papagiannakopoulos T, Xue W, and Jacks T. (2016). A Modular Assembly Platform for Rapid Generation of DNA Constructs. Sci. Rep 6, 16836. - PMC - PubMed
    1. Amit I, Citri A, Shay T, Lu Y, Katz M, Zhang F, Tarcic G, Siwak D, Lahad J, Jacob-Hirsch J, et al. (2007). A module of negative feedback regulators defines growth factor signaling. Nat. Genet 39, 503–512. - PubMed
    1. Aubrey BJ, Kelly GL, Kueh AJ, Brennan MS, O’Connor L, Milla L, Wilcox S, Tai L, Strasser A, and Herold MJ (2015). An inducible lentiviral guide RNA platform enables the identification of tumor-essential genes and tumor-promoting mutations in vivo. Cell Rep. 10, 1422–1432. - PubMed
    1. Avni D, Yang H, Martelli F, Hofmann F, ElShamy WM, Ganesan S, Scully R, and Livingston DM (2003). Active localization of the retinoblastoma protein in chromatin and its response to S phase DNA damage. Mol. Cell 12, 735–746. - PubMed

Publication types

MeSH terms