. 2021 Dec;18(12):2466-2479.
doi: 10.1080/15476286.2021.1925477. Epub 2021 May 19.

Structural model of the M7G46 Methyltransferase TrmB in complex with tRNA

Affiliations

Structural model of the M7G46 Methyltransferase TrmB in complex with tRNA

Katharina F Blersch et al. RNA Biol. 2021 Dec.

Abstract

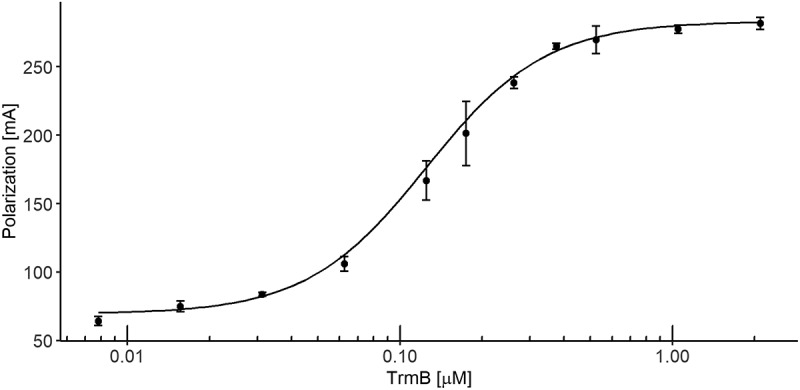
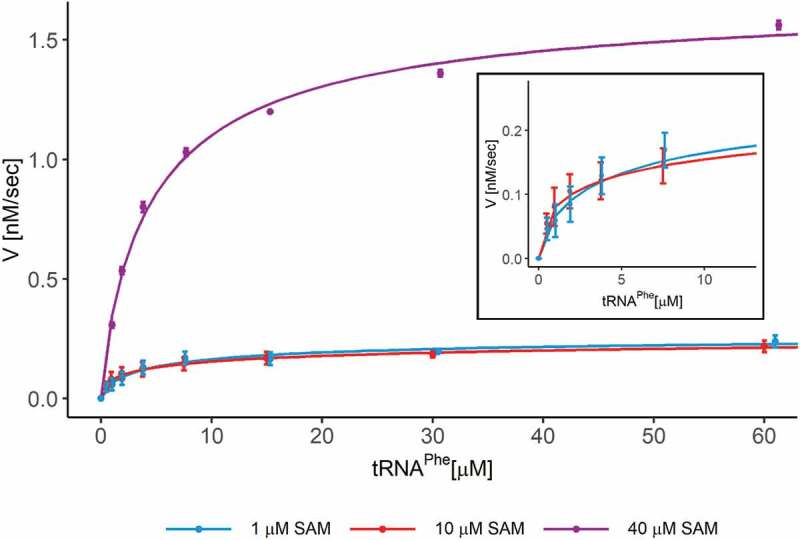
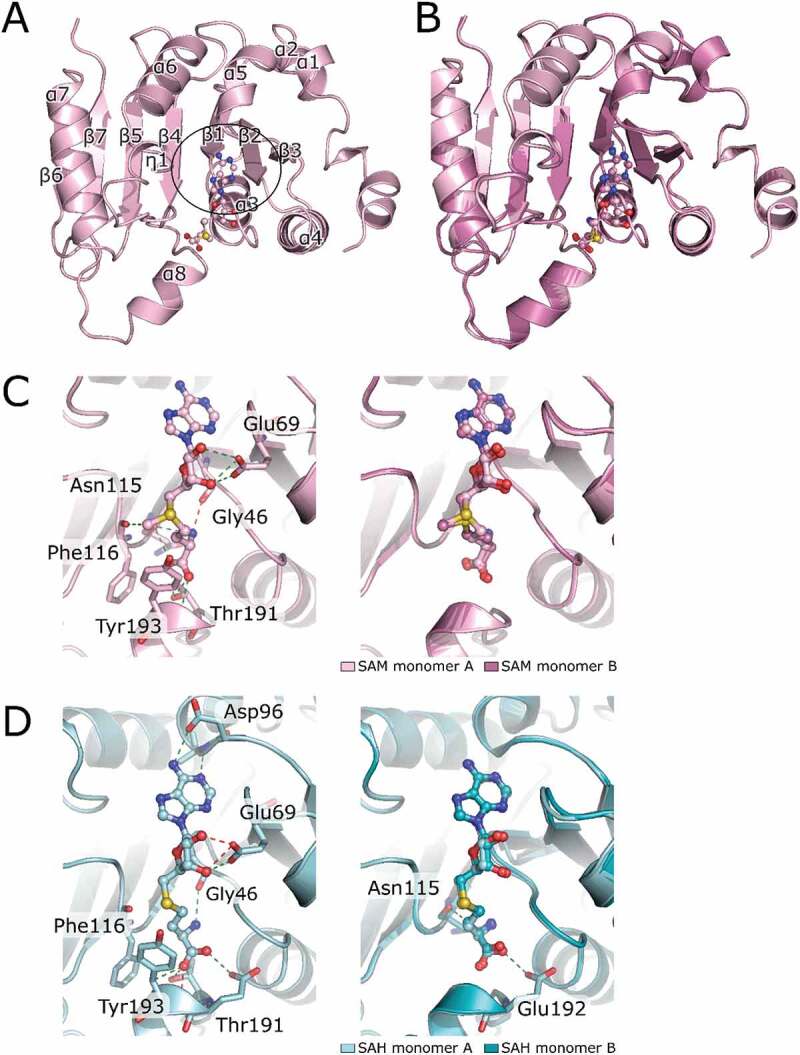
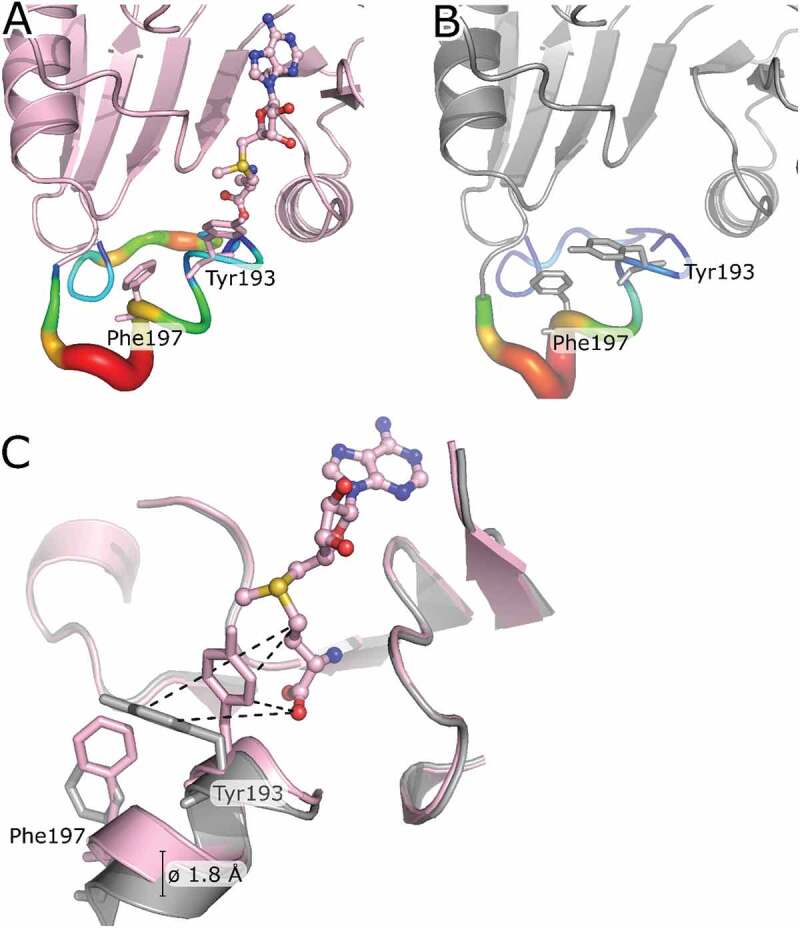
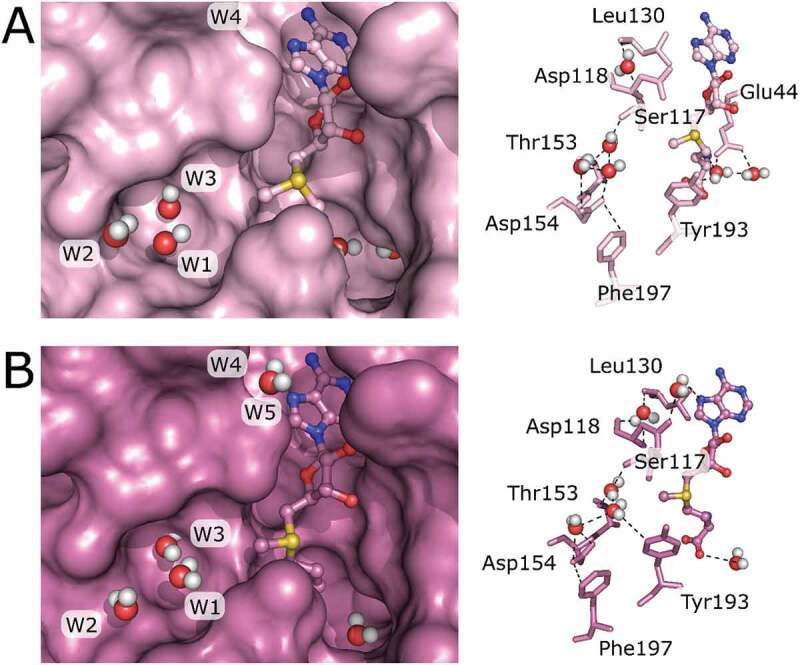
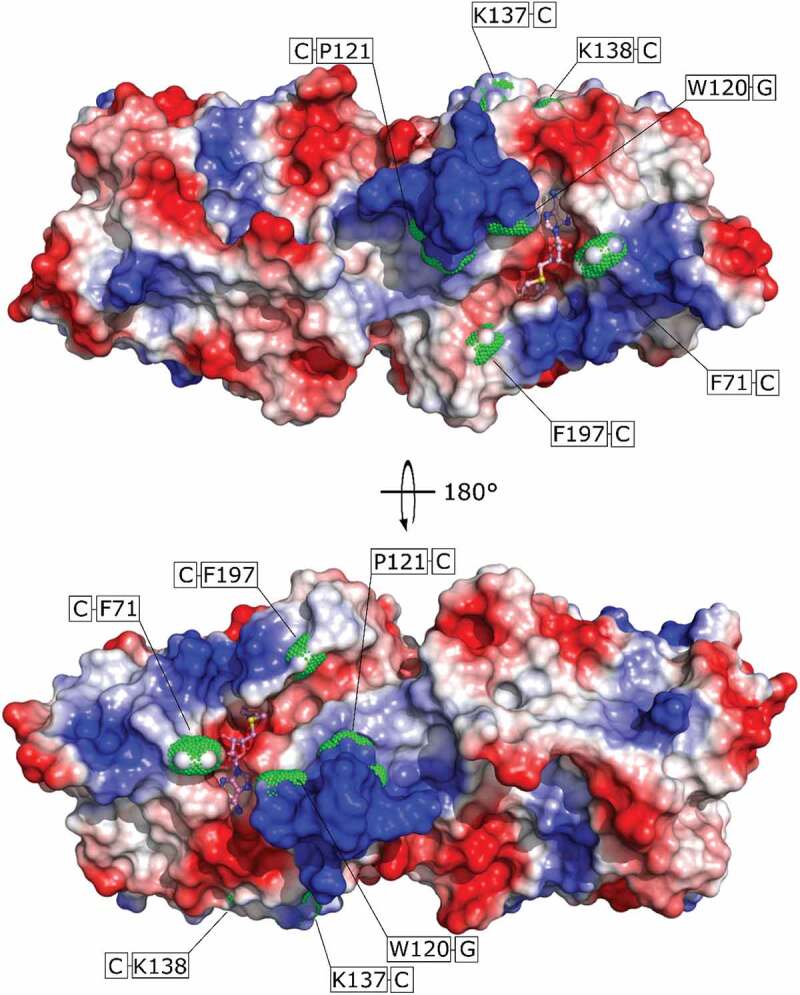
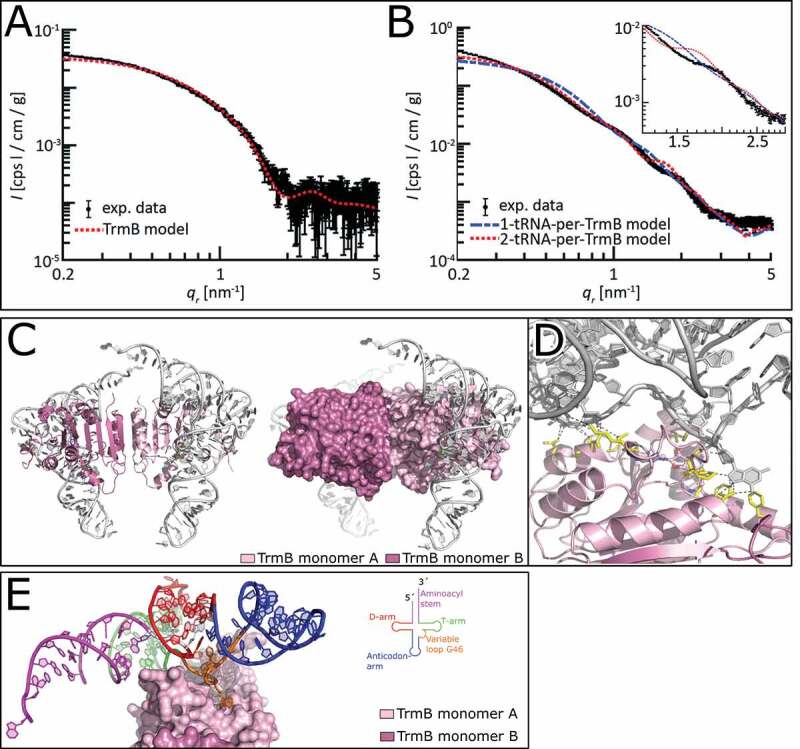
TrmB belongs to the class I S-adenosylmethionine (SAM)-dependent methyltransferases (MTases) and introduces a methyl group to guanine at position 7 (m7G) in tRNA. In tRNAs m7G is most frequently found at position 46 in the variable loop and forms a tertiary base pair with C13 and U22, introducing a positive charge at G46. The TrmB/Trm8 enzyme family is structurally diverse, as TrmB proteins exist in a monomeric, homodimeric, and heterodimeric form. So far, the exact enzymatic mechanism, as well as the tRNA-TrmB crystal structure is not known. Here we present the first crystal structures of B. subtilis TrmB in complex with SAM and SAH. The crystal structures of TrmB apo and in complex with SAM and SAH have been determined by X-ray crystallography to 1.9 Å (apo), 2.5 Å (SAM), and 3.1 Å (SAH). The obtained crystal structures revealed Tyr193 to be important during SAM binding and MTase activity. Applying fluorescence polarization, the dissociation constant Kd of TrmB and tRNAPhe was determined to be 0.12 µM ± 0.002 µM. Luminescence-based methyltransferase activity assays revealed cooperative effects during TrmB catalysis with half-of-the-site reactivity at physiological SAM concentrations. Structural data retrieved from small-angle x-ray scattering (SAXS), mass-spectrometry of cross-linked complexes, and molecular docking experiments led to the determination of the TrmB-tRNAPhe complex structure.

Keywords: 7-methylguanosine; Trna modification; m7G; trm8; trmb.


Figures

Figure 1.
Figure 1.
Quantitative analysis of wt bsTrmB tRNAPhe complex formation measured by fluorescence polarization. The fluorescently labelled tRNAPhe was analysed within increasing bsTrmB concentration, in the range of 0.007 to 2.1 µM. Complex formation was observed with fluorescence polarization. Measurements were performed in three indepentend experimental replicates. Results are shown as mean ± SD with error bars of SD (n = 3). tRNAPhe binds to TrmB in the nanomolar range of 0.12 µM ± 0.002 µM. Data were plotted with R [27]
Figure 2.
Figure 2.
Methyltransferase assay of wt bsTrmB with varying SAM concentrations to analyse cooperativity. Methyltransferase assay was performed according to the Promega MTase-Glo assay and measured via luminescence. Cooperativity of the TrmB subunits was tested with increasing concentrations of SAM in the range of 1–40 µM (1 µM SAM in blue, 10 µM SAM in red, and 40 µM in lilac). The colour code is identical between main plot and inset. Measurements were performed as independent duplicates with increasing substrate concentrations from 0 to 60 µM tRNAPhe. Data were plotted using R [27] and fitted with the Hill equation, errors are presented as standard deviation. TrmB methylated tRNAPhe with a Vmax of 1.7 nM/s ± 0.09 nM/s, a Km of 4.8 µM ± 0.8 µM, and a Hill coefficient of n = 0.8. Lowering SAM concentrations led to a decrease in the Hill coefficient from n = 0.8 (40 µM SAM) to n = 0.4 (10 µM SAM) and n = 0.5 (1 µM SAM)
Figure 3.
Figure 3.
Crystal structures of SAM and SAH bound to bsTrmB. (A) TrmB subunit A is represented as cartoon with annotated secondary elements. SAM is shown as ball and stick model, central switch point is highlighted by the black circle. (B) superposition of TrmB monomer A (light pink) and monomer B (dark pink) represented in cartoon mode, SAM is shown as ball and stick. the crystal structure was determined to 2.5 Å. (C) close-up view of the ligand binding sites of TrmB monomer A (left) and superposition of both (right) complexed with SAM. Ligand interacting residues are shown in sticks and interactions are marked as dashed lines. (D) close up view of the SAH-TrmB complex structure. bsTrmB is depicted as cartoon (light cyan (monomer A, left) and superposition of both (right)). the soaked S-Adenosyl-L-homocysteine is depicted in ball and stick mode. SAH coordinating residues are shown as sticks and hydrogen bonds as dashed lines. the crystal structure was determined at 3.1 Å. hydrogen bonds are colour coded for 2.2–2.8 Å (red) and 2.8–3.2 Å (green)
Figure 4.
Figure 4.
Structural rearrangement of the bsTrmB active site upon ligand binding. (A) TrmB (monomer A, light pink) is shown as cartoon, the bound SAM is represented as ball and stick model. Local B-factors are ramp coloured from blue to red representing regions of low and high flexibility, respectively. Tyr193 and Phe197 are shown as sticks. (B) apo TrmB (monomer A, grey) is shown as cartoon. Local B-factors are ramp coloured from blue to red representing regions of low and high flexibility, respectively. Tyr193 and Phe197 are shown as sticks. (C) Superposition of TrmB-SAM and apo TrmB. Tyr193 and Phe197 are depicted as sticks and the residue movement upon ligand binding is shown as dashed lines. Average displacement of cα of helix 8 is about 1.8 Å
Figure 5.
Figure 5.
Structurally conserved water molecules in TrmB crystal structures mapped on the TrmB-SAM structure. (A) Monomer A of the TrmB-SAM complex structure is shown in surface mode (left). SAM is shown as ball and stick model and water as spheres. Water coordinating residues are represented as sticks (right), water is shown as spheres, and hydrogen bonds are shown as dashed lines. (B) Monomer B of the TrmB-SAM crystal structure shows TrmB in surface representation (left). SAM is shown as bal and stick model. Water molecules are represented as spheres. Water coordinating residues (right) are shown as sticks, water as spheres and hydrogen bonds as dashed lines
Figure 6.
Figure 6.
UV-Cross linking of TrmB to tRNAPhe. Surface representation of TrmB, electrostatic potential is depicted at a contour level of ± 7 kBT/e. SAM is shown in ball and stick mode. Residues cross-linked to tRNAPhe are shown as green dots. Covalent links are mapped on the protein surface and shown in green boxes
Figure 7.
Figure 7.
Predicted TrmB – tRNAPhe complex model. (A) Experimental and simulated SAXS curves of TrmB. The curve of the model is calculated from the TrmB-SAM complex crystal structure and scaled to match the experimental curve between 0.1 ≤ qr ≤ 2 nm−1. (B) Experimental SAXS curves and predicted SAXS curves from docking models. The model consisting of two tRNA molecules per TrmB homodimer (red, dotted) shows a higher agreement with the experimental data compared to the model consisting of one tRNA molecule per TrmB (blue, dashed), also seen at larger qr-values. The feature of the experimental data at qr~2.0 nm−1 is shifted to smaller qr-values in the 2-tRNA model and is not visible in the 1-tRNA model (inset). The data is plotted with Matlab (MathWorks Inc. Natick, Massachusetts, USA). (C) TrmB – tRNAPhe complex model is depicted as cartoon (left) with surface representation of TrmB (right). (D) Close-up view of the tRNA binding to TrmB monomer A (light pink). Residues of TrmB interacting with tRNAPhe are shown as sticks (yellow), hydrogen bonds are shown as dashed line. (E) TrmB-tRNAPhe complex model is shown with surface representation of TrmB and tRNAPhe highlighted by its domain architecture. the domain architecture of tRNAPhe is colour coded in Aminoacyl stem (purple), T-arm (green), variable loop (orange), Aminoacyl stem (blue), and D-arm (red) with the G46 base depicted as sticks

Similar articles

Cited by

References

    1. Boccaletto P, Machnicka MA, Purta E, et al. MODOMICS: a database of RNA modification pathways. 2017 update. Nucleic Acids Res. 2018. Jan;46(D1):D303–D307. - PMC - PubMed
    1. Juhling F, Morl M, Hartmann RK, et al. tRNAdb 2009: compilation of tRNA sequences and tRNA genes. Nucleic Acids Res. 2009. Jan;37(Database):D159–D162. - PMC - PubMed
    1. Machnicka MA, Milanowska K, Osman Oglou O, et al. MODOMICS: a database of RNA modification pathways—2013 update. Nucleic Acids Res. 2012. Oct;41(D1):D262–D267. - PMC - PubMed
    1. Wang K-T, Desmolaize B, Nan J, et al. Structure of the bifunctional methyltransferase YcbY (RlmKL) that adds the m 7 G2069 and m 2 G2445 modifications in Escherichia coli 23S rRNA. Nucleic Acids Res. 2012. Jun.;40(11):5138–5148. - PMC - PubMed
    1. Okamoto S, Tamaru A, Nakajima C, et al. Loss of a conserved 7-methylguanosine modification in 16S rRNA confers low-level streptomycin resistance in bacteria. Mol Microbiol. 2007. Feb.;63(4):1096–1106. - PubMed

Publication types

MeSH terms

LinkOut - more resources