. 2021 Dec;17(12):4341-4362.
doi: 10.1080/15548627.2021.1916194. Epub 2021 May 19.

FOXG1 promotes aging inner ear hair cell survival through activation of the autophagy pathway

Affiliations

FOXG1 promotes aging inner ear hair cell survival through activation of the autophagy pathway

Zu-Hong He et al. Autophagy. 2021 Dec.

Abstract

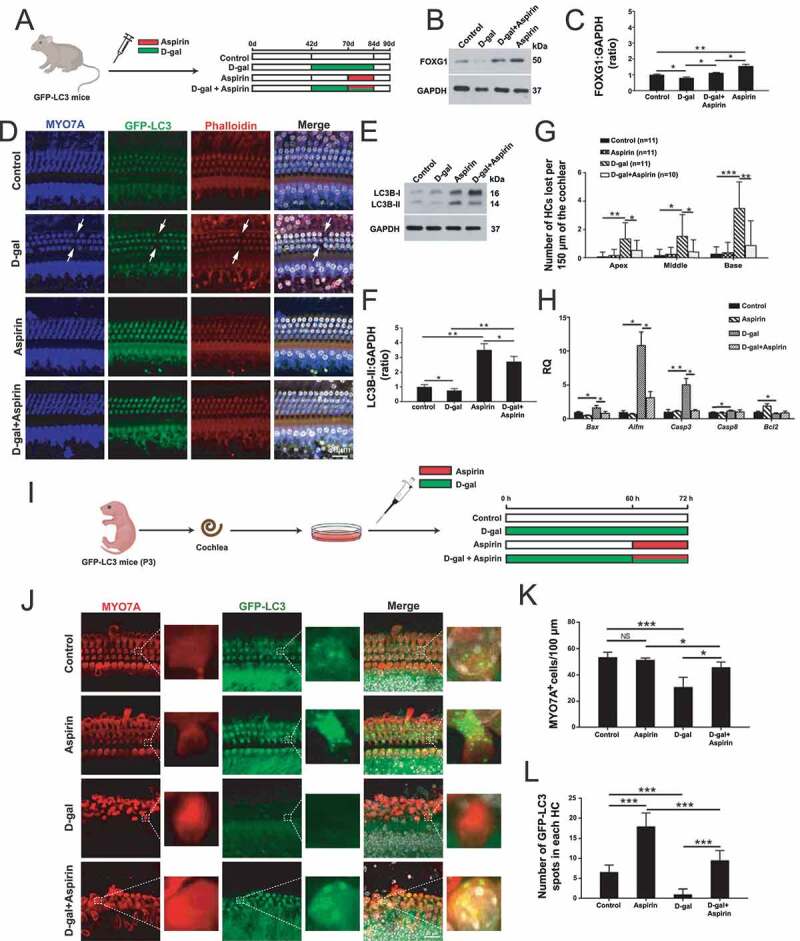
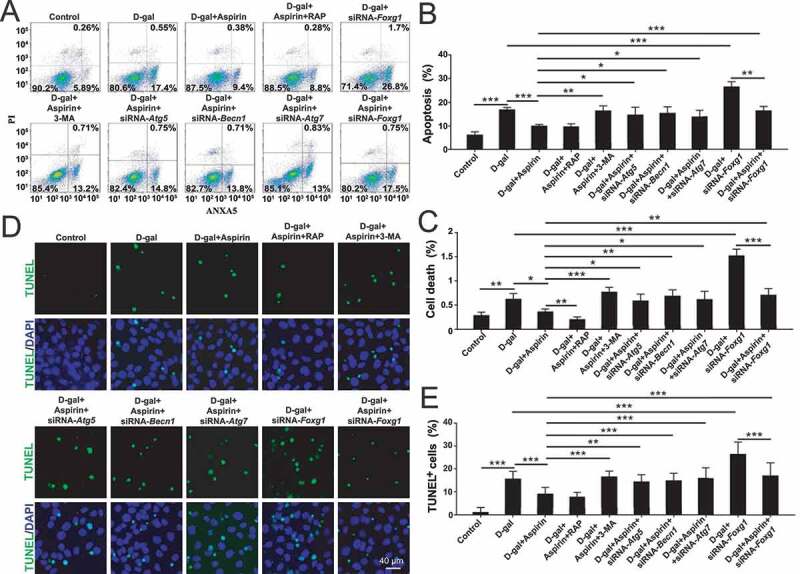
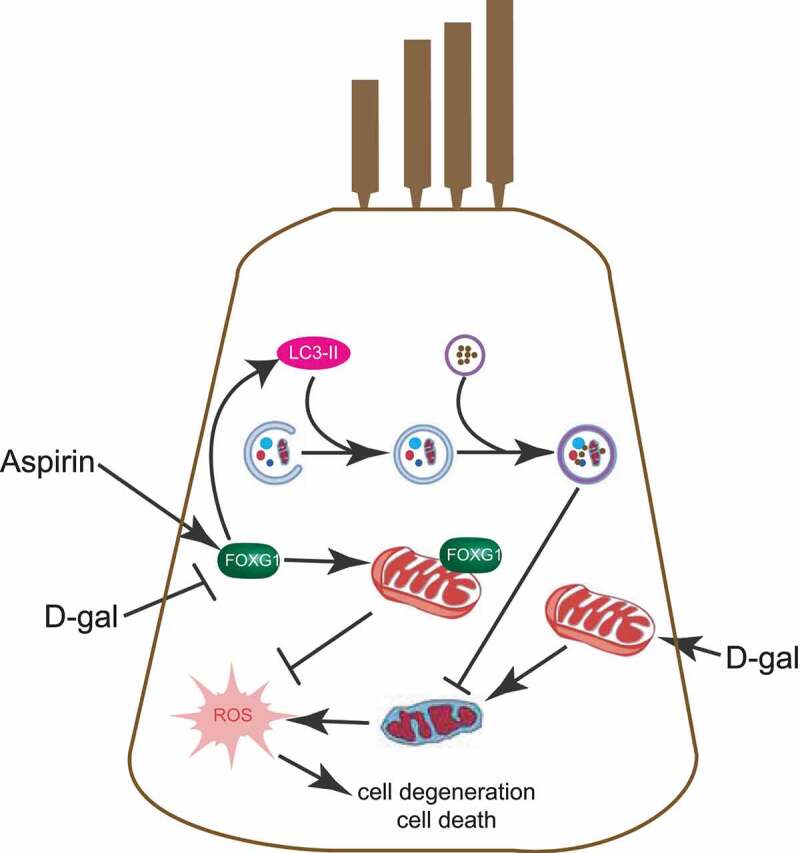
Presbycusis is the cumulative effect of aging on hearing. Recent studies have shown that common mitochondrial gene deletions are closely related to deafness caused by degenerative changes in the auditory system, and some of these nuclear factors are proposed to participate in the regulation of mitochondrial function. However, the detailed mechanisms involved in age-related degeneration of the auditory systems have not yet been fully elucidated. In this study, we found that FOXG1 plays an important role in the auditory degeneration process through regulation of macroautophagy/autophagy. Inhibition of FOXG1 decreased the autophagy activity and led to the accumulation of reactive oxygen species and subsequent apoptosis of cochlear hair cells. Recent clinical studies have found that aspirin plays important roles in the prevention and treatment of various diseases by regulating autophagy and mitochondria function. In this study, we found that aspirin increased the expression of FOXG1, which further activated autophagy and reduced the production of reactive oxygen species and inhibited apoptosis, and thus promoted the survival of mimetic aging HCs and HC-like OC-1 cells. This study demonstrates the regulatory function of the FOXG1 transcription factor through the autophagy pathway during hair cell degeneration in presbycusis, and it provides a new molecular approach for the treatment of age-related hearing loss.Abbreviations: AHL: age-related hearing loss; baf: bafilomycin A1; CD: common deletion; D-gal: D-galactose; GO: glucose oxidase; HC: hair cells; mtDNA: mitochondrial DNA; RAP: rapamycin; ROS: reactive oxygen species; TMRE: tetramethylrhodamine, ethyl ester.

Keywords: Aging-related hearing loss; FOXG1; ROS; autophagy; hair cell.


Conflict of interest statement

The authors declare no competing financial interests.

Figures

Figure 1.
Figure 1.
Changes in FOXG1 in the central auditory, peripheral auditory organs and OC-1 cells after D-gal treatment. (A) Rats were injected with D-gal or saline. (B) Western blot showing the changes in FOXG1 expression in the cortex at 0 months after the last D-gal injection, n = 3. (C) Quantification of the western blot in B. (D) Western blot showing the changes in FOXG1 expression in the cortex at 12 months after the last D-gal injection, n = 3. (C) Quantification of the western blot in D. (F) Western blot showing the changes in FOXG1 expression in the hippocampus at 0 months after the last D-gal injection, n = 3. (G) Quantification of the western blot in F. (H) Western blot showing the changes in FOXG1 expression in the hippocampus at 12 months after the last D-gal injection, n = 3. (I) Quantification of the western blot in H. (J) Western blot showing the changes in FOXG1 expression in the cochlea at 0 month after the last D-gal injection, n = 3. (K) Quantification of the western blot in J. (L) Western blot showing the changes in FOXG1 expression in the cochlea at 12 months after the last D-gal injection, n = 3. (M) Quantification of the western blot in L. (N) Western blot showing the changes in FOXG1 expression in the cochlea at 24 months after the last D-gal injection, n = 3. (O) Quantification of the western blot in N. (P) Western blot showing the changes in FOXG1 expression in the cochlea at 0 months, 12 months, and 24 months after the last D-gal injection, n = 3. (Q) Quantification of the western blot in P. (R) OC-1 cells were treated with D-gal. (S) Western blot showing the changes in FOXG1 expression in the OC1 cells after D-gal treatment, n = 5. (T) Quantification of the western blot in S. For all experiments, *p< 0.05, **p< 0.01, ***p< 0.001. NS = not significant
Figure 2.
Figure 2.
Changes in LC3B in the central auditory and peripheral auditory organs at different times after D-gal treatment. (A) Rats were injected with D-gal or saline. (B) Western blot showing the changes in LC3B expression in the cortex at 0 months after the last D-gal injection, n = 3. (C) Quantification of the western blot in B. (D) Western blot showing the changes in LC3B expression in the cortex at 12 months after the last D-gal injection, n = 3. (E) Quantification of the western blot in D. (F) Western blot showing the changes in LC3B expression in the hippocampus at 0 months after the last D-gal injection, n = 3. (G) Quantification of the western blot in F. (H) Western blot showing the changes in LC3B expression in the hippocampus at 12 months after the last D-gal injection, n = 3. (I) Quantification of the western blot in H. (J) Western blot showing the changes in LC3B expression in the cochlea at 0 month after the last D-gal injection, n = 3. (K) Quantification of the western blot in J. (L) Western blot showing the changes in LC3B expression in the cochlea at 12 months after the last D-gal injection, n = 3. (M) Quantification of the western blot in L. (N) Western blot showing the changes in LC3B expression in the cochlea at 24 months after the last D-gal injection, n = 3. (O) Quantification of the western blot in N. (P) Western blot showing the changes in LC3B and SQSTM1/p62 expression in the cochlea at 0 months, 12 months, and 24 months after the last D-gal injection, n = 5. (Q) Quantification of the LC3B expression level in P. (R) Quantification of the SQSTM1/p62 expression level in P. For all experiments, *p < 0.05, **p < 0.01, ***p < 0.001. NS = not significant
Figure 3.
Figure 3.
FOXG1 affects autophagosome formation in OC-1 cells after treatment with D-gal. (A) Western blot showing the changes in LC3B expression in OC-1 cells treated with different concentrations of D-gal for 72 h, n = 5. (B) Quantification of the western blot in A. (C) Transmission electron microscope analysis for evaluating autophagy in OC-1 cells. (D) Quantification of the autophagic vacuoles in C. (E) Quantification of the autolysosomes in C. (F) Cells were transfected with mRFP-GFP-LC3 plasmids and treated with different concentrations of D-gal. Yellow dots indicate autophagosomes and red dots indicate autolysosomes, n = 5. (G) Quantification of autophagosomes in F. (H) Quantification of autolysosomes in F. (I) Western blot showing the changes in LC3B expression in the OC-1 cells after inhibition or activation of autophagy and downregulation of Foxg1 expression following 15 mg/mL D-gal treatment, n = 5. (J) Quantification of the western blot in I. (K) Western blot showing the changes in LC3B expression in the OC-1 cells after inhibition or activation of autophagy and downregulation of Foxg1 expression following 2 mg/mL D-gal treatment, n = 5. (L) Quantification of the western blot in K. For all experiments, *p< 0.05, **p< 0.01, ***p< 0.001. NS = not significant
Figure 4.
Figure 4.
The expression of FOXG1 affects apoptosis in OC1 cells after D-gal treatment. (A) TUNEL and DAPI double staining showing the apoptotic OC-1 cells after different treatments, n = 5. (B) Quantification of the numbers of TUNEL/DAPI double-positive cells in A. (C) qPCR analysis of apoptosis-related gene expression in OC-1 cells, n = 5. (D) Apoptosis analysis by flow cytometry after different treatments, n = 5. (E) The proportions of early apoptotic and dead cells in D. (F) Apoptosis analysis by flow cytometry after different treatments, n = 5. (G) The proportions of early apoptotic and dead cells in F. For the qPCR experiments, the values for the untreated controls were set to 1. For all experiments, *p < 0.05, **p < 0.01, ***p < 0.001
Figure 5.
Figure 5.
The expression of FOXG1 affects oxidative stress in OC1 cells after D-gal treatment. (A) Immunofluorescence staining with Mito-SOX Red in OC-1 cells. (B) qPCR analysis of redox reaction-related gene expression in OC1 cells, n = 5. (C) Analysis of ROS levels by flow cytometry after different treatments, n = 5. (D) Quantification of the data in C. (E) Analysis of ROS levels by flow cytometry after different treatments, n = 5. (F) Quantification of the data in E. For the qPCR experiments, the values for the untreated controls were set to 1. for all experiments, *p < 0.05, **p < 0.01, ***p < 0.001
Figure 6.
Figure 6.
Increased FOXG1 expression and autophagy in cochlear HCs and in vitro-cultured cochleae after aspirin treatment. (A) The mice were injected with D-gal and aspirin. (B) Western blot showing the changes in FOXG1 expression in the HCs after different treatments, n = 5. (C) Quantification of FOXG1 expression in B. (D) Immunofluorescence staining with anti-MYO7A and phalloidin in the cochleae from GFP-LC3 mice. n = 11. (E) Western blot showing the changes in LC3B expression in the HCs after different treatments, n = 5. (F) Quantification of LC3B expression in E. (G) Quantification of the lost HCs in D. (H) qPCR analysis of the apoptosis-related gene expression after D-gal and aspirin treatment, n = 5. (I) The in vitro-cultured cochleae were treated with D-gal and aspirin. (J) Immunofluorescence staining with MYO7A antibody in the cochleae from GFP-LC3 mice, n = 5. (K) Quantification of the MYO7A-positive HCs in J. (L) Quantification of the GFP-LC3 spot number in J. For qPCR experiments, the values for the normal controls were set to 1. for all experiments, *p < 0.05, **p < 0.01, ***p < 0.001. NS = not significant
Figure 7.
Figure 7.
Aspirin treatment promotes the survival of D-gal–induced mimetic aging OC-1 cells through activating FOXG1 expression and autophagy pathway. (A) Western blot showing the changes in FOXG1 expression in the OC-1 cells after treatment with different concentrations of aspirin, n = 5. (B) Quantification of the western blot in A. (C) Seven different aspirin treatment groups in mimetic aging cells induced by D-gal – a) aspirin for 12 h and then D-gal for 72 h, b) D-gal for 72 h and then aspirin for 12 h, c) aspirin and D-gal together for 12 h and then D-gal for 60 h, d) D-gal for 60 h and then D-gal and aspirin together for 12 h, e) D-gal for 24 h and then D-gal and aspirin together for 12 h, and then D-gal again for 36 h, f) aspirin for 12 h and then aspirin and D-gal together for 72 h, and g) aspirin and D-gal together for 72 h. (D) Western blot showing the changes in FOXG1 expression in the OC-1 cells after different treatments, n = 5. (E) Quantification of FOXG1 expression in D. (F) Western blot showing the changes in LC3B expression in the OC-1 cells after different treatments, n = 5. (G) Quantification of LC3B expression in F. (H) Apoptosis analysis by flow cytometry after different treatments, n = 5. (I) The proportions of early apoptotic cells in H. (J) The proportions of dead cells in H. (K) Measurement of the mitochondrial DNA (mtDNA) common deletion (CD) after D-gal and aspirin treatment, n = 5. (L) qPCR analysis of the apoptosis-related gene expression after D-gal and aspirin treatment, n = 5. for qPCR experiments, the values for the normal controls were set to 1. for all experiments, *p < 0.05, **p < 0.01, ***p < 0.001. NS = not significant
Figure 8.
Figure 8.
The effect of FOXG1 and autophagy in the protection of aspirin in D-gal–induced mimetic aging OC-1 cells. (A) Apoptosis analysis by flow cytometry after different treatments, n = 5. (B) The proportions of early apoptotic cells in A. (C) The proportions of dead cells in A. (D) TUNEL and DAPI double staining showing the apoptotic OC1 cells after different treatments, n = 5. (E) Quantification of the numbers of TUNEL/DAPI double-positive cells in D. For all experiments, *p < 0.05, **p < 0.01, ***p < 0.001
Figure 9.
Figure 9.
Aspirin attenuates oxidative stress in cochlea HCs and OC-1 cells after D-gal treatment through activating FOXG1 expression and autophagy pathway. (A) The mice were injected with D-gal and aspirin. (B) Immunofluorescence staining with anti-catalase and anti-MYO7A antibodies in the middle turn of the cochlea after different treatments, n = 5. (C) Western blot analysis with anti-CAT (catalase) antibody after D-gal and aspirin treatment, n = 5. (D) Quantification of the western blot in C. (E) Western blot analysis with anti-catalase antibody and anti-FOXG1 after siRNA-Foxg1 and aspirin treatment, n = 5. (F) Quantification of FOXG1 expression levels in E. (F) Quantification of catalase expression levels in E. (H) qPCR analysis of the catalase gene expression after siRNA-Foxg1 and aspirin treatment, n = 5. (I) OC-1 cells were treated with D-gal and aspirin. (J) Immunofluorescence staining with mito-SOX red in OC-1 cells, n = 5. (K) The results of ROS analysis by flow cytometry after different treatments. (L) Quantification of the data in K. (M) qPCR analysis of redox reaction-related gene expression, n = 5. For qPCR experiments, the values for the normal controls were set to 1. for all experiments, *p < 0.05, **p < 0.01. NS = not significant
Figure 10.
Figure 10.
The effect of FOXG1 on mitophagy and mitochondrial function in D-gal–induced mimetic aging OC-1 cells. (A) Cells were stained with the mitophagy detection kit and treated with siRNA-Foxg1 and different concentrations of D-gal. mitophagy and lysosomes were stained with mtphagy dye (red) and Lyso dye (green), respectively, n = 5. (B) Quantification of mitophagy in A. (C) Western blot analysis with anti- PPARGC1A antibody after different treatments, n = 5. (D) Quantification of PPARGC1A expression levels in C. (E) qPCR analysis of mtDNA copy number representative gene expression, n = 5. (F) The results of mitochondrial membrane potential analysis by flow cytometry after different treatments. (G) Quantification of the data in F. For qPCR experiments, the values for the normal controls were set to 1. for all experiments, *p < 0.05, **p < 0.01, ***p < 0.001. NS = not significant
Figure 11.
Figure 11.
Schematic representation of FOXG1 implicated in the HC aging or survival process after aspirin and D-gal treatment. the figure is representative of some key steps involved in HC degeneration that are known to be regulated by mitochondria and autophagy. FOXG1 plays an important regulatory role in maintaining mitochondrial function and activating autophagy. D-gal induces the mtDNA CD mutation, leading to impaired mitochondrial function and increased ROS. D-gal can also accelerate HC aging by affecting the expression of FOXG1. this aging process can be inhibited by aspirin, and we found that aspirin eliminated the abnormal mitochondria caused by D-gal and inhibited the increase of ROS by activating FOXG1 expression and the autophagy pathway and ultimately inhibiting cell apoptosis and degeneration

References

    1. Huang Q, Tang J.. Age-related hearing loss or presbycusis. Eur Arch Oto-Rhino L: official journal of the European Federation of Oto-Rhino-Laryngological Societies (EUFOS): affiliated with the German Society for Oto-Rhino-Laryngology - Head and Neck Surgery. 2010;267(8):1179. . - PubMed
    1. Č MH, Pegan K, Spes A, et al. Lysosomal pathways to cell death and their therapeutic applications. Exp Cell Res. 2012;318(11):1245–1251. - PubMed
    1. Zerbes RM, Klei IJVD, Veenhuis M, et al. Mitofilin complexes: conserved organizers of mitochondrial membrane architecture. Biol Chem. 2012;393(11):1247–1261. - PubMed
    1. Someya S, Prolla TA.. Mitochondrial oxidative damage and apoptosis in age-related hearing loss. Mech Ageing Dev. 2010;131(7–8):480–486. - PMC - PubMed
    1. Liu XZ, Yan D. Ageing and hearing loss. J Pathol. 2007;211(2):188–197. - PubMed

Publication types

Substances