

The fecal microbiota of patients with pancreatic ductal adenocarcinoma and autoimmune pancreatitis characterized by metagenomic sequencing
- PMID: 34006295
- PMCID: PMC8130326
- DOI: 10.1186/s12967-021-02882-7
The fecal microbiota of patients with pancreatic ductal adenocarcinoma and autoimmune pancreatitis characterized by metagenomic sequencing
Abstract
Background: The fecal microbiota in pancreatic ductal adenocarcinoma (PDAC) and in autoimmune pancreatitis (AIP) patients remains largely unknown. We aimed to characterize the fecal microbiota in patients with PDAC and AIP, and explore the possibility of fecal microbial biomarkers for distinguishing PDAC and AIP.
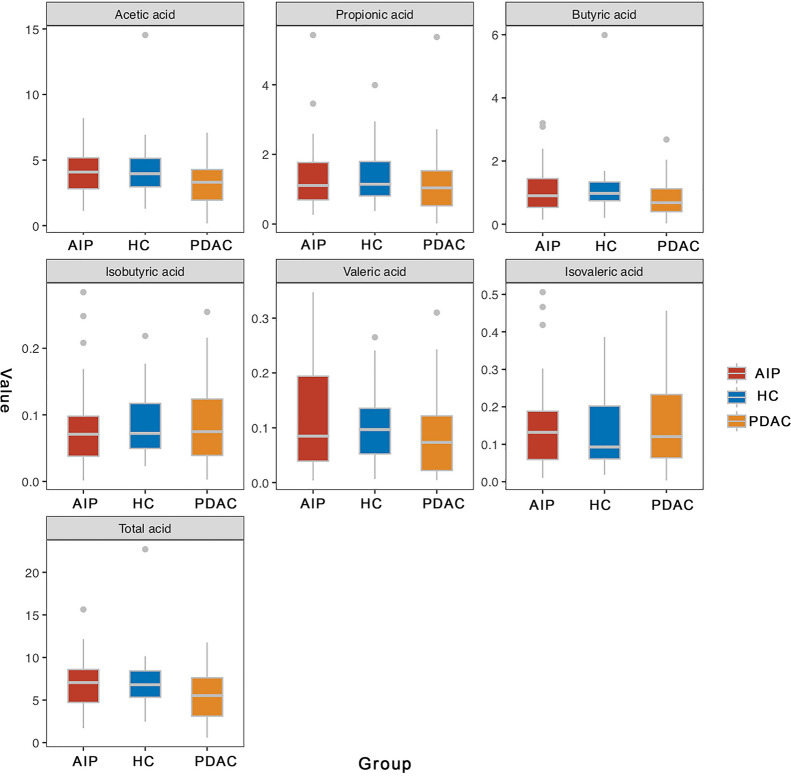
Methods: 32 patients with PDAC, 32 patients with AIP and 32 age- and sex-matched healthy controls (HC) were recruited and the fecal microbiotas were analyzed through high-throughput metagenomic sequencing. Alterations of fecal short-chain fatty acids were measured using gas chromatographic method.
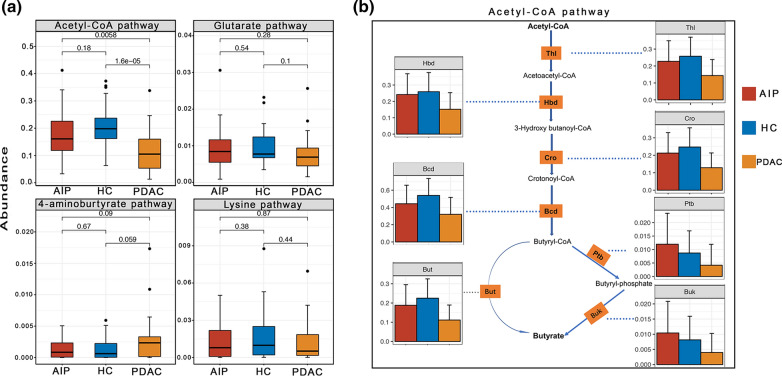
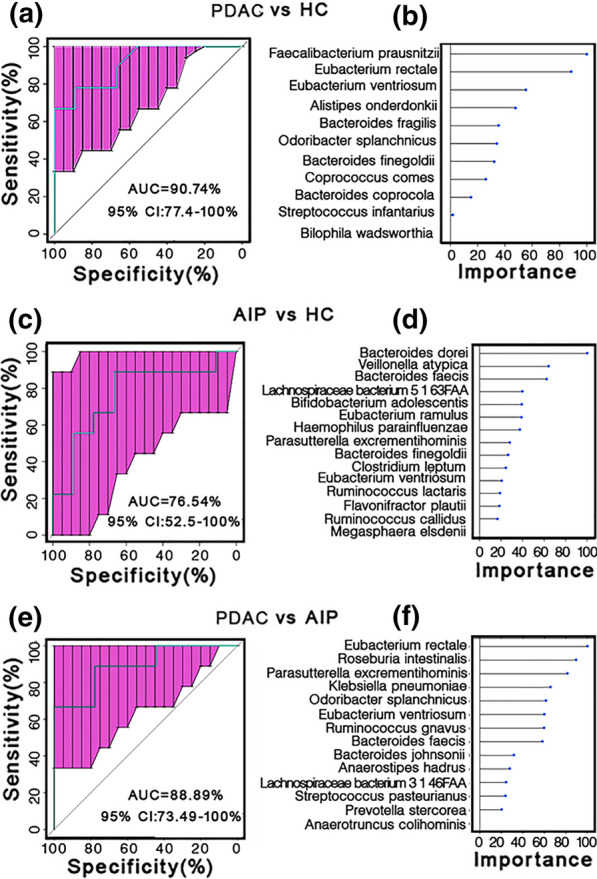
Results: Principal coordinate analysis (PCoA) revealed that microbial compositions differed significantly between PDAC and HC samples; whereas, AIP and HC individuals tended to cluster together. Significant reduction of phylum Firmicutes (especially butyrate-producing bacteria, including Eubacterium rectale, Faecalibacterium prausnitzii and Roseburia intestinalis) and significant increase of phylum Proteobacteria (especially Gammaproteobacteria) were observed only among PDAC samples. At species level, when compared with HC samples, we revealed 24 and 12 differently enriched bacteria in PDAC and AIP, respectively. Functional analysis showed a depletion of short-chain fatty acids synthesis associated KO modules (e.g. Wood-Ljungdahl pathway) and an increase of KO modules associated with bacterial virulence (e.g. type II general secretion pathway). Consistent with the downregulation of butyrate-producing bacteria, gas chromatographic analysis showed fecal butyrate content was significantly decreased in PDAC group. Eubacterium rectale, Eubacterium ventrisum and Odoribacter splanchnicus were among the most important biomarkers in distinguishing PDAC from HC and from AIP individuals. Receiver Operating Characteristic analysis showed areas under the curve of 90.74% (95% confidence interval [CI] 86.47-100%), 88.89% (95% CI 73.49-100%), and 76.54% (95% CI 52.5-100%) for PDAC/HC, PDAC/AIP and AIP/HC, respectively.
Conclusions: In conclusion, alterations in fecal microbiota and butyrate of patients with PDAC suggest an underlying role of gut microbiota for the pathogenesis of PDAC. Fecal microbial and butyrate as potential biomarkers may facilitate to distinguish patients with PDAC from patients with AIP and HCs which worth further validation.
Keywords: Autoimmune pancreatitis; Butyrate; Fecal microbiota; Metagenomic sequencing; Pancreatic ductal adenocarcinoma.
Conflict of interest statement
The authors have declared no competing interests.
Figures


Similar articles
-
Distinct pathophysiological cytokine profiles for discrimination between autoimmune pancreatitis, chronic pancreatitis, and pancreatic ductal adenocarcinoma.J Transl Med. 2017 Jun 2;15(1):126. doi: 10.1186/s12967-017-1227-3. J Transl Med. 2017. PMID: 28578701 Free PMC article.
-
Differentiating autoimmune pancreatitis from pancreatic ductal adenocarcinoma with CT radiomics features.Diagn Interv Imaging. 2020 Sep;101(9):555-564. doi: 10.1016/j.diii.2020.03.002. Epub 2020 Apr 8. Diagn Interv Imaging. 2020. PMID: 32278586
-
The use of magnetic resonance elastography in differentiating autoimmune pancreatitis from pancreatic ductal adenocarcinoma: A preliminary study.Eur J Radiol. 2018 Nov;108:13-20. doi: 10.1016/j.ejrad.2018.09.001. Epub 2018 Sep 5. Eur J Radiol. 2018. PMID: 30396645
-
Differentiation of autoimmune pancreatitis from pancreatic adenocarcinoma using CT characteristics: a systematic review and meta-analysis.Eur Radiol. 2023 Dec;33(12):9010-9021. doi: 10.1007/s00330-023-09959-5. Epub 2023 Jul 19. Eur Radiol. 2023. PMID: 37466708
-
Pancreatic cancer in patients with autoimmune pancreatitis: A scoping review.Pancreatology. 2021 Aug;21(5):928-937. doi: 10.1016/j.pan.2021.03.007. Epub 2021 Mar 18. Pancreatology. 2021. PMID: 33775564
Cited by
-
The Microbiome as a Potential Target for Therapeutic Manipulation in Pancreatic Cancer.Cancers (Basel). 2021 Jul 27;13(15):3779. doi: 10.3390/cancers13153779. Cancers (Basel). 2021. PMID: 34359684 Free PMC article. Review.
-
Eubacterium rectale Improves the Efficacy of Anti-PD1 Immunotherapy in Melanoma via l-Serine-Mediated NK Cell Activation.Research (Wash D C). 2023 Apr 28;6:0127. doi: 10.34133/research.0127. eCollection 2023. Research (Wash D C). 2023. PMID: 37223471 Free PMC article.
-
Microbiome as a biomarker and therapeutic target in pancreatic cancer.BMC Microbiol. 2024 Jan 5;24(1):16. doi: 10.1186/s12866-023-03166-4. BMC Microbiol. 2024. PMID: 38183010 Free PMC article. Review.
-
Microbiota in Pancreatic Diseases: A Review of the Literature.J Clin Med. 2021 Dec 17;10(24):5920. doi: 10.3390/jcm10245920. J Clin Med. 2021. PMID: 34945216 Free PMC article. Review.
-
An investigation for phylogenetic characterization of human Pancreatic cancer microbiome by 16SrDNA Sequencing and Bioinformatics techniques.Res Sq [Preprint]. 2024 Mar 25:rs.3.rs-4140368. doi: 10.21203/rs.3.rs-4140368/v1. Res Sq. 2024. Update in: J Solid Tumors. 2024;14(1):1-9. doi: 10.5430/jst.v14n1p1. PMID: 38585738 Free PMC article. Updated. Preprint.
References
MeSH terms
Supplementary concepts
LinkOut - more resources
Full Text Sources
Other Literature Sources
Medical
Research Materials
Miscellaneous
