. 2021 May 18;40(1):173.
doi: 10.1186/s13046-021-01971-1.

Targeting SERT promotes tryptophan metabolism: mechanisms and implications in colon cancer treatment

Affiliations

Targeting SERT promotes tryptophan metabolism: mechanisms and implications in colon cancer treatment

Di Ye et al. J Exp Clin Cancer Res. .

Abstract

Background: Serotonin signaling has been associated with tumorigenesis and tumor progression. Targeting the serotonin transporter to block serotonin cellular uptake confers antineoplastic effects in various tumors, including colon cancer. However, the antineoplastic mechanism of serotonin transporter inhibition and serotonin metabolism alterations in the absence of serotonin transporter have not been elucidated, especially in colon cancer, which might limit anti-tumor effects associating with targeting serotonin transporter.

Methods: The promotion in the uptake and catabolism of extracellular tryptophan and targeting serotonin transporter was detected by using quantitative reverse-transcription polymerase chain reaction, western blotting and liquid chromatography tandem mass spectrometry. Western blotting Immunoprecipitation and immunofluorescence was utilized to research the serotonylation of mTOR by serotonin and serotonin transporter inhibition. The primary mouse model, homograft model and tissue microarry was used to explore the tryptophan pathway in colon cancer. The cell viability assay, western blotting, xenograft and primary colon cancer mouse model were used to identify whether the combination of sertraline and tryptophan restriction had a synergistic effect.

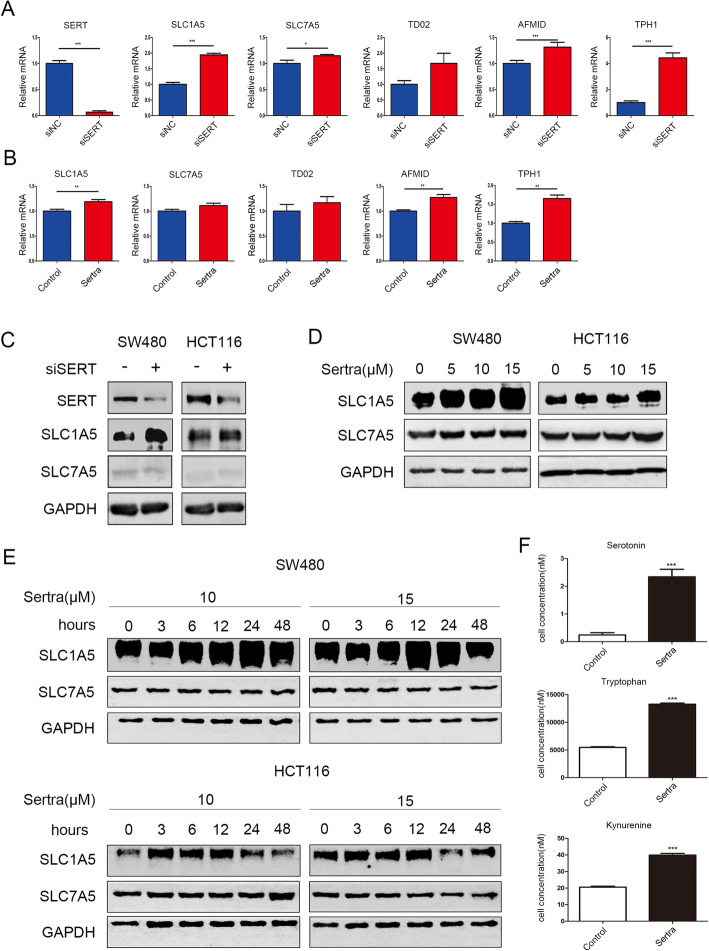
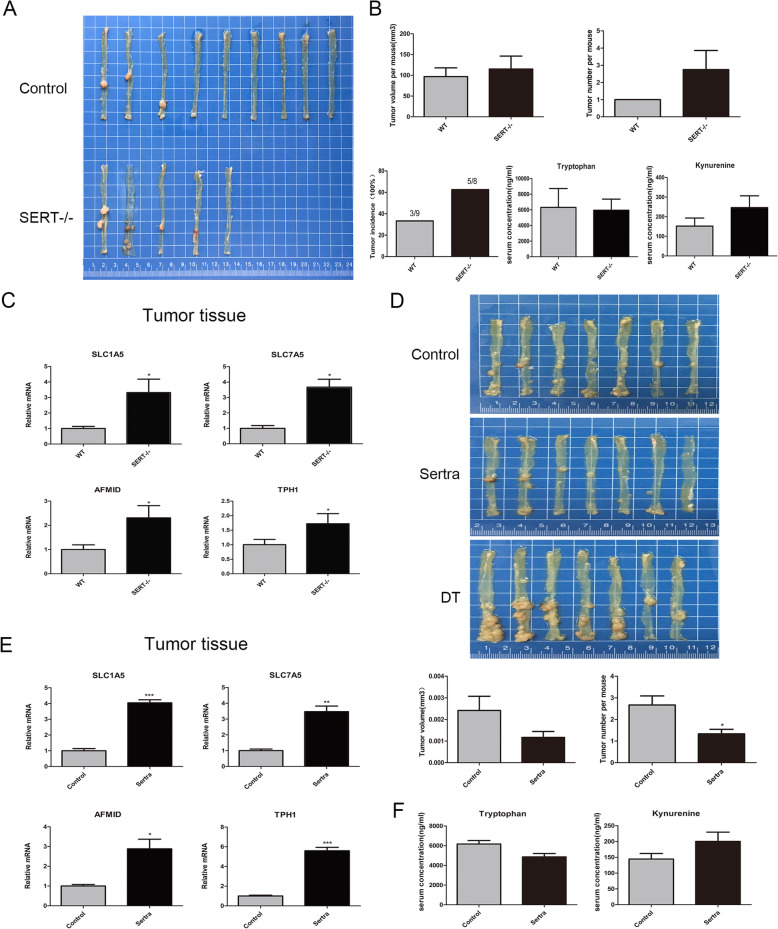
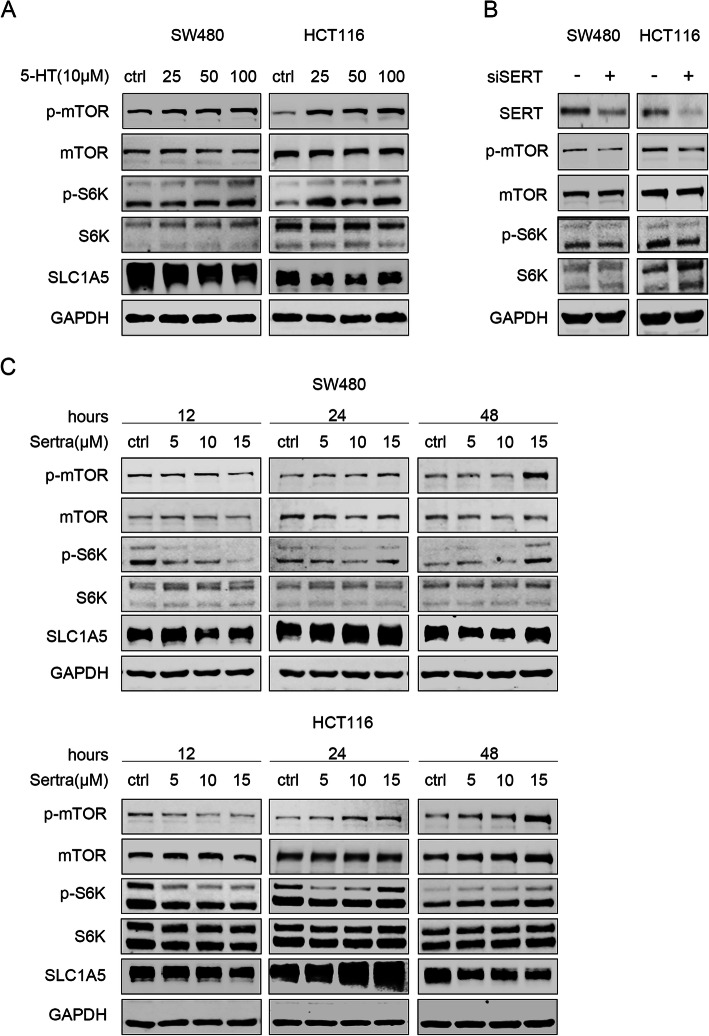
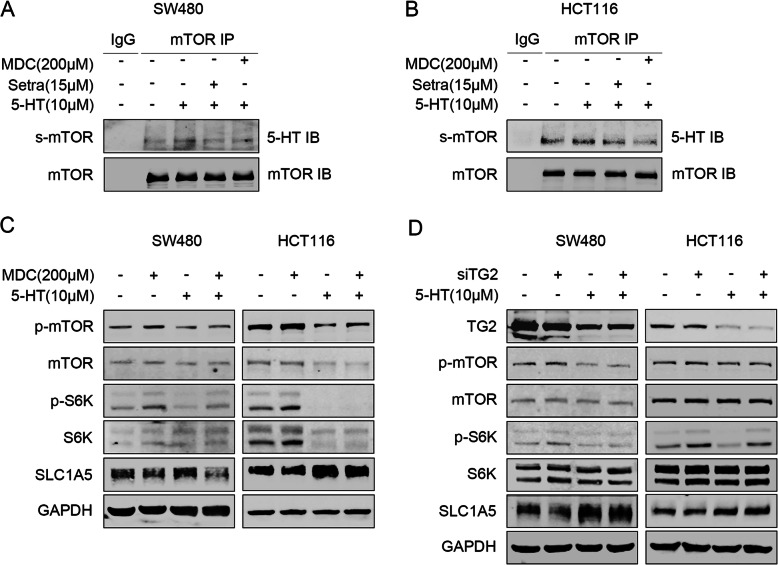
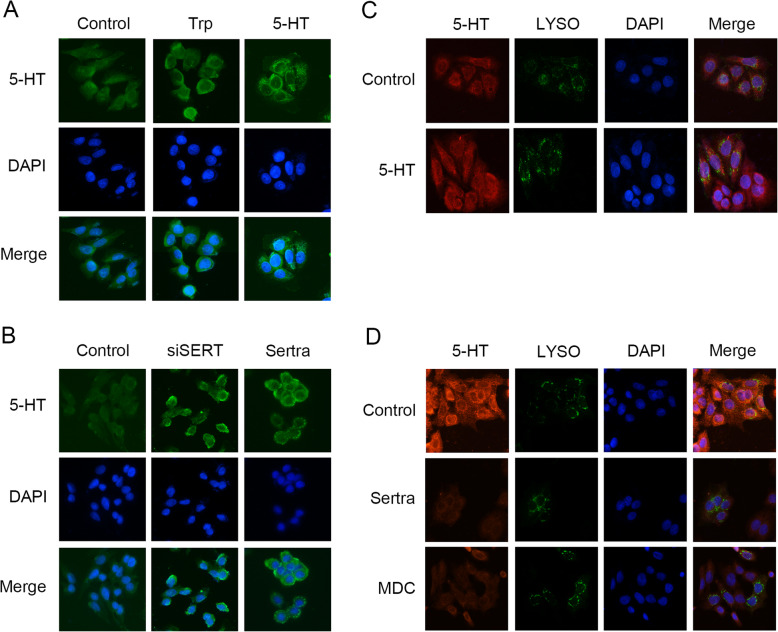
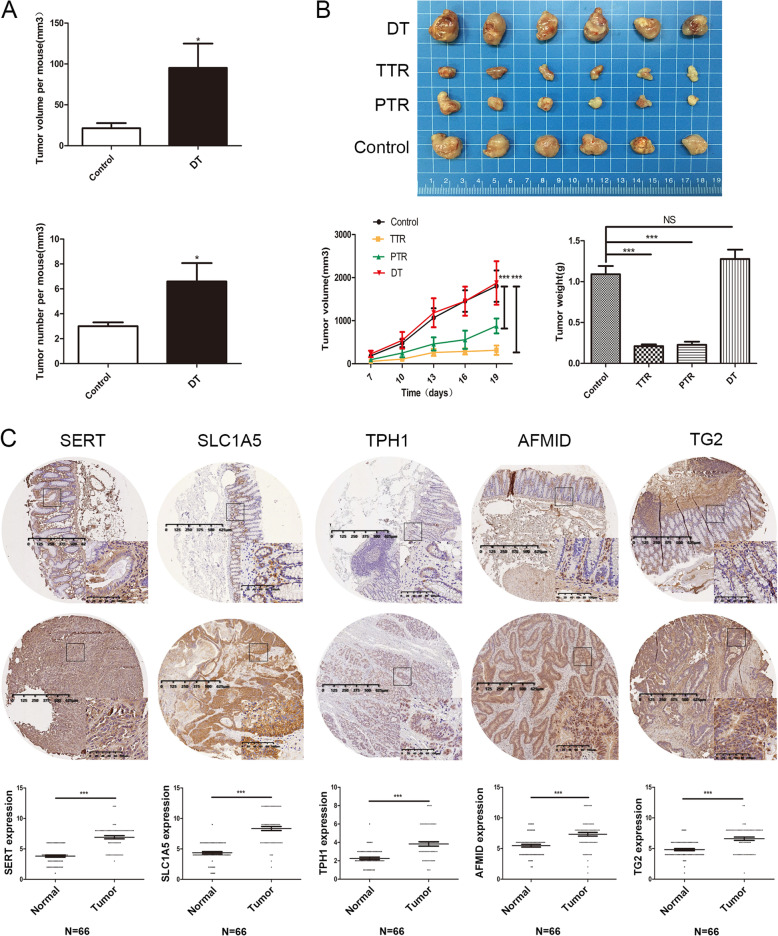
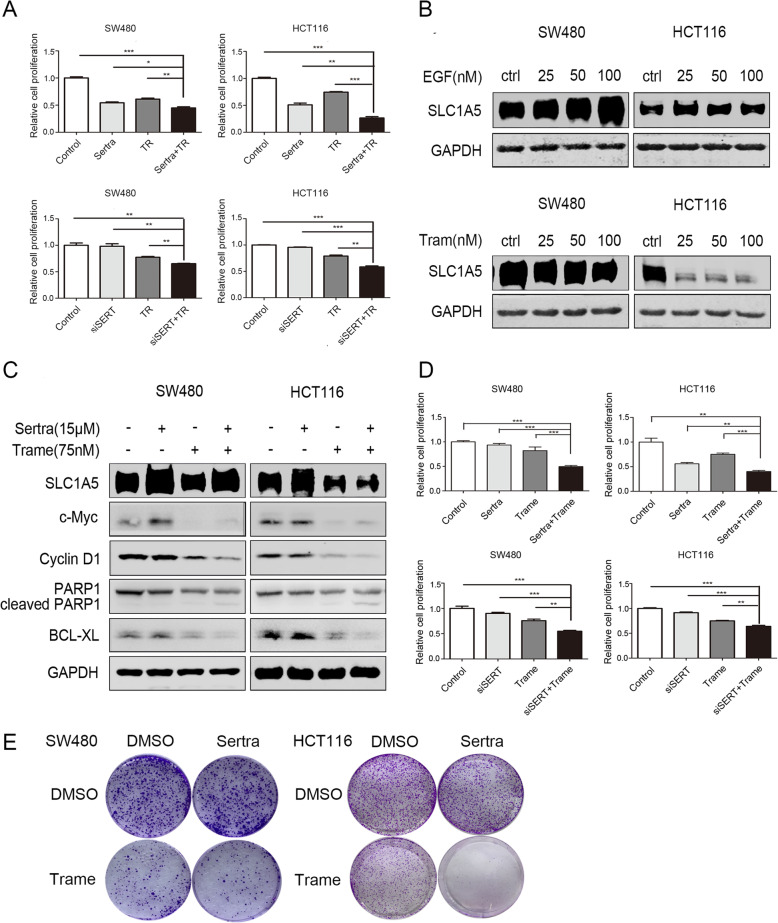
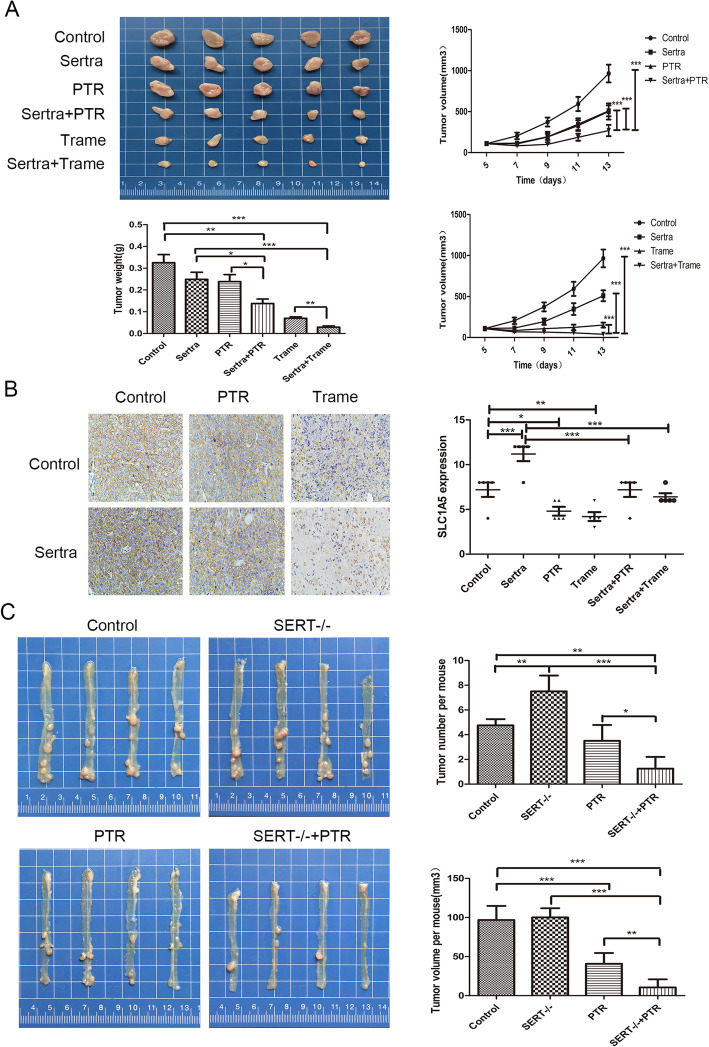
Results: Targeting serotonin transporter through genetic ablation or pharmacological inhibition in vitro and in vivo induced a compensatory effect by promoting the uptake and catabolism of extracellular tryptophan in colon cancer. Mechanistically, targeting serotonin transporter suppressed mTOR serotonylation, leading to mTOR inactivation and increased tryptophan uptake. In turn, this process promoted serotonin biosynthesis and oncogenic metabolite kynurenine production through enhanced tryptophan catabolism. Tryptophan deprivation, or blocking its uptake by using trametinib, a MEK inhibitor, can sensitize colon cancer to selective serotonin reuptake inhibitors.

Conclusions: The present study elucidated a novel feedback mechanism involved in the regulation of serotonin homeostasis and suggested innovative strategies for selective serotonin reuptake inhibitors-based treatment of colon cancer.

Keywords: SERT; Serotonin; Trametinib; Tryptophan; mTORC1.


Conflict of interest statement

The authors declare that they have no conflict of interest.

Figures

Fig. 1
Fig. 1
SERT inhibition promotes Trp uptake and catabolism in vitro. a An RT-PCR for SERT, SLC1A5, SLC7A5, TDO2, AFMID and TPHI mRNA expression in SW480 cells transfected with siSERT or negative control (48 h). The mRNA expressions were normalized to GAPDH. b An RT-PCR for SLC1A5, SLC7A5, TDO2, AFMID and TPHI mRNA expression in SW480 cells treated with sertraline (15 μM, 12 h) or DMSO. The mRNA expressions were normalized to GAPDH. c, d WB for SERT, SLC1A5, SLC7A5 in SW480 and HCT116 cells transfected with siSERT or negative control for 72 h, or treated with increasing concentrations of sertraline (5–15 μM) for 12 h. e WB for SLC1A5, SLC7A5 in SW480 and HCT116 cells treated with increasing concentrations (5–15 μM) of sertraline for increasing hours (0-48 h). f SW480 cells were harvested 12 h after sertraline treatment for metabolite extraction. Intracellular concentrations of Trp, Kyn, and serotonin were quantified by LCMS/MS. Cell numbers were determined and metabolite concentrations were normalized to cell counts from the same sample. *p < 0.05; ** p < 0.05; ***p < 0.001 using the Student’s t test (two-tailed)
Fig. 2
Fig. 2
Trp catabolism was activated in SERT-deleted CC in vivo. a AOM-DSS method was used to induce primary colon cancer in SERT-KO and SERT-WT mice. Mice were injected with AOM (10 mg/kg) and then subjected to three cycles of DSS (1.5%) in drinking water. Fourteen weeks after AOM injection, tumors were dissected and their volumes and number determined. b A linear graph of tumor incidence, average number and tumor area for each group (mean ± SD). Serum levels of Trp, Kyn and serotonin in SERT-WT and SERT-KO mice in normal and AOM/DSS group were detected using LCMS/MS. c RT-PCR for mRNA expression of the indicated Trp transporters and enzymes in tumor tissues of SERT-WT and SERT-KO mice. d The primary colon cancer model was established by AOM-DSS method in SERT-WT mice. One month after AOM injection, mice were randomly distributed into three groups (n = 7) including the control group, sertraline group and double tryptophan (DT) group. The DT diet (4 mg/kg Trp) or a relevant control diet (2 mg/kg Trp) were provided during normal drinking water without DSS. The sertraline group and control group were subjected to sertraline (30 mg/kg) or saline treatment. After 14 weeks, tumors were dissected and their volumes and number determined. The bar graph shows the tumor volumes and number in each group (mean ± SD). e RT-PCR for expression of the indicated Trp transporters and enzymes in tumor tissues of control and sertraline group mice. f Serum levels of Trp, Kyn of control and sertraline group were detected using LCMS/MS. *p < 0.05; ** p < 0.05; *** p<0.001 using Student’s test (two-tailed)
Fig. 3
Fig. 3
Inhibition of SERT blocks activation of the mTOR pathway. a WB for mTOR, S6K and SLC1A5 in HCT116 and SW480 cells treated with increasing concentrations of serotonin (25–100 μM) for 12 h. b WB for mTOR, S6K and SLC1A5 in HCT116 and SW480 cells transfected with siSERT or negative siNC for 48 h. c WB for mTOR, S6K and SLC1A5 in HCT116 and SW480 cells treated with increasing concentrations (5–15 μM) and process time (0–48 h) of sertraline
Fig. 4
Fig. 4
Serotonin activates mTORC1 through serotonylation. a, b SW480 and HCT116 cells were treated with serotonin for 10 min with or without MDC (TG2 inhibitor) (200 μM) or sertraline (15 μM) pretreated for 30 min. Anti-mTOR was used for IP. Western Blot were probed with anti-serotonin. c WB for mTOR, S6K and SLC1A5 in HCT116 and SW480 cells treated with or without serotonin in the presence or absence of MDC. d WB for mTOR, S6K and SLC1A5 in HCT116 and SW480 cells treated with or without serotonin after transfection with siSERT or negative control
Fig. 5
Fig. 5
Endogenous and exogenous serotonin have different subcellular localizations. a SW480 cells were starved with Trp-free and serum-free medium for 24 h after which they were supplied with Trp (75 μM, 9 h) or serotonin (50 μM, 4 h), respectively. Serotonin localization was visualized by IF staining with anti-serotonin (green). DNA was stained with DAPI (blue). Scale bar: 25 μm. b SW480 cells were transfected with siSERT (48 h) or negative control (48 h) or sertraline (15 μM, 12 h). Serotonin localization was visualized by IF staining with anti-serotonin (green). DNA was stained with DAPI (blue). Scale bar: 25 μm. c SW480 cells were transfected with lyso-EGFP (12 h) or the negative control (12 h) and starved with FBS-free medium (24 h) followed by serotonin (50 μM) stimulation (4 h) . Serotonin localization was visualized by IF staining with anti-serotonin (red) while lysosomal localization was visualized as green. DNA was stained with DAPI (blue). Scale bar: 25 μm. d SW480 cells were transfected with lyso-EGFP (24 h) or negative control (24 h) and then treated with sertraline (15 μM) or MDC (200 μM) for 30 min. Serotonin localization was visualized by IF staining with anti-serotonin (red) while lysosome localization was visualized as green. DNA was stained with DAPI (blue). Scale bar: 25 μm
Fig. 6
Fig. 6
Effect of enhancing or limiting tryptophan metabolism in colon cancer mice models. a The linear graph shows the average number and tumor area for control group and DT group (mean ± SD). b CT-26 homografts were established in 6-8-week old female BALB/c mice. Once tumors were palpable, mice were randomized into groups fed on a DT diet (4 mg/kg Trp, n = 6), total tryptophan restriction (TTR) diet (0 mg/kg Trp, n = 6), partial tryptophan restriction (PTR) diet (0.6 mg/kg Trp, n = 6), or a control diet (2 mg/kg Trp, n = 6). Tumor volumes and mice weights were monitored over time. At the end of the experiment, tumors were dissected, imaged and weighed. The bar graph displays the tumour volume and weight of each group (mean ± SD). Statistical methods: one-way ANOVA, *p < 0.05, **p < 0.01, ***p < 0.001, NS indicates no significant difference. c Representative images of Trp metabolism-related proteins in clinical samples of colon cancer tissues and normal colon tissues. IHC analysis of SERT, SLC1A5, TPH1, AFMID, and TGM2 expression in clinical samples of colon cancer tissues and normal colon tissues. The method assigning IHC score for each sample was described in “Materials And Methods” section. *** p < 0.001
Fig. 7
Fig. 7
Anti-tumor effect of a combination SERT inhibition with dietary trp restriction or trametinib in vitro. a Proliferation assays using the Cell Counting Kit-8 in SW480 and HCT116 cells transfected with siSERT or treated with sertraline in the presence or absence of Trp (75 uM) at day 2. Data were presented as the mean ± SD. b Colon cancer cells (SW480 and HCT116) were starved in serum-free medium for 24 h and stimulated with EGF (25-100 nM) for another 24 h or directly treated with trametinib (25-100 nM) for 24 h, after which WB analysis of SLC1A5 was performed. c WB for SLC1A5, c-Myc, Cyclin D1, cleaved PARP and BCL-XL in SW480 and HCT116 cells treated with 15 μM sertraline with or without trametinib (75 nM). d Proliferation assays using the Cell Counting Kit-8 in SW480 and HCT116 cells transfected with siSERT or treated with sertraline in the presence or absence of trametinib at day 2. Data are presented as the mean ± SD. e SW480 and HCT116 cells were incubated with DMSO, sertraline (2 μM), trametinib (25 nM) and combined treatment for 7 d, respectively. Cell proliferation abilities were evaluated by the colony formation assay
Fig. 8
Fig. 8
Anti-tumor effect of a combination SERT inhibition with dietary trp restriction or trametinib in vivo. a Subcutaneous tumors were formed in nude mice injected with HCT116. Once the tumors were palpable, mice were randomly distributed into six groups (n = 5) including the control group (DMSO), sertraline group (30 mg/kg), trametinib group (2 mg/kg), PTR group, sertraline plus PTR group and sertraline plus trametinib group. The diet for all mice were switched for PTR or specific control diet, 1 week before injection. The bar graph shows the tumor weights for each group (n = 5). Tumor sizes and mice weights were measured after every 2 days. Line charts show the tumor volumes for each group (n = 5). Data are presented as the mean ± SD. b Representative pictures of SLC1A5 expression in xenograft tumor tissues. The bar graph indicates the IHC scores of SLC1A5 expression. c Mouse model of AOM/DSS-induced colon cancer was established in SERT-KO and SERT-WT mice. One month after AOM injection, the mice were randomly divided into 4 groups (n = 4) including the control group, SERT-KO group, PTR group and SERT-KO plus PTR group. All mice were fed with PTR diet and matched control diet during the period of drinking normal water. After 14 weeks, tumors were dissected and their volumes and number determined. The graphs showed the average tumor number and volume of each group. Statistical methods: one-way ANOVA followed by LSD post hoc test, *p < 0.05, **p < 0.01, ***p < 0.001

Similar articles

Cited by

References

    1. Walther D, Peter J, Bashammakh S, Hörtnagl H, Voits M, Fink H, Bader M. Synthesis of serotonin by a second tryptophan hydroxylase isoform. Science (New York, NY) 2003;299(5603):76. doi: 10.1126/science.1078197. - DOI - PubMed
    1. Kannen V, Bader M, Sakita J, Uyemura S, Squire J. The dual role of serotonin in colorectal Cancer. Trends Endocrinol Metab. 2020;31(8):611–625. doi: 10.1016/j.tem.2020.04.008. - DOI - PubMed
    1. Nocito A, Dahm F, Jochum W, Jang J, Georgiev P, Bader M, Graf R, Clavien P. Serotonin regulates macrophage-mediated angiogenesis in a mouse model of colon cancer allografts. Cancer Res. 2008;68(13):5152–5158. doi: 10.1158/0008-5472.CAN-08-0202. - DOI - PubMed
    1. Sakita J, Bader M, Santos E, Garcia S, Minto S, Alenina N, Brunaldi M, Carvalho M, Vidotto T, Gasparotto B, et al. Serotonin synthesis protects the mouse colonic crypt from DNA damage and colorectal tumorigenesis. J Pathol. 2019;249(1):102–113. doi: 10.1002/path.5285. - DOI - PubMed
    1. Tutton P, Barkla D. The influence of serotonin on the mitotic rate in the colonic crypt epithelium and in colonic adenocarcinoma in rats. Clin Exp Pharmacol Physiol. 1978;5(1):91–94. doi: 10.1111/j.1440-1681.1978.tb00657.x. - DOI - PubMed

Substances