. 2021 Jul 1;81(13):3635-3648.
doi: 10.1158/0008-5472.CAN-21-0035. Epub 2021 May 18.

An Oncolytic Virus Expressing IL15/IL15Rα Combined with Off-the-Shelf EGFR-CAR NK Cells Targets Glioblastoma

Affiliations

An Oncolytic Virus Expressing IL15/IL15Rα Combined with Off-the-Shelf EGFR-CAR NK Cells Targets Glioblastoma

Rui Ma et al. Cancer Res. .

Abstract

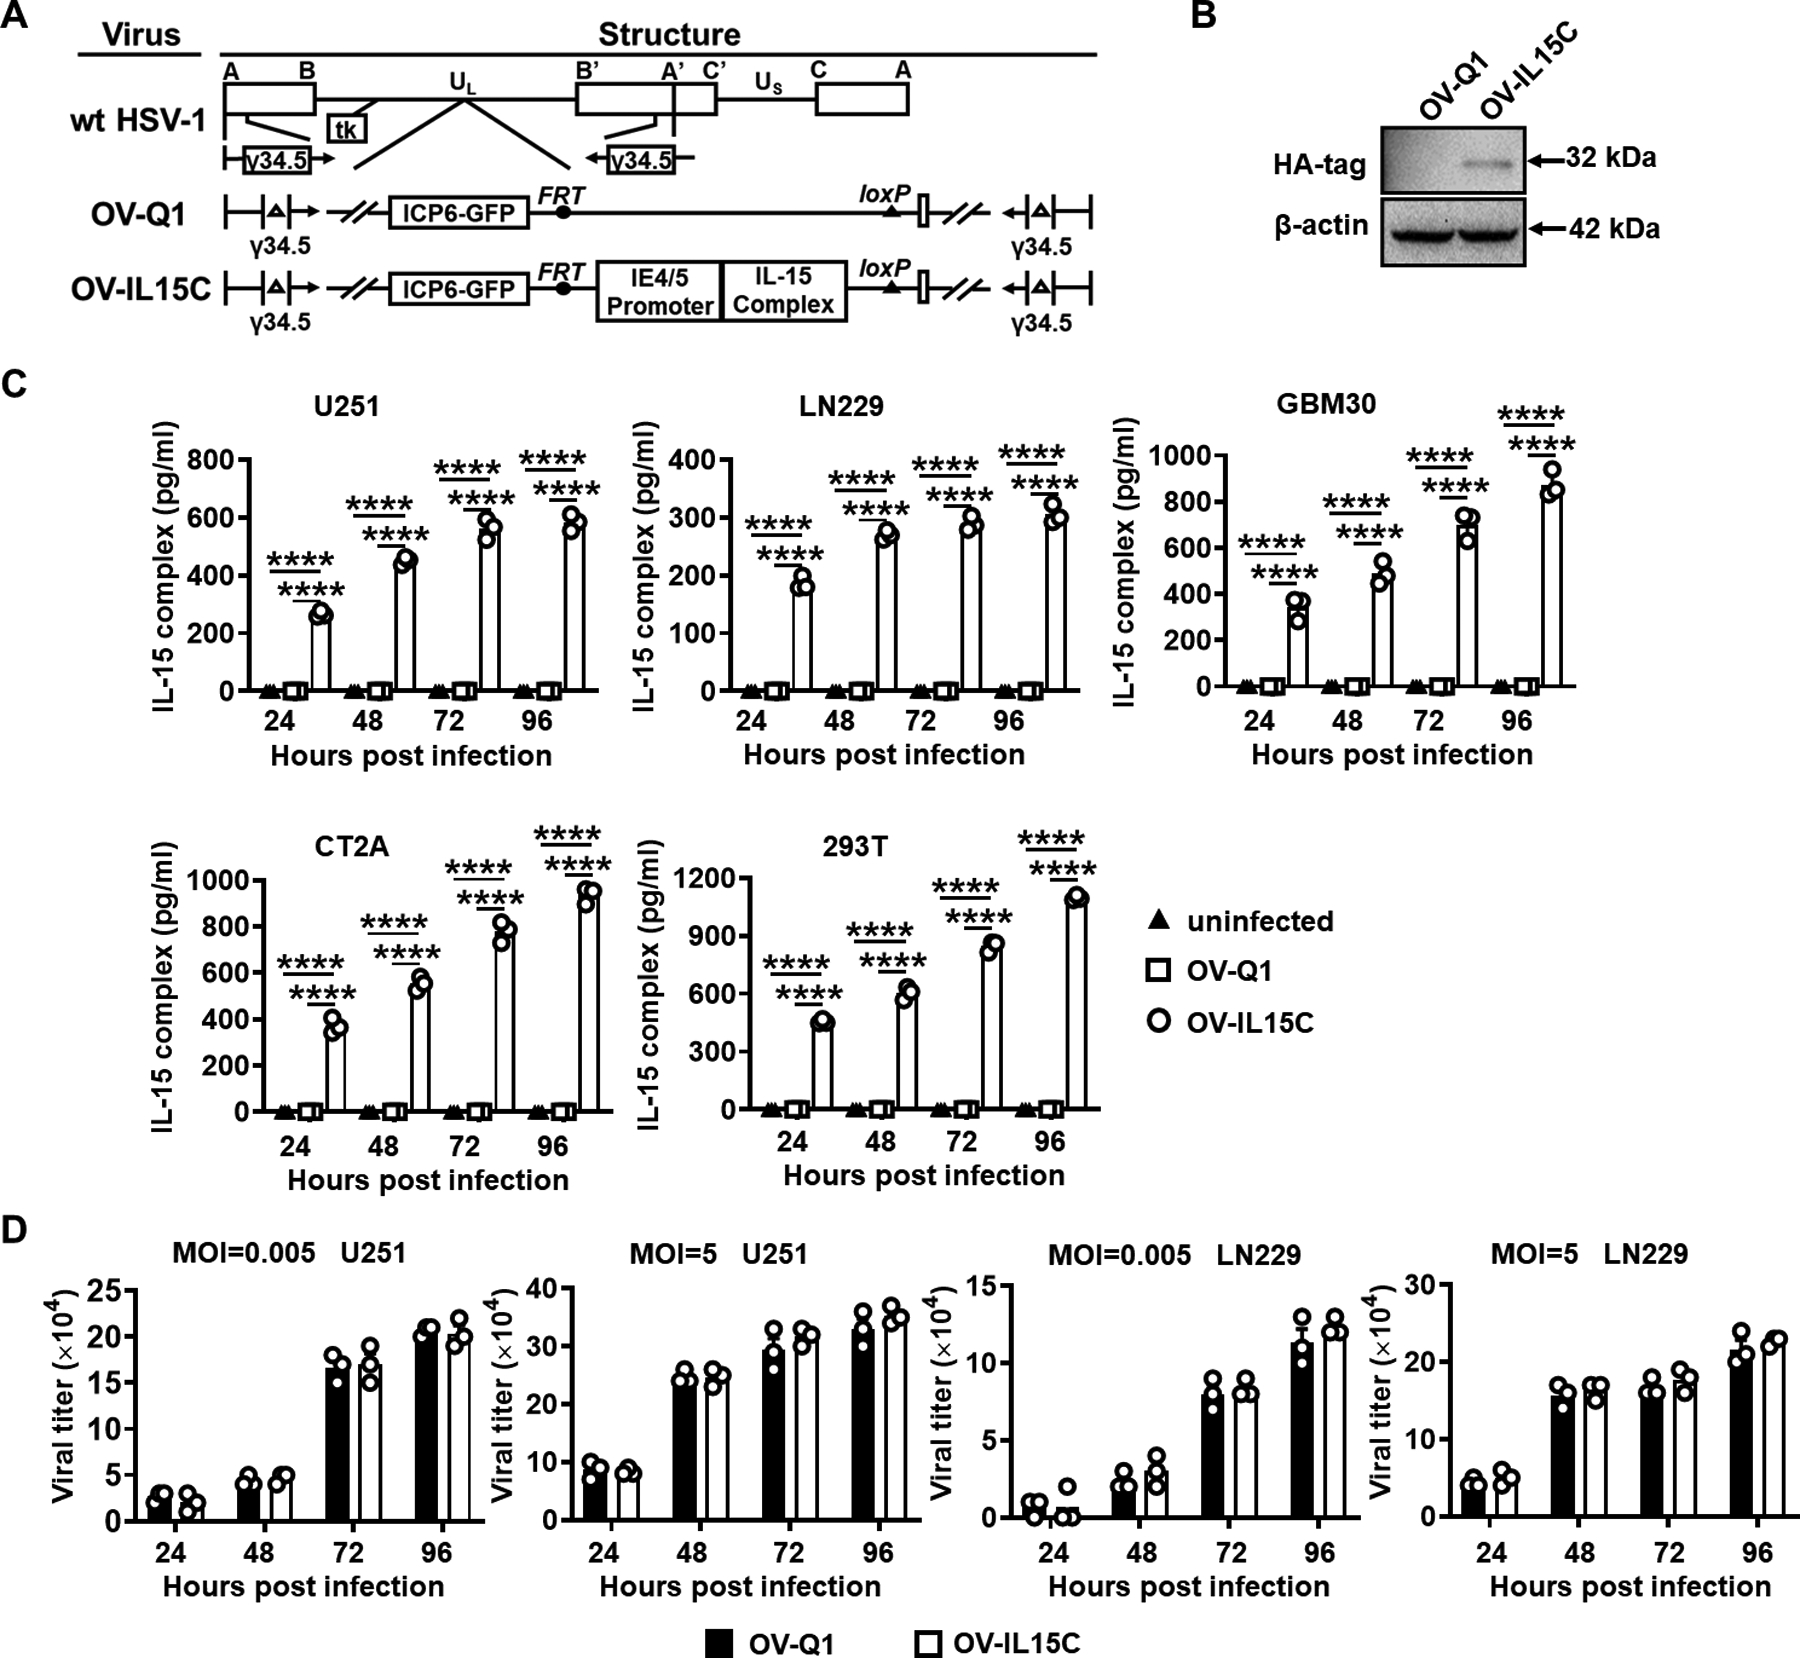
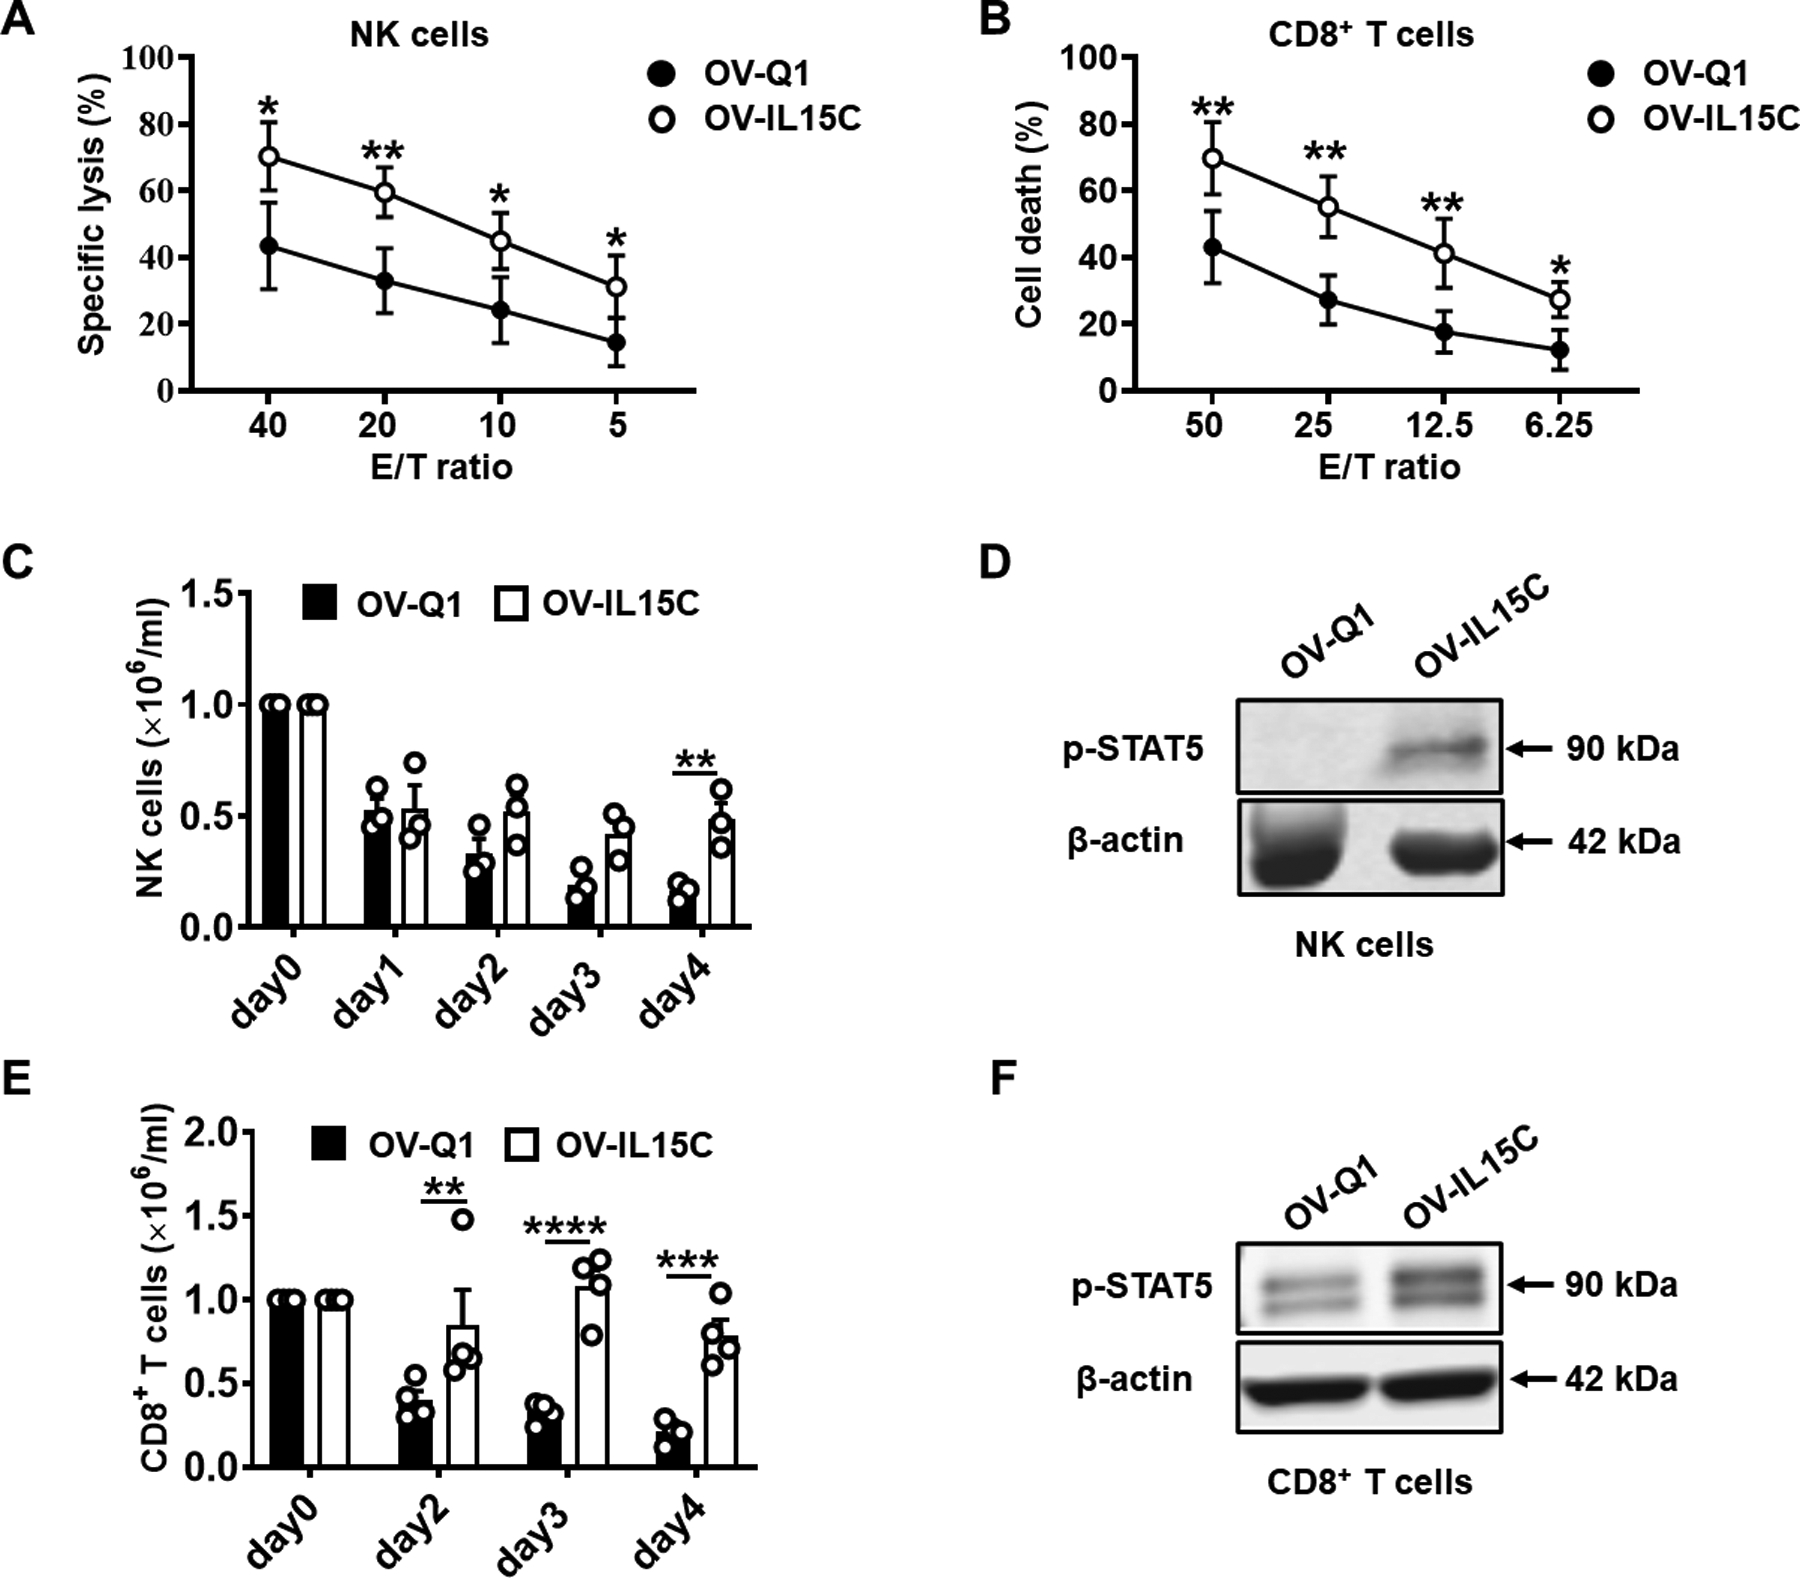
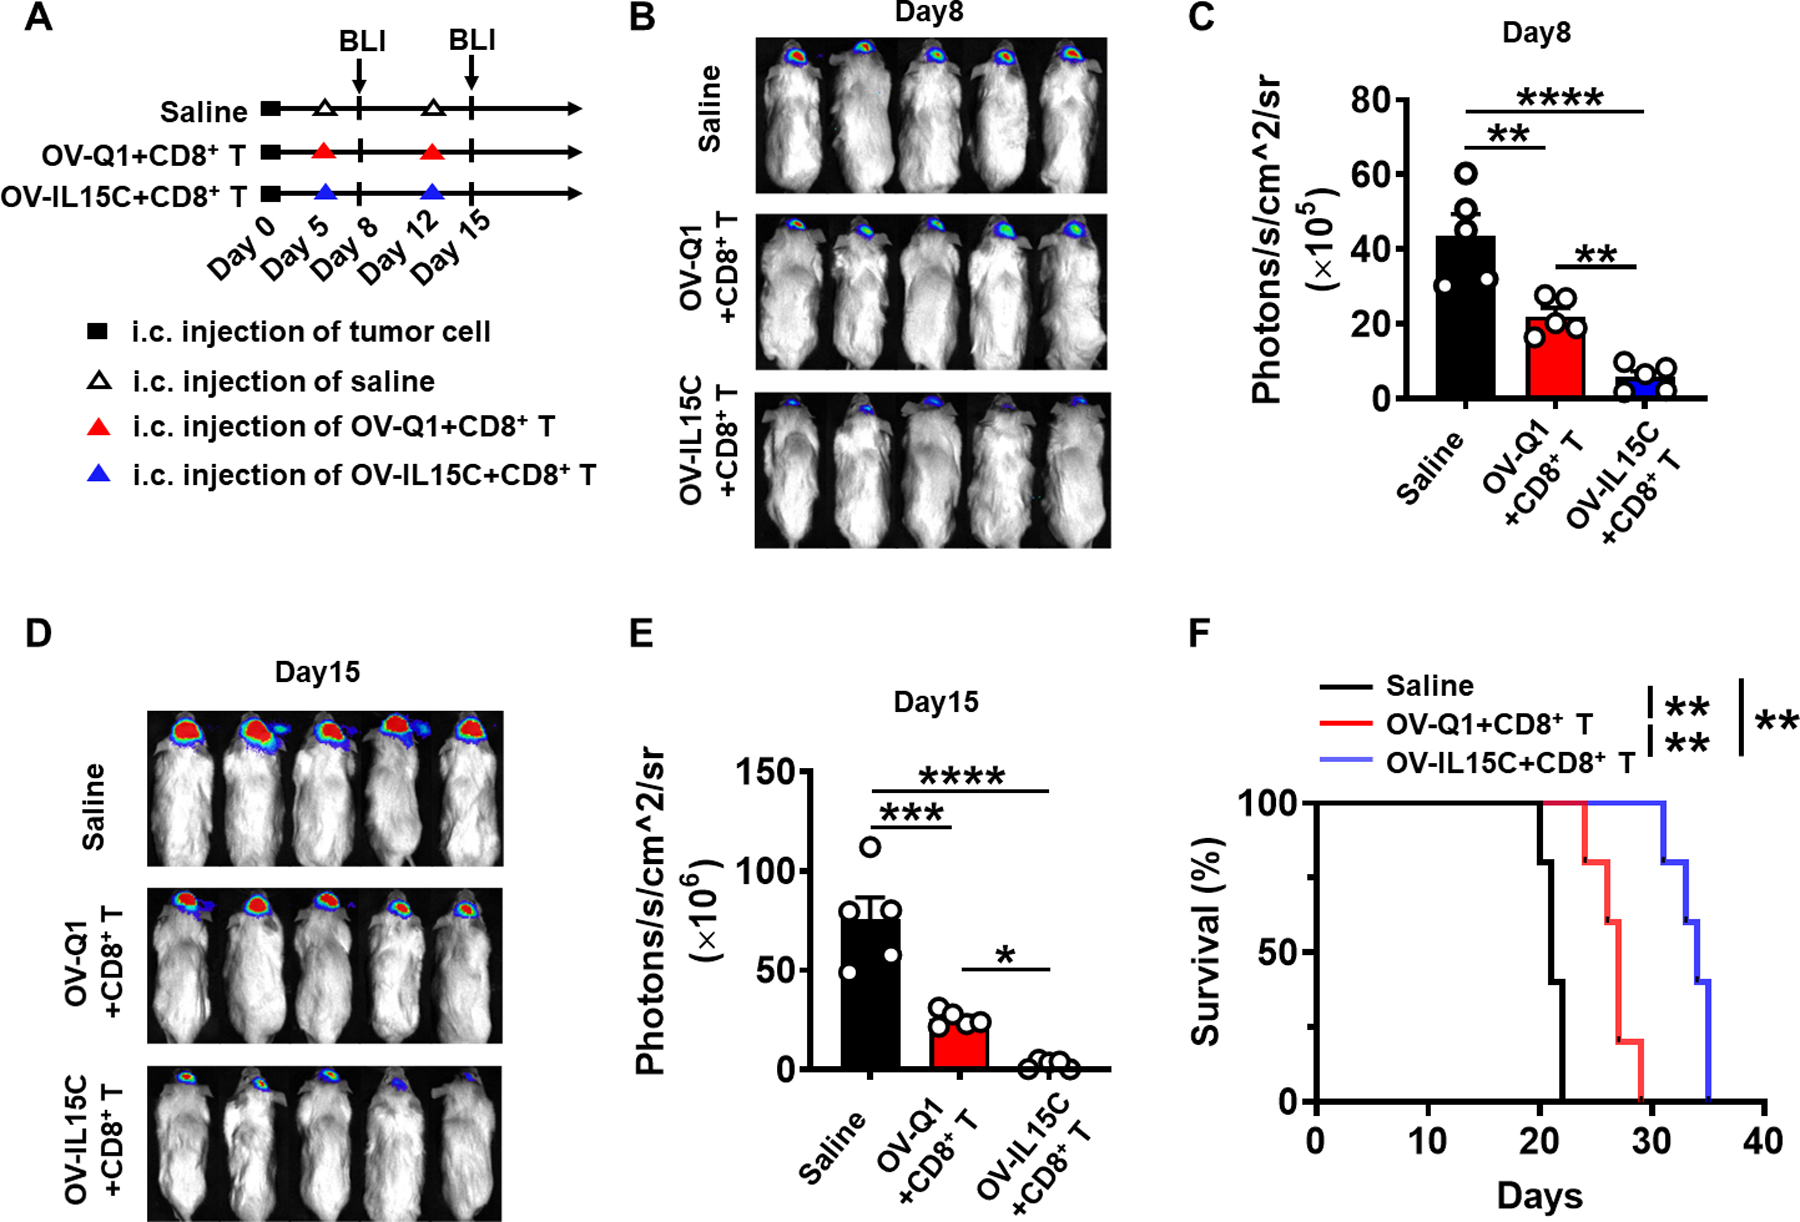
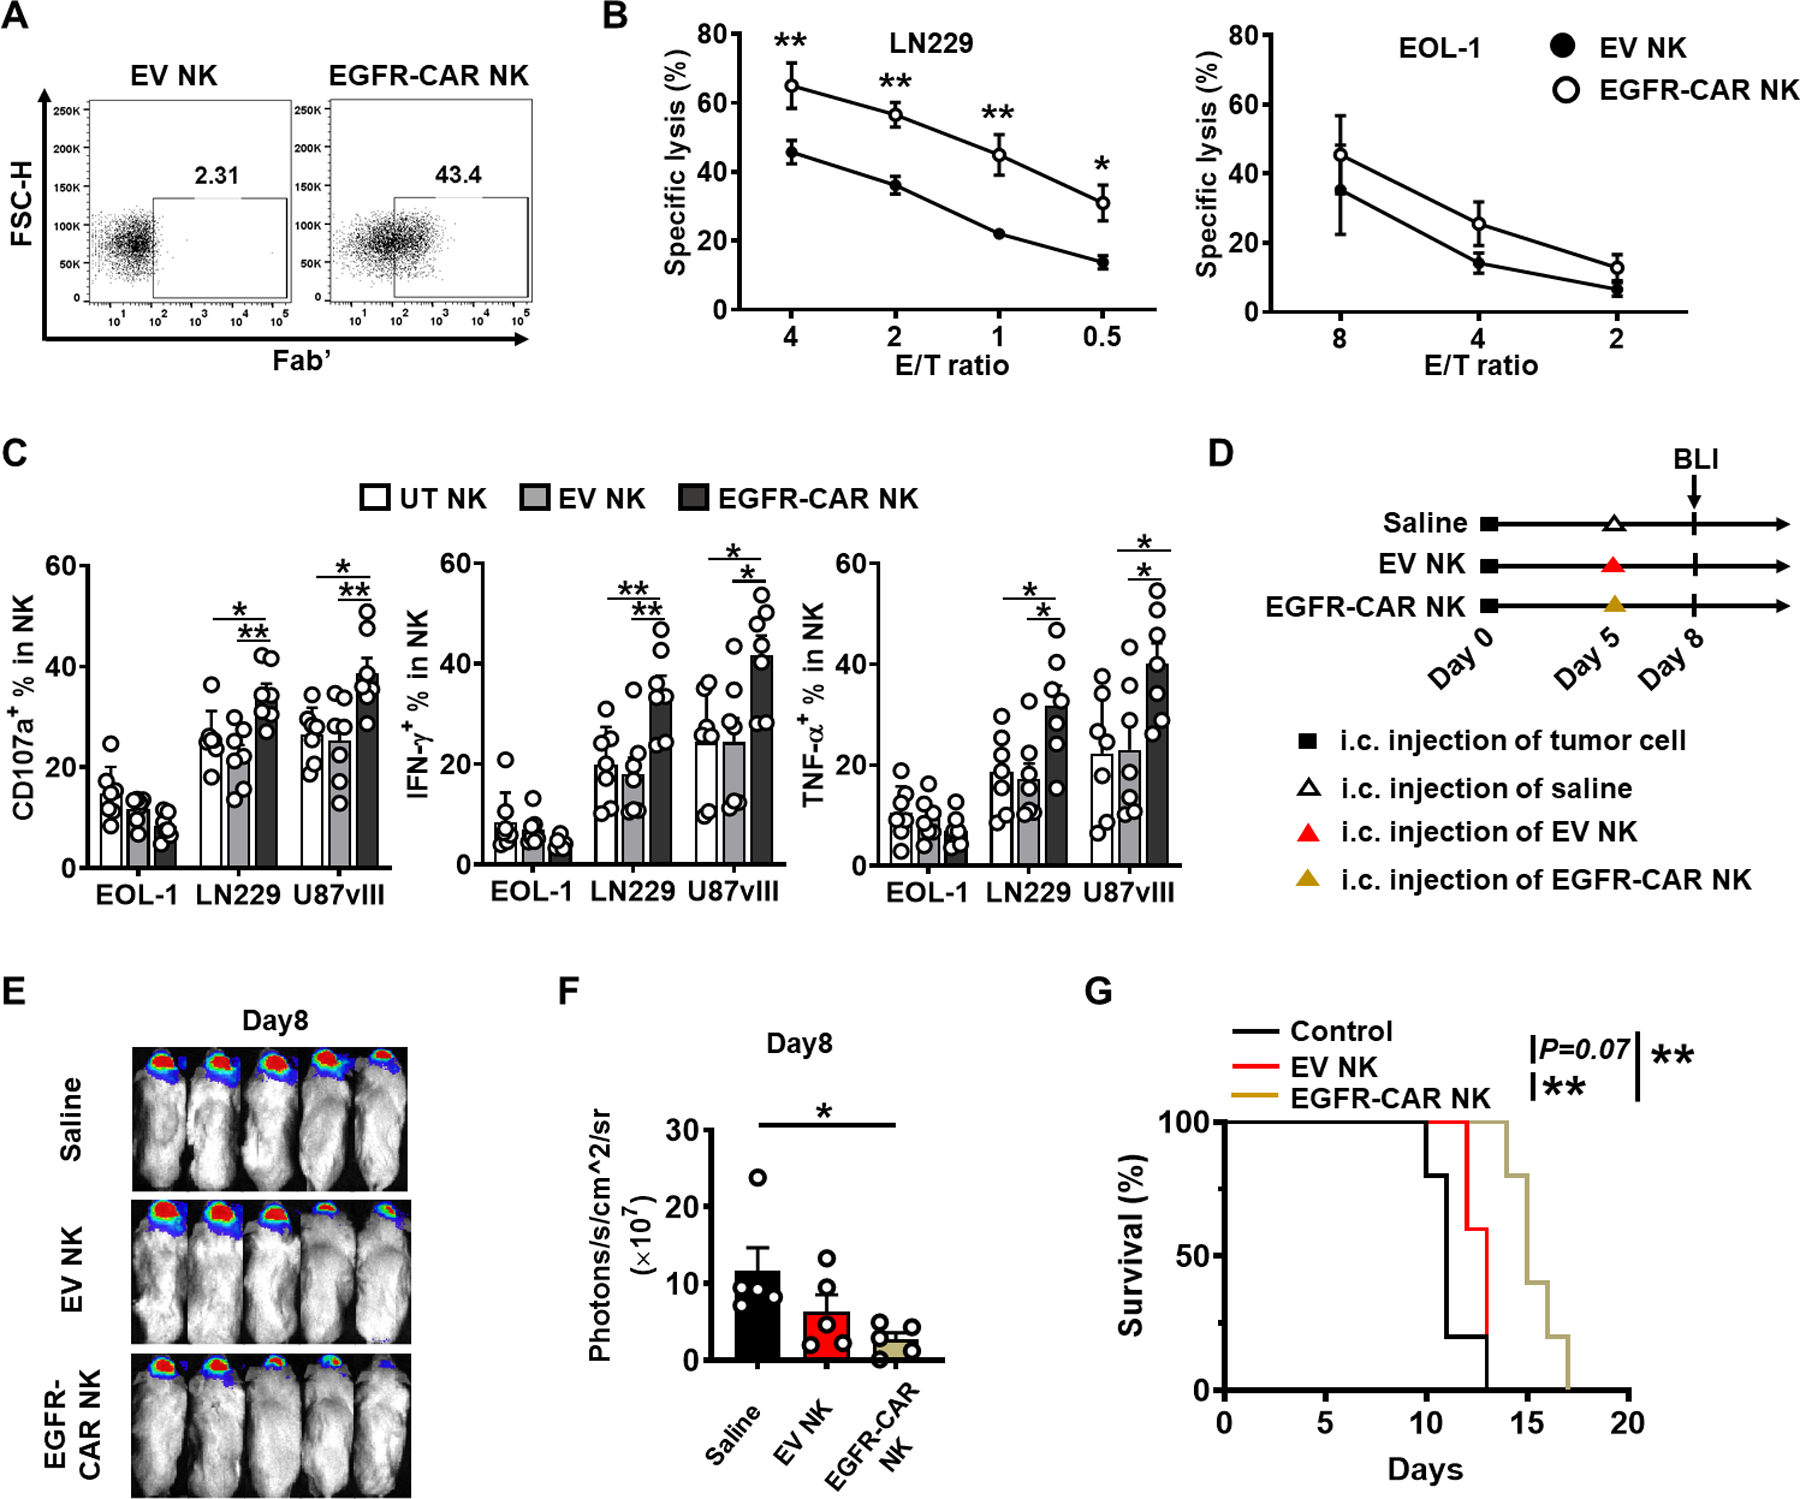
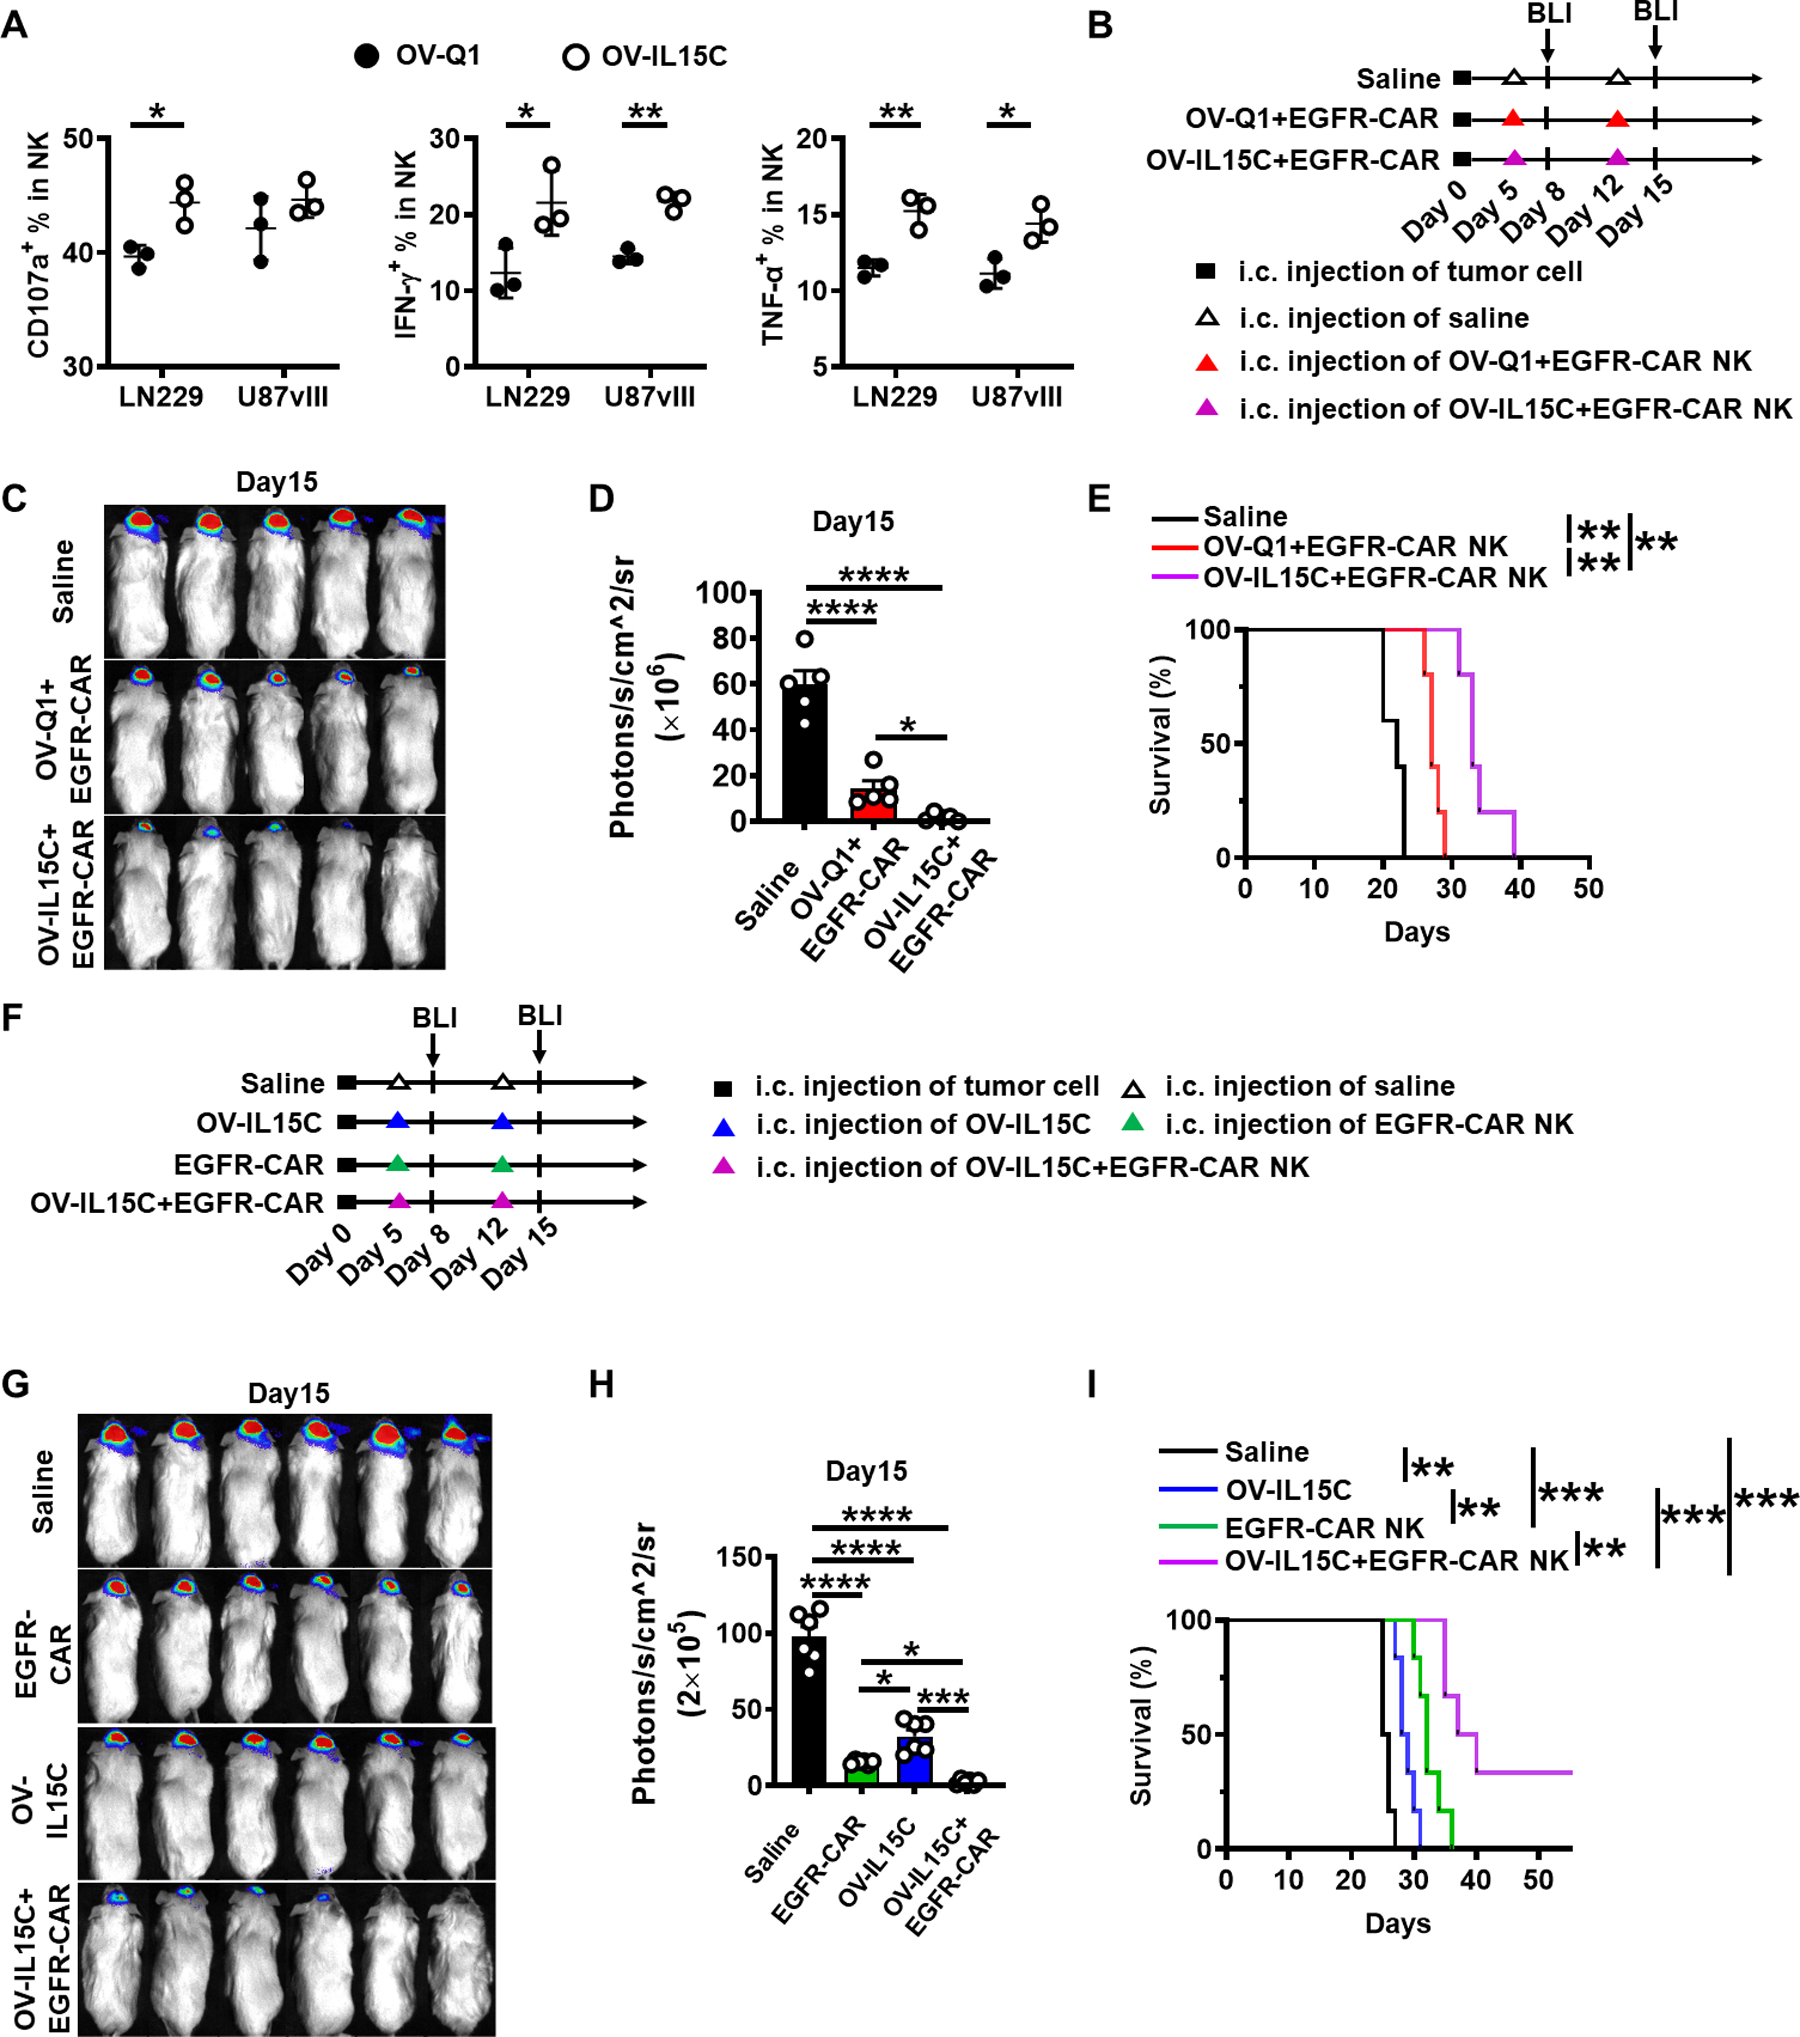
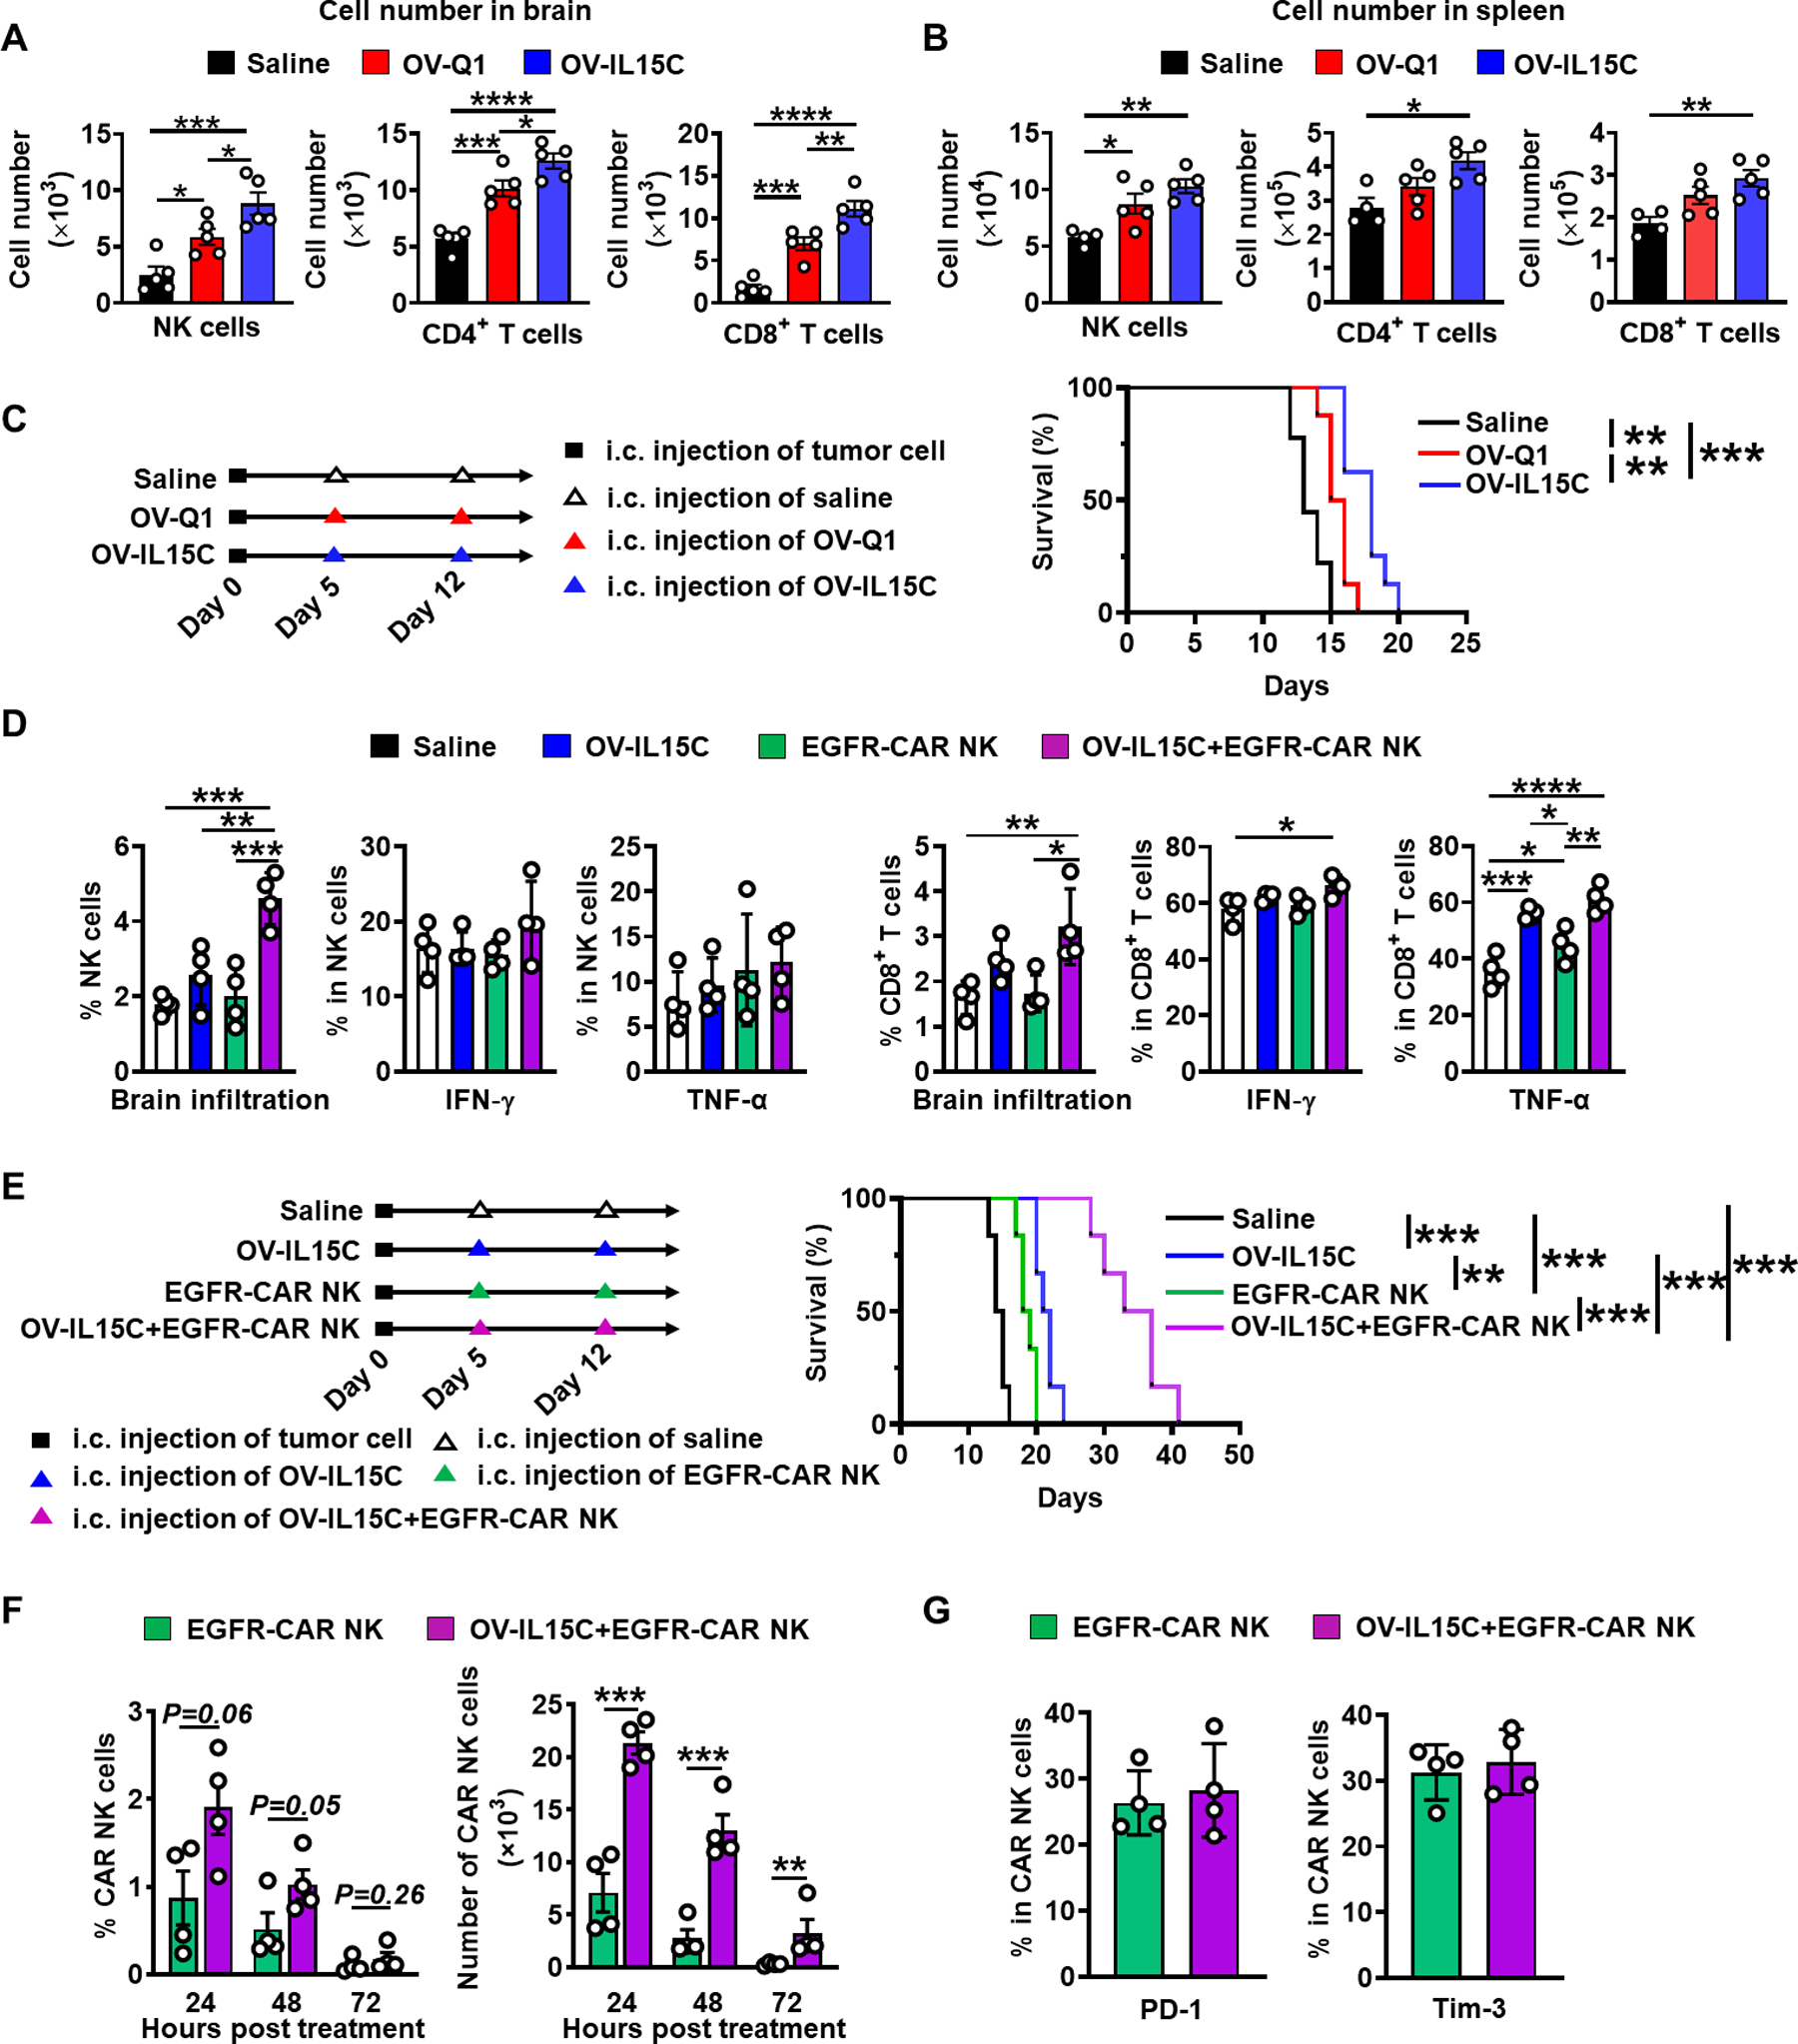
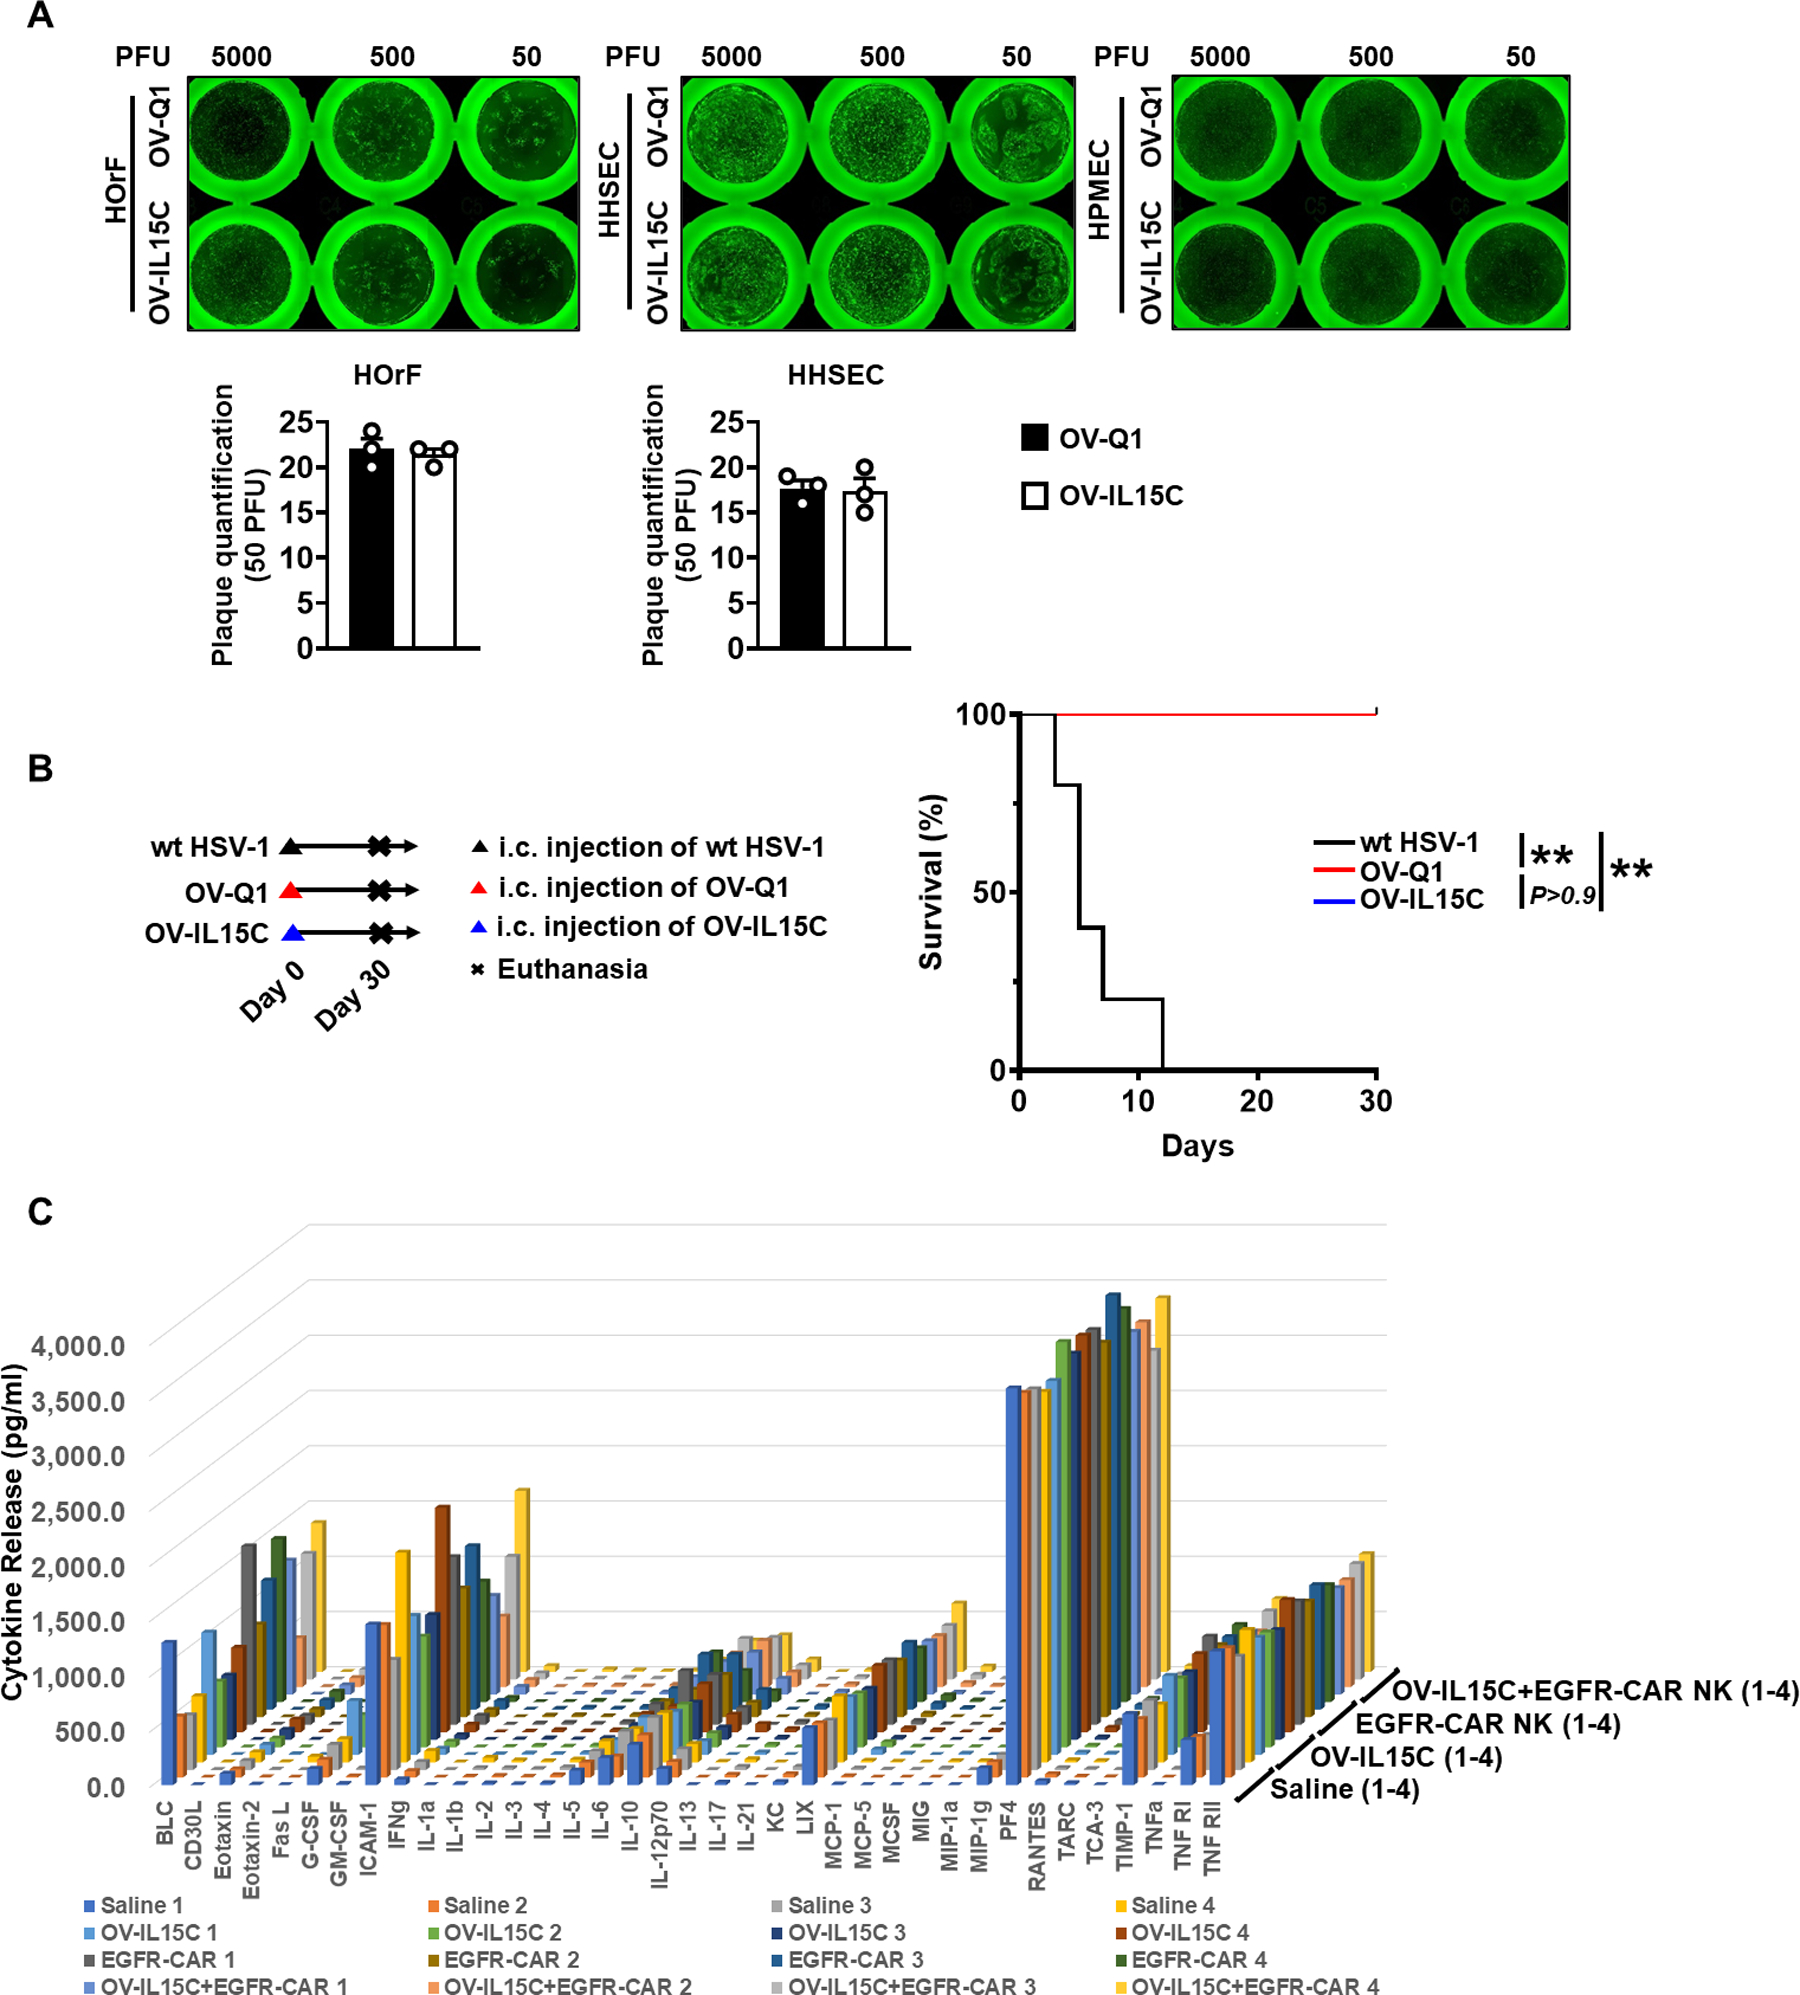
IL15 is a pleiotropic cytokine with multiple roles that improve immune responses to tumor cells. Oncolytic viruses (OV) specifically lyse tumors and activate immune responses. Systemic administration of IL15 or its complex with the IL15Rα and chimeric antigen receptor (CAR) natural killer (NK) cells are currently being tested in the clinic. Here, we generated a herpes simplex 1-based OV-expressing human IL15/IL15Rα sushi domain fusion protein (named OV-IL15C), as well as off-the-shelf EGFR-CAR NK cells, and studied their monotherapy and combination efficacy in vitro and in multiple glioblastoma (GBM) mouse models. In vitro, soluble IL15/IL15Rα complex was secreted from OV-IL15C-infected GBM cells, which promoted GBM cytotoxicity and improved survival of NK and CD8+ T cells. Frozen, readily available off-the-shelf EGFR-CAR NK cells showed enhanced killing of tumor cells compared with empty vector-transduced NK cells. In vivo, OV-IL15C significantly inhibited tumor growth and prolonged survival of GBM-bearing mice in the presence of CD8+ T cells compared with parental OV. OV-IL15C plus EGFR-CAR NK cells synergistically suppressed tumor growth and significantly improved survival compared with either monotherapy, correlating with increased intracranial infiltration and activation of NK and CD8+ T cells and elevated persistence of CAR NK cells in an immunocompetent model. Collectively, OV-IL15C and off-the-shelf EGFR-CAR NK cells represent promising therapeutic strategies for GBM treatment to improve the clinical management of this devastating disease. SIGNIFICANCE: The combination of an oncolytic virus expressing the IL15/IL15Rα complex and frozen, ready-to-use EGFR-CAR NK cells elicits strong antitumor responses in glioblastoma.


Conflict of interest statement

Disclosure of Potential Conflicts of Interest: M.A. Caligiuri and J. Yu are co-founders of CytoImmune, Inc.

Figures

Figure 1.
Figure 1.. Generation of OV-IL15C and quantification of the IL-15/IL-15Rα complex produced by OV-IL15C infection of GBM cells.
A, Schematic maps of oncolytic viruses used in this study. First: genetic map of wild-type HSV-1 (wt HSV-1). Second: genetic map of the parental oHSV control (OV-Q1) with deletion of γ34.5, dysfunction of ICP6, and insertion of the GFP gene. Third: genetic map of the new oHSV (OV-IL15C) showing the insertion of the human IL-15 and IL-15Rα sushi domain driven by the viral pIE4/5 promoter. B, Immunoblotting to test the expression of the human IL-15/IL-15Rα complex at the protein level. 293T cells were infected by OV-Q1 or OV-IL15C at a MOI of 2. Two days later, cell lysis was collected and used for detection of the HA-tagged IL-15/IL-15Rα complex by immunoblotting with an expected size. β-actin was used as a sample loading control. C, ELISA for the human IL-15/IL-15Rα complex quantification. GBM cell lines (human cell lines U251, LN229, GBM30, murine GBM cell line CT2A) and 293T cells were infected with OV-Q1 or OV-IL15C at a MOI of 0.05. Supernatants from different groups were collected for quantification by a DuoSet ELISA kit. P values correct for ordinary one-way ANOVA using Holm-Sidak multiple comparisons test. Values are presented as mean ± SEM. ****, P < 0.0001. D, Viral production capacity test. Human GBM cell lines U251 or LN229 were seeded in a 96-well plate and infected by OV-Q1 or OV-IL15C at different MOIs (MOI=0.005 unsaturated or 5 saturated). Twenty-four hours, 48 hours, 72 hours, and 96 hours post infection, GFP-positive plaques were counted with a Zeiss fluorescence microscope.
Figure 2.
Figure 2.. The IL-15/IL-15Rα complex secreted by OV-IL15C-infected GBM cells enhances cytotoxicity and improves survival of NK and CD8+ T cells in vitro.
A, 51Cr- release assay. Primary human NK cells were pre-incubated with 10× concentrated supernatants from OV-Q1- or OV-IL15C-infected U251 cells for 18 hours. GBM30 cells were used as target cells and labeled with 51Cr for 1.5 hours, and then co-cultured with the above pre-incubated NK cells at various E/T ratios (40:1, 20:1, 10:1, and 5:1) at 37°C for 4 hours. The results show the average of four different donors. P values are corrected by multiple t tests using the Holm-Sidak method. Values are presented as mean ± SEM. *, P < 0.05; **, P < 0.01. B, Flow cytometry-based cytotoxicity assay. Primary human CD8+ T cells were pre-incubated with 10× concentrated supernatants from OV-Q1- or OV-IL15C-infected U251 cells for 48 hours, followed by co-culturing with the APC-labeled target GBM30 cells at various E/T ratios (50:1, 25:1, 12.5:1, and 6.25:1) at 37°C for 12 hours. The dead cells were stained by SYTOX Blue Dead Cell. The results show the average of five different donors. P values are corrected by multiple t tests using the Holm-Sidak method. Values are presented as mean ± SEM. *, P < 0.05; **, P < 0.01. C-F, Primary human NK or CD8+ T cells were cultured in 10× concentrated supernatants from OV-Q1- or OV-IL15C-infected U251 GBM cells in the absence of rhIL-2. On day 0, 1 × 10⁶ NK or CD8+ T cells per well were seeded in a round-bottom 96-well plate. From day 0 to day 4, live cells in each group were counted daily using Trypan Blue exclusion assays. The experiment was repeated with human NK or CD8+ T cells from four different donors. P values are corrected by multiple t tests using the Holm-Sidak method. Values are presented as mean ± SD. **, P < 0.01; ***, P < 0.001; ****, P < 0.0001. Proteins from NK or CD8+ T cells cultured in 10× concentrated supernatants as above were collected after 0.5 hours or 12 hours of the culture, respectively. 20 μg total proteins for each sample were loaded into the SDS gel. β-actin was used as a sample loading control. Immunoblotting assays for (D) and (F) were repeated with four different donors showing similar data.
Figure 3.
Figure 3.. Enhancement of GBM virotherapy in vivo by OV-IL15C co-administered with human CD8+ T cells in a xenograft GBM mouse model.
A, Experimental timeline for in vivo study. An orthotopic xenograft GBM mouse model was established by intracranial injection of 1 × 10⁵ luciferase-expressing GBM30 cells (GBM30-luc) into the brain of NOD/SCID/IL-2rg (NSG) mice on day 0. On days 5 and 12, mice were intratumorally injected with 2 × 10⁵ pfu of OV-Q1, OV-IL15C, or saline. The two virus groups were co-administered with 1 × 10⁶ activated CD8+ T cells. n=5 animals for each group. B, On day 8, bioluminescence imaging (BLI) to check brain tumor growth. C, Quantification of BLI in B. P values correct for ordinary one-way ANOVA using Holm-Sidak multiple comparisons test. Values are presented as mean ± SD. **, P < 0.01; ****, P < 0.0001. D, BLI to check brain tumor growth on day 15. E, Quantification of BLI in D. P values correct for ordinary one-way ANOVA using Holm-Sidak multiple comparisons test. Values are presented as mean ± SD. *, P < 0.05; ***, P < 0.001; ****, P < 0.0001. F, Survival of GBM30-luc bearing mice treated with OV-Q1, OV-IL15C plus CD8+ T cells or saline. Log-rank test was used to compare survival curves. **, P < 0.01.
Figure 4.
Figure 4.. EGFR-CAR NK cells enhance eradication of GBM cells and prolong survival in an in vivo xenograft model.
A, Assessment of EGFR-CAR expression 48 hours post retroviral transduction by flow cytometry. Anti-mouse Fab’ antibody was used to stain human anti-EGFR scFv on NK cells. B, Left: unsorted EGFR-CAR NK cells cytotoxicity function against target LN229 (EGFR positive). Right: an eosinophilic leukemia cell line EOL-1 was used as a negative control. P values are corrected by multiple t tests using the Holm-Sidak method. Values are presented as mean ± SEM. *, P < 0.05; **, P < 0.01. The experiment was repeated three times with NK cells isolated from different donors with similar results. C, Degranulation of CD107a as well as secretion of IFN-γ and TNF-α from untransduced (UT), unsorted EV-transduced (EV), or EGFR-CAR transduced NK cells co-cultured with the GBM cell line LN229 (EGFR positive) or U87vIII (EGFRvIII positive). EOL-1 was performed as a negative control for both. The experiment was repeated seven times with NK cells isolated from different donors with similar results. P values correct for ordinary one-way ANOVA using Holm-Sidak multiple comparisons test. Values are presented as mean ± SEM. *, P < 0.05; **, P < 0.01. D, Experimental timeline for in vivo study. On day 0, a xenograft GBM mouse model was established by intracranial injection of 1 × 10⁵ U87vIII-luc cells into NSG mice. On days 3, mice were intratumorally injected with 1 × 10⁶ EV-transduced NK cells, 1 × 10⁶ EGFR-CAR NK cells, or saline. All transduced cells were unsorted. n=5 animals for each group. E, BLI to check brain tumor growth on day 8. F, Quantification of BLI in E. P values correct for ordinary one-way ANOVA using Holm-Sidak multiple comparisons test. Values are presented as mean ± SD. *, P < 0.05. G, Survival of U87vIII-luc-bearing mice treated with EV-transduced NK cells, EGFR-CAR NK cells, or saline alone. Log-rank test was used to compare animal survival curves. **, P < 0.01.
Figure 5.
Figure 5.. The combination of OV-IL15C and EGFR-CAR NK cells shows better effects than corresponding monotherapies in a xenograft GBM model.
A, Assessment of CD107a degranulation and levels of IFN-γ and TNF-α of frozen EGFR-CAR NK cells. GBM cell lines LN229 and U87vIII were used as target cells. The experiment was repeated three times with different frozen CAR NK cells with similar results. P values were calculated by unpaired t tests. Values are presented as mean ± SEM. *, P < 0.05; **, P < 0.01. B, Experimental timeline for in vivo study. On day 0, a xenograft GBM mouse model was established by intracranial injection of 1 × 10⁵ GBM30-luc cells into NSG mice. On days 5 and 12 after tumor implantation, mice were intratumorally injected with 2 × 10⁵ pfu of OV-Q1 plus 1 × 10⁶ frozen EGFR-CAR NK cells, 2 × 10⁵ pfu of OV-IL15C plus 1 × 10⁶ frozen EGFR-CAR NK cells, or saline alone. All transduced cells were unsorted. n=5 animals for each group. C, BLI of GBM30-luc tumors on day 15. D, Quantification of BLI in C. P values correct for ordinary one-way ANOVA using Holm-Sidak multiple comparisons test. Values are presented as mean ± SD. *, P < 0.05; ****, P < 0.0001. E, Survival of GBM30-luc-bearing mice treated with OV-Q1 or OV-IL15C combined with unsorted frozen EGFR-CAR NK cells or saline. Log-rank test was used to compare animal survival curves. **, P < 0.01. F, The xenograft GBM mouse model was established by intracranial injection of 1 × 10⁵ GBM30-luc cells into NSG mice on day 0. On days 5 and 12, mice were intratumorally injected with 1 × 10⁶ EGFR-CAR NK cells alone, 2 × 10⁵ pfu OV-IL15C alone, 2 × 10⁵ pfu OV-IL15C combined with 1 × 10⁶ EGFR-CAR NK cells or saline as control on each day. n=6 animals for each group. G, BLI of GBM30-luc tumors on day 15. H, Quantification of BLI in G. P values correct for ordinary one-way ANOVA using Holm-Sidak multiple comparisons test. Values are presented as mean ± SD. *, P < 0.05; ***, P < 0.001; ****, P < 0.0001. I, Survival of GBM30-luc bearing mice. Log-rank test was used to compare animal survival curves. **, P < 0.01, ***, P < 0.001.
Figure 6.
Figure 6.. OV-IL15C increases NK and T cells infiltration and activation as well as the persistence of CAR NK cells and improves GBM therapy in the presence of EGFR-CAR NK cells in an immunocompetent model.
A-B, An immunocompetent GBM mouse model was established by intracranial injecting 1 × 10⁵ CT2A cells into C57BL/6 mice on day 0. n=6 animals for each group. On day 5, mice were intratumorally injected with 2 × 10⁵ pfu of OV-Q1, OV-IL15C, or saline as control. Representative of NK and T cells infiltration in the brain and spleen. P values correct for ordinary one-way ANOVA using Holm-Sidak multiple comparisons test. Values are presented as mean ± SD. *, P < 0.05; **, P < 0.01; ***, P < 0.001; ****, P < 0.0001. C, Left: in vivo experiment schedule. Right: survival of CT2A-bearing mice treated with OV-Q1, OV-IL15C, or saline as control. Log-rank test was used to compare animal survival curves. n=8 animals for each group. **, P < 0.01; ***, P < 0.001. D, The infiltration and activation of NK and CD8+ T cells in the brain. An immunocompetent model implanted with the murine GBM cell line CT2A expressing human EGFR (CT2A-hEGFR) was established on day 0. On day 5, mice were treated with OV-IL15C alone, frozen, and unsorted EGFR-CAR NK cells alone, the combination of the two agents, or saline. Three days later, mice were sacrificed, and brains were collected to assess NK and T cell infiltration as well as activation. P values were calculated after Log10 transformation due to big variations, followed by one-way ANOVA using Holm-Sidak multiple comparisons test. Values are presented as mean ± SD. *, P < 0.05; **, P < 0.01, ***, P < 0.001; ****, P < 0.0001. E, Left: in vivo experiment schedule. Right: survival of CT2A-hEGFR bearing mice treated with OV-IL15C alone, EGFR-CAR NK cells alone, or combination of the two agents or saline as control. Log-rank test was used to compare animal survival curves. n=6 animals for each group. **, P < 0.01, ***, P < 0.001. F, In vivo persistence of EGFR-CAR NK cells in the presence of OV-IL15C. An immunocompetent model implanted with the murine CT2A-hEGFR GBM cell line was used. Five days after tumor implanted, the mice were treated with frozen EGFR-CAR NK cells alone or in combination with OV-IL15C. Twenty-four, 48 hours or 72 hours after the treatment, mice were sacrificed to check CAR NK cells persistence. P values were calculated after Log10 transformation due to big variations, followed by unpaired t tests. Values are presented as mean ± SD. **, P < 0.01, ***, P < 0.001. G, EGFR-CAR NK cell exhaustion. An immunocompetent model implanted with the murine CT2A-hEGFR GBM cell line was used. Five days later, the mice were treated with frozen EGFR-CAR NK cells alone or in combination with OV-IL15C. Three days after the treatments, mice were sacrificed to determine CAR NK cell exhaustion. Unpaired t tests were used for statistical analysis.
Figure 7.
Figure 7.. Safety profiling of OV-IL15C and EGFR-CAR NK cells.
A, Up: plaque forming assays were performed with three different types of primary human cells, including oral fibroblasts (HOrF), hepatic sinusoidal endothelial cells (HHSEC), and pulmonary microvascular endothelial cells (HPMEC). Bottom: quantification of plaque numbers under 50 PFU infection. Forty-eight hours post infection, GFP-positive plaques were counted with a Zeiss fluorescence microscope. Plaque counts of HPMEC were not included because these cells are highly susceptible to oHSV infection, and the formed plaques do not separate very well. The experiment was repeated three times with similar results. B, Survival curves of BALB/c mice treated with wild-type HSV-1 (F strain) and OV-IL15C at the dose of 1 × 10⁶ pfu via intracranial injection. n=5 animals for each group. Log-rank test was used to compare animal survival curves. **, P < 0.01. C, Release assay of various cytokines in the sera from immunocompetent model implanted with the CT2A-hEGFR murine GBM cell line. Mice were treated with OV-IL15C alone, frozen, and unsorted EGFR-CAR NK cells alone, the combination of two agents, or saline alone. Three days later, mice were sacrificed to collect blood sera to measure levels of indicated cytokines by a cytokine release array assay.

References

    1. Todo T, Rabkin SD, Sundaresan P, Wu A, Meehan KR, Herscowitz HB, et al. Systemic antitumor immunity in experimental brain tumor therapy using a multimutated, replication-competent herpes simplex virus. Hum Gene Ther 1999;10:2741–55 - PubMed
    1. Rehman H, Silk AW, Kane MP, Kaufman HL. Into the clinic: Talimogene laherparepvec (T-VEC), a first-in-class intratumoral oncolytic viral therapy. Journal for ImmunoTherapy of Cancer 2016;4:53. - PMC - PubMed
    1. Waldmann TA, Tagaya Y. The multifaceted regulation of interleukin-15 expression and the role of this cytokine in NK cell differentiation and host response to intracellular pathogens. Annu Rev Immunol 1999;17:19–49 - PubMed
    1. Dubois S, Mariner J, Waldmann TA, Tagaya Y. IL-15Ralpha recycles and presents IL-15 In trans to neighboring cells. Immunity 2002;17:537–47 - PubMed
    1. Van den Bergh JMJ, Lion E, Van Tendeloo VFI, Smits ELJM. IL-15 receptor alpha as the magic wand to boost the success of IL-15 antitumor therapies: The upswing of IL-15 transpresentation. Pharmacology & Therapeutics 2017;170:73–9 - PubMed

Publication types

MeSH terms