

Metformin Affects Gut Microbiome Composition and Function and Circulating Short-Chain Fatty Acids: A Randomized Trial
- PMID: 34006565
- PMCID: PMC8323185
- DOI: 10.2337/dc20-2257
Metformin Affects Gut Microbiome Composition and Function and Circulating Short-Chain Fatty Acids: A Randomized Trial
Abstract
Objective: To determine the longer-term effects of metformin treatment and behavioral weight loss on gut microbiota and short-chain fatty acids (SCFAs).
Research design and methods: We conducted a 3-parallel-arm, randomized trial. We enrolled overweight/obese adults who had been treated for solid tumors but had no ongoing cancer treatment and randomized them (n = 121) to either 1) metformin (up to 2,000 mg), 2) coach-directed behavioral weight loss, or 3) self-directed care (control) for 12 months. We collected stool and serum at baseline (n = 114), 6 months (n = 109), and 12 months (n = 105). From stool, we extracted microbial DNA and conducted amplicon and metagenomic sequencing. We measured SCFAs and other biochemical parameters from fasting serum.
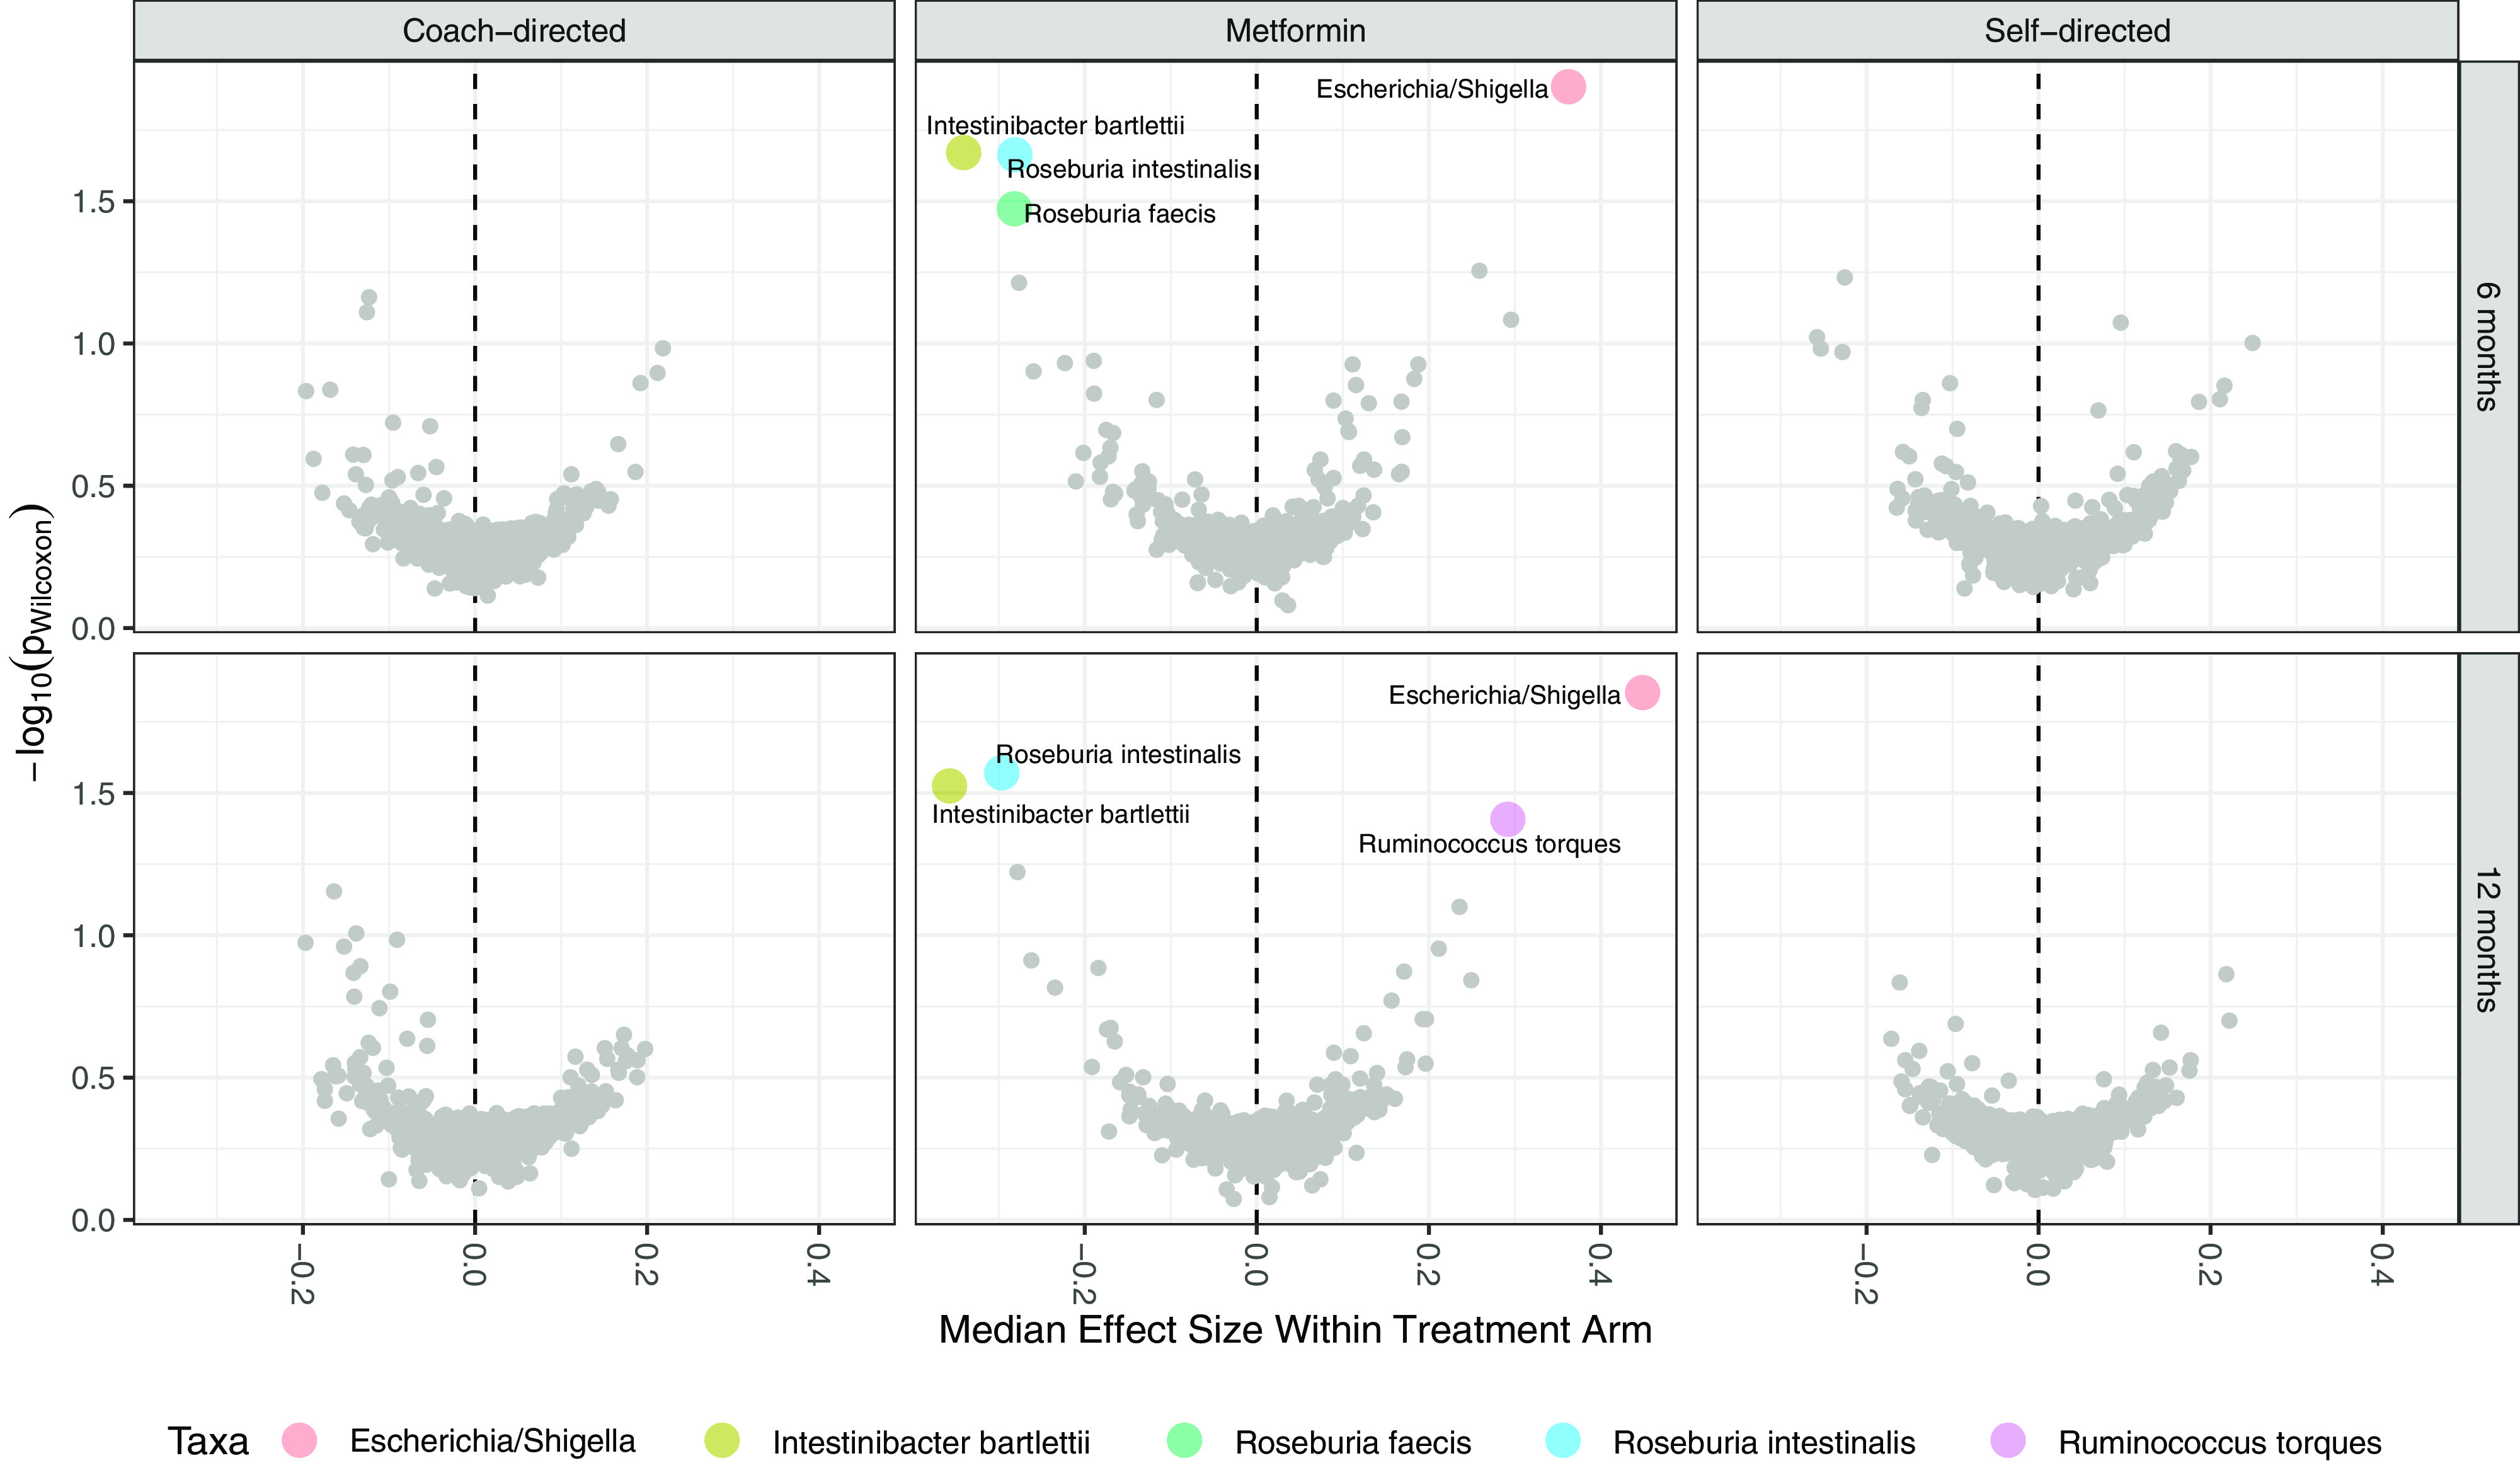
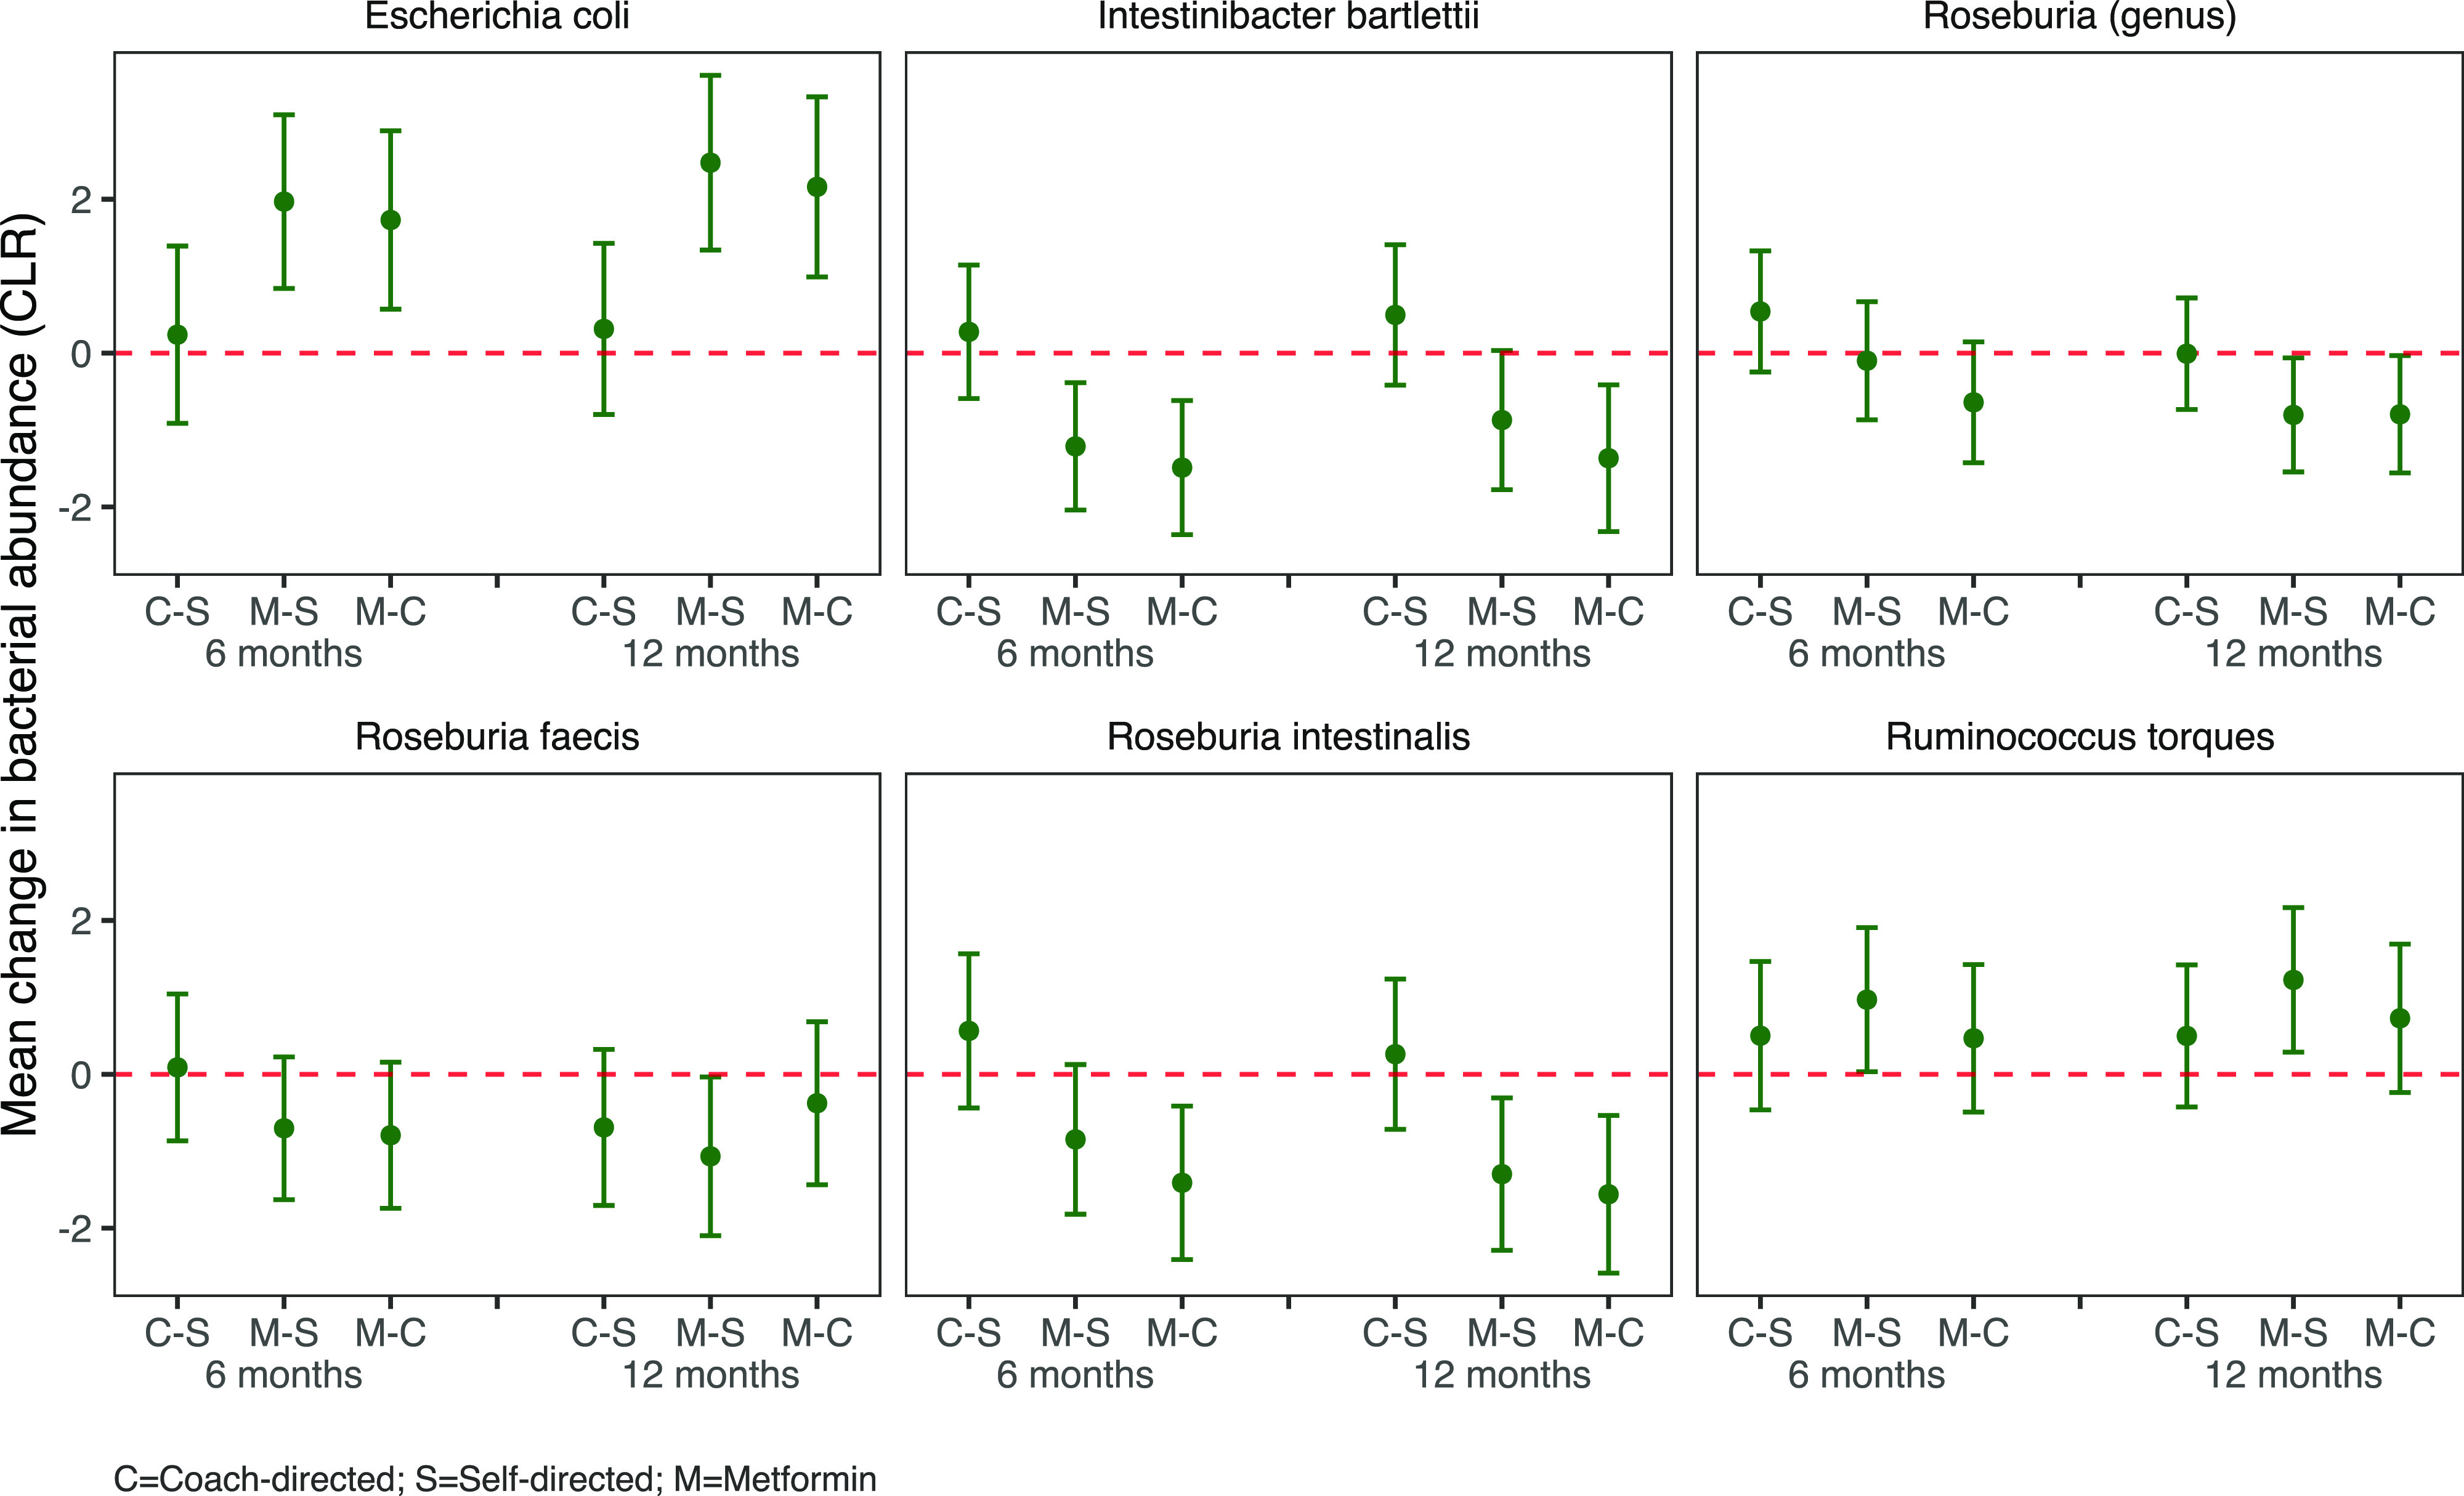
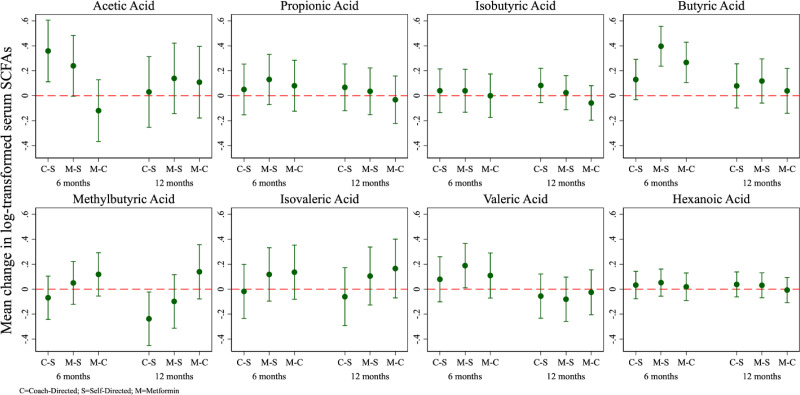
Results: Of the 121 participants, 79% were female and 46% were Black, and the mean age was 60 years. Only metformin treatment significantly altered microbiota composition. Compared with control, metformin treatment increased amplicon sequence variants for Escherichia (confirmed as Escherichia coli by metagenomic sequencing) and Ruminococcus torques and decreased Intestinibacter bartlettii at both 6 and 12 months and decreased the genus Roseburia, including R. faecis and R. intestinalis, at 12 months. Effects were similar in comparison of the metformin group with the behavioral weight loss group. Metformin versus control also increased butyrate, acetate, and valerate at 6 months (but not at 12 months). Behavioral weight loss versus control did not significantly alter microbiota composition but did increase acetate at 6 months (but not at 12 months). Increases in acetate were associated with decreases in fasting insulin. Additional whole-genome metagenomic sequencing of a subset of the metformin group showed that metformin altered 62 metagenomic functional pathways, including an acetate-producing pathway and three pathways in glucose metabolism.
Conclusions: Metformin, but not behavioral weight loss, impacted gut microbiota composition at 6 months and 12 months. Both metformin and behavioral weight loss altered circulating SCFAs at 6 months, including increasing acetate, which correlated with lower fasting insulin. Future research is needed to elucidate whether the gut microboime mediates or modifies metformin's health effects.
Trial registration: ClinicalTrials.gov NCT02431676.
© 2021 by the American Diabetes Association.
Figures
References
-
- Inzucchi SE, Bergenstal RM, Buse JB, et al.; American Diabetes Association (ADA); European Association for the Study of Diabetes (EASD) . Management of hyperglycemia in type 2 diabetes: a patient-centered approach: position statement of the American Diabetes Association (ADA) and the European Association for the Study of Diabetes (EASD). Diabetes Care 2012;35:1364–1379 - PMC - PubMed
-
- Bailey CJ, Wilcock C, Scarpello JH. Metformin and the intestine. Diabetologia 2008;51:1552–1553 - PubMed
-
- Bonora E, Cigolini M, Bosello O, et al. Lack of effect of intravenous metformin on plasma concentrations of glucose, insulin, C-peptide, glucagon and growth hormone in non-diabetic subjects. Curr Med Res Opin 1984;9:47–51 - PubMed
-
- Buse JB, DeFronzo RA, Rosenstock J, et al. The primary glucose-lowering effect of metformin resides in the gut, not the circulation: results from short-term pharmacokinetic and 12-week dose-ranging studies. Diabetes Care 2016;39:198–205 - PubMed
Publication types
MeSH terms
Substances
Associated data
Grants and funding
LinkOut - more resources
Full Text Sources
Other Literature Sources
Medical
