. 2021 Jun 23;41(25):5440-5452.
doi: 10.1523/JNEUROSCI.2912-20.2021. Epub 2021 May 18.

Region-Specific and State-Dependent Astrocyte Ca2+ Dynamics during the Sleep-Wake Cycle in Mice

Affiliations

Region-Specific and State-Dependent Astrocyte Ca2+ Dynamics during the Sleep-Wake Cycle in Mice

Tomomi Tsunematsu et al. J Neurosci. .

Abstract

Neural activity is diverse, and varies depending on brain regions and sleep/wakefulness states. However, whether astrocyte activity differs between sleep/wakefulness states, and whether there are differences in astrocyte activity among brain regions remain poorly understood. Therefore, in this study, we recorded astrocyte intracellular calcium (Ca2+) concentrations of mice during sleep/wakefulness states in the cortex, hippocampus, hypothalamus, cerebellum, and pons using fiber photometry. For this purpose, male transgenic mice expressing the genetically encoded ratiometric Ca2+ sensor YCnano50 specifically in their astrocytes were used. We demonstrated that Ca2+ levels in astrocytes substantially decrease during rapid eye movement (REM) sleep, and increase after the onset of wakefulness. In contrast, differences in Ca2+ levels during non-REM (NREM) sleep were observed among the different brain regions, and no significant decrease was observed in the hypothalamus and pons. Further analyses focusing on the transition between sleep/wakefulness states and correlation analysis with the duration of REM sleep showed that Ca2+ dynamics differs among brain regions, suggesting the existence of several clusters, i.e., the first comprising the cortex and hippocampus, the second comprising the hypothalamus and pons, and the third comprising the cerebellum. Our study thus demonstrated that astrocyte Ca2+ levels change substantially according to sleep/wakefulness states. These changes were consistent in general unlike neural activity. However, we also clarified that Ca2+ dynamics varies depending on the brain region, implying that astrocytes may play various physiological roles in sleep.SIGNIFICANCE STATEMENT Sleep is an instinctive behavior of many organisms. In the previous five decades, the mechanism of the neural circuits controlling sleep/wakefulness states and the neural activities associated with sleep/wakefulness states in various brain regions have been elucidated. However, whether astrocytes, which are a type of glial cell, change their activity during different sleep/wakefulness states was poorly understood. Here, we demonstrated that dynamic changes in astrocyte Ca2+ concentrations occur in the cortex, hippocampus, hypothalamus, cerebellum, and pons of mice during natural sleep. Further analyses demonstrated that Ca2+ dynamics slightly differ among different brain regions, implying that the physiological roles of astrocytes in sleep/wakefulness might vary depending on the brain region.

Keywords: astrocyte; calcium; sleep; wakefulness.


Figures

Figure 1.
Figure 1.
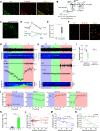
Astrocyte Ca2+ dynamics in the cerebellum during sleep/wakefulness states of mice. A, Immunohistochemical analysis demonstrating that YCnano50 is specifically expressed in cerebellar astrocytes in the Mlc1-tTA; TetO-YCnano50 bigenic mouse brain. Left, YFP fluorescence of YCnano50-positive cells (green). Middle, S100β-immunoreactive astrocytes (red). Left, Merged image (yellow). Scale bar: 40 µm. GL, granule cell layer; ML, molecular layer; PL, Purkinje cell layer. B, Schematic drawing showing the fiber photometry system used in this study. Fluorescence emission is applied from the LED light source. Yellow and cyan fluorescence signals were corrected by bandpass filters and enhanced by photomultipliers (PMT). C, The location of the glass optical fiber, which was implanted in the cerebellum of Mlc1-tTA; TetO-YCnano50 bigenic mice (6.0 mm posterior, 1.0 mm lateral from bregma, 0.5 mm depth from the brain surface). Scale bar: 1 mm. D, Example of Y/C ratios (top) and corresponding intensity changes of yellow and cyan fluorescence (bottom) recorded during tail pinch-induced locomotion in Mlc1-tTA; TetO-YCnano50 bigenic mice. The arrows indicate the timing of the tail pinch. E, Box plot summarizing the data from D. The Y/C ratios during locomotion were normalized using the Y/C ratio at 10 s immediately before the locomotion set as 1; *p < 0.05. F, Comparison of GFAP immunoreactivity (red) with (arrowheads) or without (arrows) YCnano50 expression (green) in the hippocampal astrocytes. Scale bar: 15 µm. G, H, Representative traces of EEG, EEG power density spectrum, EMG, cerebellar astrocyte Ca2+ signals (Y/C ratio), and Y/C ratio spectrogram in Mlc1-tTA; TetO-YCnano50 bigenic mice (G) and Mlc1-tTA monogenic mice (H). I, Box plot summarizing the data from G, H. Y/C ratios were normalized to the value of each episode, with the average value of awakening set as 1; *p < 0.05. J, Y/C ratios during the transitions between the sleep/wakefulness states. Transitions occurred at time 0. Data are from 4-s intervals characterized by state transitions. The line graph with the colored circles and gray circles are a summary of the data from Mlc1-tTA; TetO-YCnano50 bigenic mice and Mlc1-tTA monogenic mice, respectively; *p < 0.05 versus the fourth epoch immediately before the state transition. K, Bar graph representing the slope of the Y/C ratio of mice at the time of awakening from NREM sleep and REM sleep; *p < 0.05. LN, Analyses of the correlation between Y/C ratios and episode duration of wakefulness (L), NREM sleep (M), and REM sleep (N). Colored circles and gray circles indicate the summary of data from Mlc1-tTA; TetO-YCnano50 bigenic mice and Mlc1-tTA monogenic mice, respectively. NR, NREM sleep; R, REM sleep; W, wakefulness. Values are shown as means ± SEM.
Figure 2.
Figure 2.
Correlation between EEG/EMG and cerebellar astrocytic Ca2+ signals during different sleep/wakefulness states. AC, Correlation analyses between normalized (z-scored) cerebellar astrocytic Y/C ratios, and normalized (z-scored) EEG power densities in the δ (1–5 Hz), θ (6–10 Hz), α (10–13 Hz), β (13–25 Hz), and γ (30–50 Hz) waves during wakefulness (A), NREM sleep (B), and REM sleep (C). DF, Correlation analyses between normalized Y/C ratios and normalized rms of EMG during wakefulness (D), NREM sleep (E), and REM sleep (F). The data in this figure were analyzed in 1-s bin sizes. GI, Bar graphs showing correlation coefficients summarizing the data from A–F. The correlation coefficient of each recording was cross-validated by splitting the data into the first and second halves. Values are shown as means ± SEM.
Figure 3.
Figure 3.
Astrocyte Ca2+ dynamics during different sleep/wakefulness states in various brain regions. A, Images indicating the location of the glass optical fiber, which was implanted into the cortex, hippocampus, hypothalamus, and pons. Arrows indicates the tip of the optical fiber. Scale bar: 500 µm (cortex and hippocampus) and 1 mm (hypothalamus and pons). B, Box plot summarizing the data of the normalized Y/C ratios obtained from the cortex, hippocampus, hypothalamus, and pons; *p < 0.05. C, Y/C ratios for the transition of sleep/wakefulness states in multiple brain regions. Black filled symbols indicate p < 0.05 versus the fourth epoch immediately before state transition in each brain region. D, Correlation analyses between episode durations of REM sleep and Y/C ratios in the cortex, hippocampus, hypothalamus, and pons. NR, NREM sleep; R, REM sleep; W, wakefulness. Values are represented as means ± SEM.
Figure 4.
Figure 4.
Correlation of EEG/EMG and cortical astrocyte Ca2+ signals during different sleep/wakefulness states. AC, Correlation analyses between normalized (z-scored) Y/C ratios from the cortex and normalized (z-scored) EEG power densities in the δ (1–5 Hz), θ (6–10 Hz), α (10–13 Hz), β (13–25 Hz), and γ (30–50 Hz) waves during wakefulness (A), NREM sleep (B), and REM sleep (C). DF, Correlation analyses between normalized Y/C ratios and normalized rms of EMG during wakefulness (D), NREM sleep (E), and REM sleep (F). The data in this figure were analyzed using 1-s bin sizes. GI, Bar graphs showing correlation coefficients summarizing the data from A–F. The correlation coefficient of each recording was cross-validated by splitting the data into the first and second halves. Values are shown as means ± SEM.
Figure 5.
Figure 5.
Dynamics of Ca2+ signals during different sleep/wakefulness states and different brain regions. A, The mean profiles of Ca2+ signals during time-normalized episodes. In each panel, the duration of each episode was segmented into 5 bins and the mean normalized Y/C ratios were computed in various brain regions. B, Decoding performance of Ca2+ signals for different sleep/wakefulness states among various brain regions; *p < 0.05, F(5,17) = 6.10, one-way ANOVA with the post hoc HSD test. Values are shown as means ± SEM.

References

    1. Allen NJ (2014) Astrocyte regulation of synaptic behavior. Annu Rev Cell Dev Biol 30:439–463. 10.1146/annurev-cellbio-100913-013053 - DOI - PubMed
    1. Allen NJ, Eroglu C (2017) Cell biology of astrocyte-synapse interactions. Neuron 96:697–708. 10.1016/j.neuron.2017.09.056 - DOI - PMC - PubMed
    1. Araque A, Martín ED, Perea G, Arellano JI, Buño W (2002) Synaptically released acetylcholine evokes Ca2+ elevations in astrocytes in hippocampal slices. J Neurosci 22:2443–2450. 10.1523/JNEUROSCI.22-07-02443.2002 - DOI - PMC - PubMed
    1. Araque A, Carmignoto G, Haydon PG, Oliet SH, Robitaille R, Volterra A (2014) Gliotransmitters travel in time and space. Neuron 81:728–739. 10.1016/j.neuron.2014.02.007 - DOI - PMC - PubMed
    1. Batiuk MY, Martirosyan A, Wahis J, de Vin F, Marneffe C, Kusserow C, Koeppen J, Viana JF, Oliveira JF, Voet T, Ponting CP, Belgard TG, Holt MG (2020) Identification of region-specific astrocyte subtypes at single cell resolution. Nat Commun 11:1220. 10.1038/s41467-019-14198-8 - DOI - PMC - PubMed

Publication types

LinkOut - more resources