. 2021 May 25;118(21):e2008534118.
doi: 10.1073/pnas.2008534118.

Gender roles produce divergent economic expectations

Affiliations

Gender roles produce divergent economic expectations

Francesco D'Acunto et al. Proc Natl Acad Sci U S A. .

Abstract

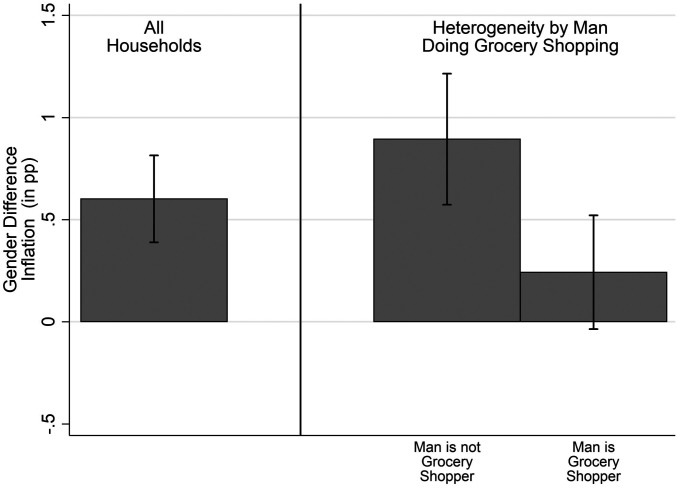
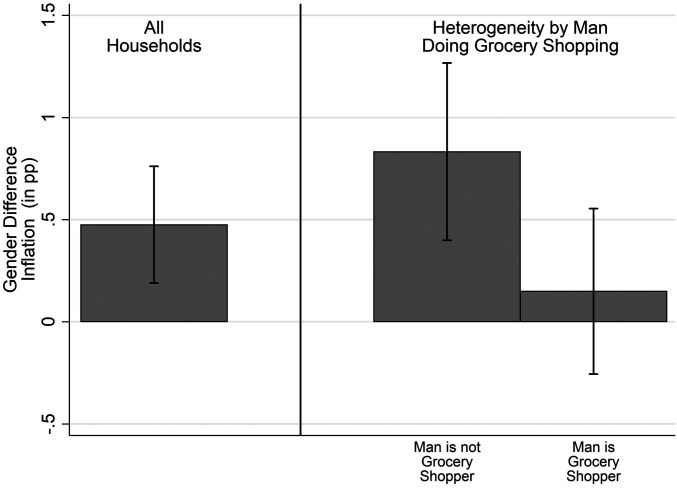
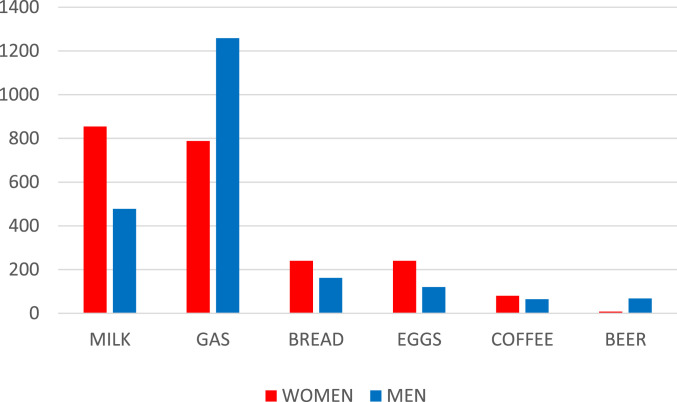
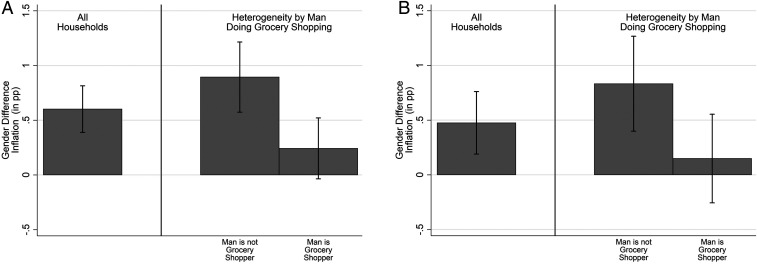
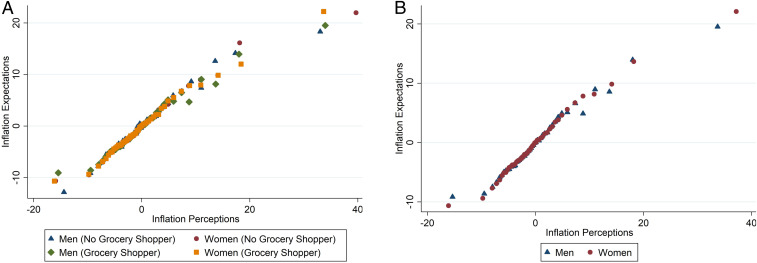
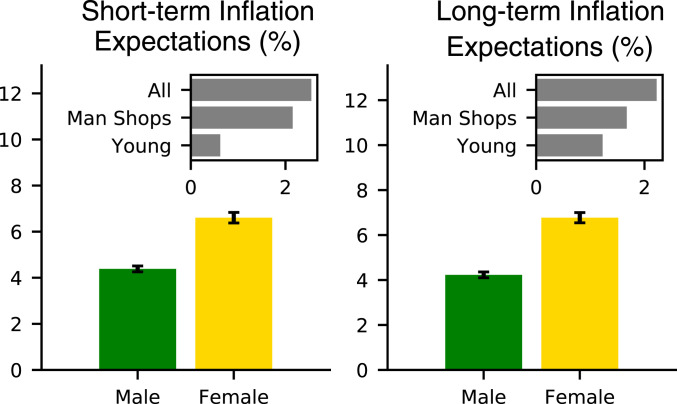
Expectations about economic variables vary systematically across genders. In the domain of inflation, women have persistently higher expectations than men. We argue that traditional gender roles are a significant factor in generating this gender expectations gap as they expose women and men to different economic signals in their daily lives. Using unique data on the participation of men and women in household grocery chores, their resulting exposure to price signals, and their inflation expectations, we document a tight link between the gender expectations gap and the distribution of grocery shopping duties. Because grocery prices are highly volatile, and consumers focus disproportionally on positive price changes, frequent exposure to grocery prices increases perceptions of current inflation and expectations of future inflation. The gender expectations gap is largest in households whose female heads are solely responsible for grocery shopping, whereas no gap arises in households that split grocery chores equally between men and women. Our results indicate that gender differences in inflation expectations arise due to social conditioning rather than through differences in innate abilities, skills, or preferences.

Keywords: expectations; experiences; gender roles; perceptions; social conditioning.


Conflict of interest statement

The authors declare no competing interest.

Figures

Fig. 1.
Fig. 1.
Gender expectations gap within households: raw data. Left bar plots the average differences in the inflation expectations of women and men within all households in the customized Chicago Booth Expectations and Attitudes Survey, which we fielded in June of 2015 and 2016. Center and Right bars split the sample based on whether men in the household take part in grocery shopping. Error bars indicate 95% confidence intervals obtained from standard errors clustered at the household level.
Fig. 2.
Fig. 2.
Gender expectations gap within households: residuals. Left bar plots the average differences in the inflation expectations of women and men within all households headed by heterosexual couples in our sample based on the customized Chicago Booth Expectations and Attitudes Survey, which we fielded in June of 2015 and 2016, conditional on controls. Control variables include age, square of age, employment status, 16 income dummies, home ownership, marital status, college dummy, four race dummies, reported risk tolerance, household fixed effects, individual income expectations, expectations for aggregate US growth, and individual expectations about financial soundness. Center and Right bars propose a sample split based on whether men in the household take part in grocery shopping. Error bars indicate 95% confidence intervals obtained from standard errors clustered at the household level.
Fig. 3.
Fig. 3.
Goods women and men think of when forming expectations. Shown is the absolute frequency (number of respondents, y axis) with which the men and women surveyed in the customized Chicago Booth Attitudes and Expectations Survey, which we fielded in June of 2015 and 2016, report specific goods as the first item whose price changes come to their mind when asked to provide their inflation expectations. We report the five most frequently reported goods for men and the five most frequently reported goods for women. The two quintuplets overlap except for one good.
Fig. 4.
Fig. 4.
Gender gap in inflation perceptions within households. A, Left bar plots the average differences in the inflation perceptions of women and men for all households in our sample based on the customized Chicago Booth Expectations and Attitudes Survey, which we fielded in June of 2015 and 2016. A, Center and Right bars right propose a sample split based on whether men in the household take part in grocery shopping. Error bars indicate 95% confidence intervals obtained from standard errors clustered at the household level. B presents gender differences defined as above conditional on controls. Control variables include age, square of age, employment status, 16 income dummies, home ownership, marital status, household size, college dummy, four race dummies, reported risk tolerance, household fixed effects, individual income expectations, expectations for aggregate US growth, and individual expectations about financial soundness.
Fig. 5.
Fig. 5.
Mapping of perceptions into expectations by gender and grocery shopping. A is a binscatter plot mapping inflation perceptions into inflation expectations by gender and B also conditions on grocery-shopping behavior. Inflation perceptions and expectations are based on the customized Chicago Booth Expectations and Attitudes Survey, which we fielded in June of 2015 and 2016.
Fig. 6.
Fig. 6.
Gender gap in inflation expectations: replication in the New York Fed Survey of Consumer Expectations. The vertical bars report the estimated mean for men (green, left bar) and women (yellow, right bar) of short-run and long-run inflation expectations elicited by the New York Fed Survey of Consumer Expectations (41). Black segments are 95% confidence intervals. Gray horizontal bars indicate the difference between the expectations of women and men for three groups: “All” includes the full sample; “man shops” includes only respondents in the top 25% of US states based on the share of men who are the main grocery shopper in the household, which we compute in the Chicago Booth Expectations and Attitudes Survey; “young” includes only respondents below 25 y of age; the two latter subsamples capture groups in which gender norms might be less stark than in the full sample.

References

    1. Bjuggren C. M., Elert N., Gender differences in optimism. Appl. Econ. 0, 1–14 (2019).
    1. Jacobsen B., Lee J. B., Marquering W., Zhang C. Y., Gender differences in optimism and asset allocation. J. Econ. Behav. Organ. 107, 630–651 (2014).
    1. Armantier O., et al. , Measuring inflation expectations. Annu. Rev. Econ. 5, 273–301 (2013).
    1. Bruine de Bruin W., et al. , Expectations of inflation: The role of demographic variables, expectation formation, and financial literacy. J. Consum. Aff. 44, 381–402 (2010).
    1. Di Tella R., MacCulloch R. J., Oswald A. J., Preferences over inflation and unemployment: Evidence from surveys of happiness. Am. Econ. Rev. 91, 335–341 (2001).

Publication types