. 2021 May 18;12(1):2915.
doi: 10.1038/s41467-021-23201-0.

Perfluoroalkyl substance pollutants activate the innate immune system through the AIM2 inflammasome

Affiliations

Perfluoroalkyl substance pollutants activate the innate immune system through the AIM2 inflammasome

Li-Qiu Wang et al. Nat Commun. .

Erratum in

Abstract

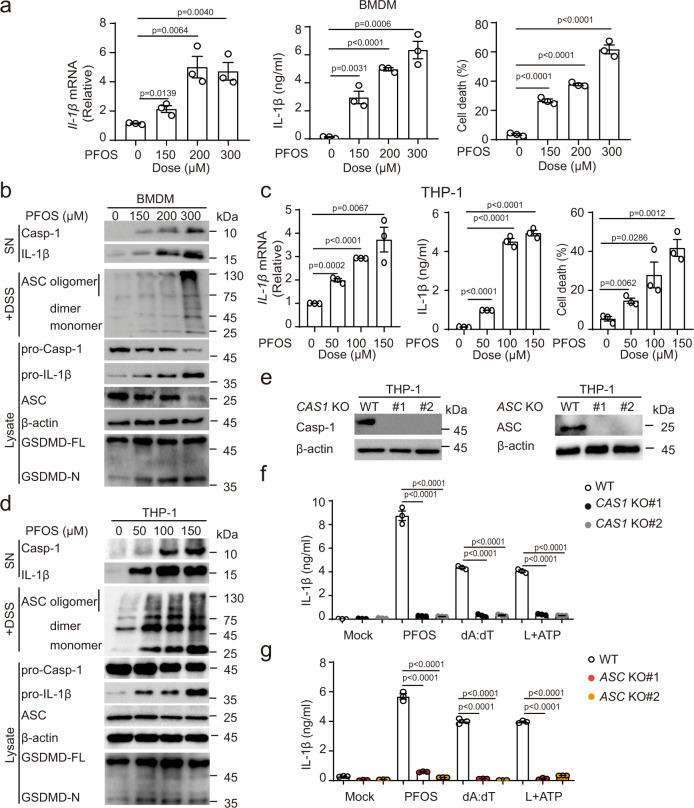
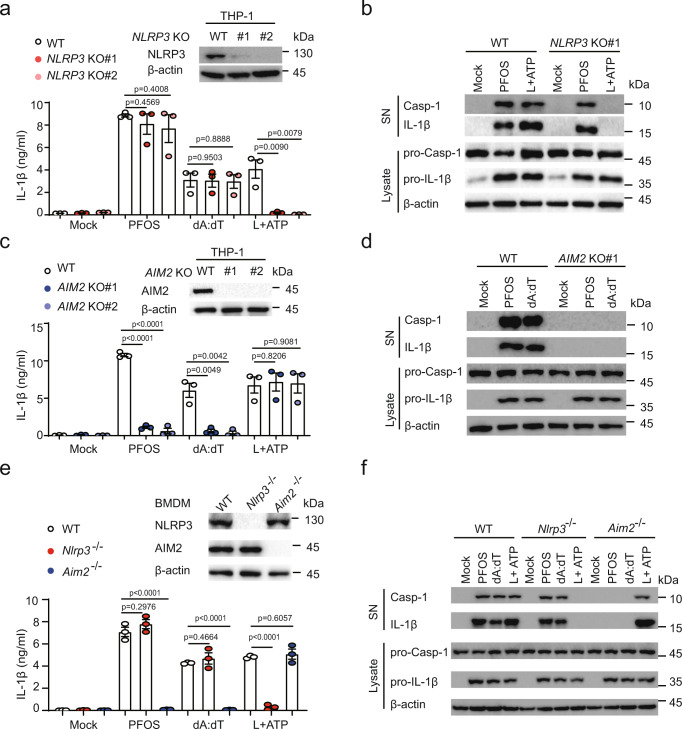
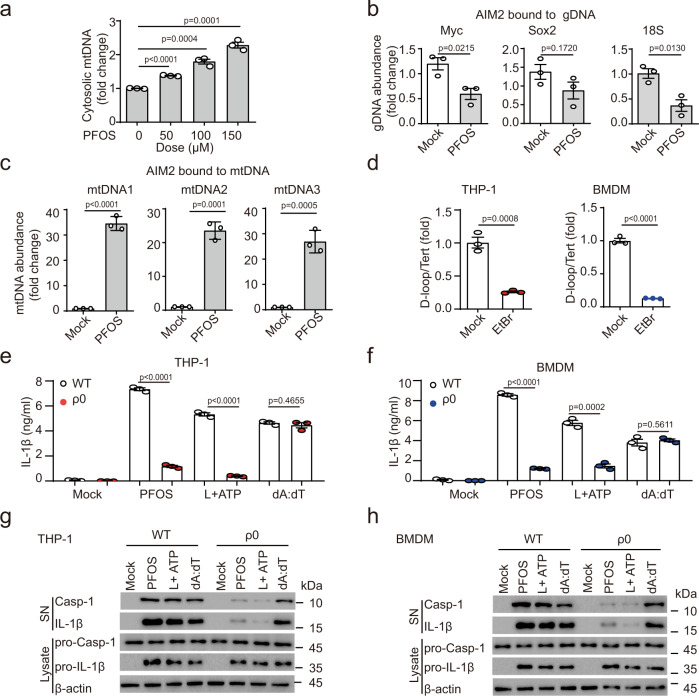
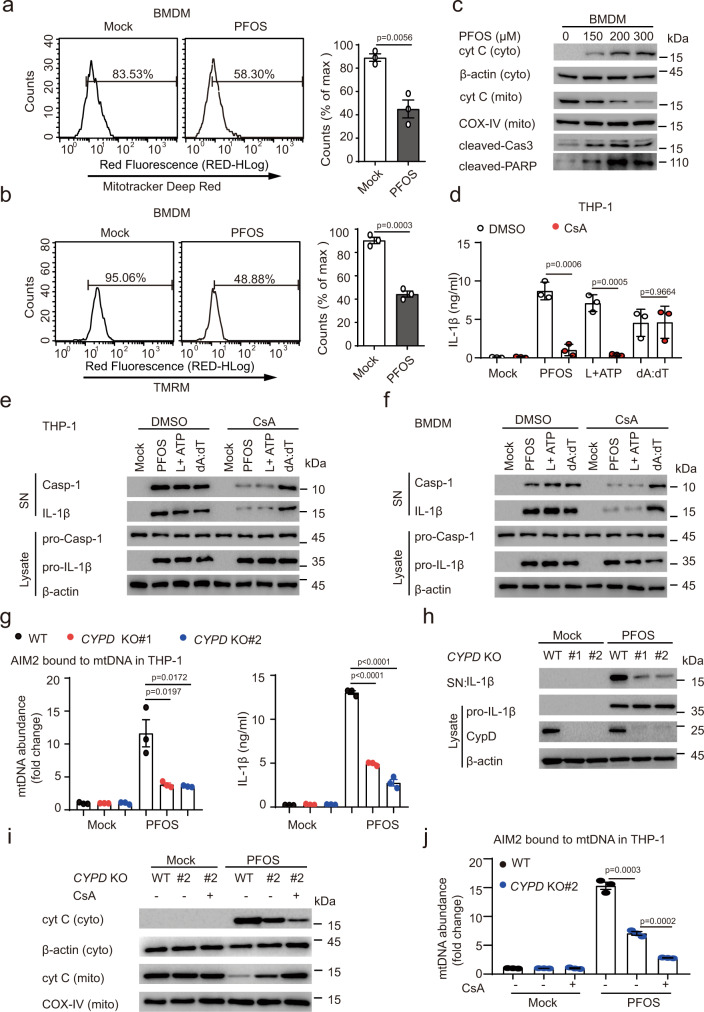
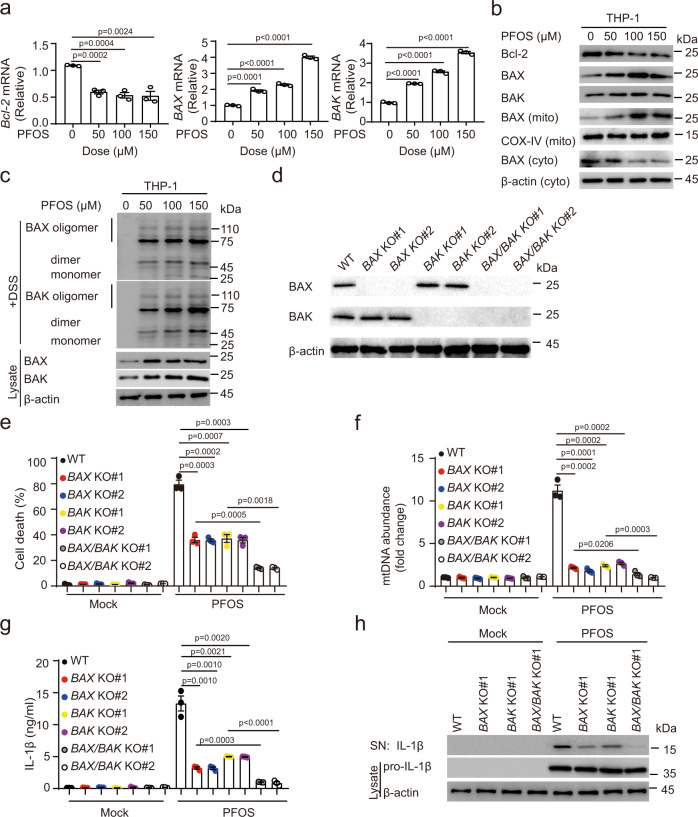
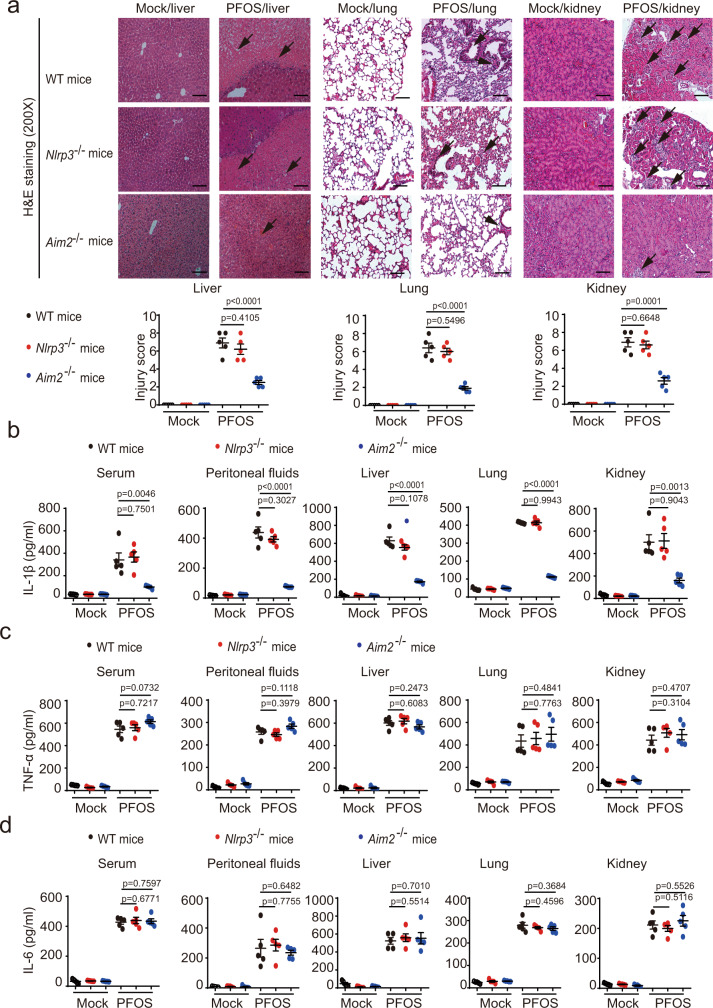
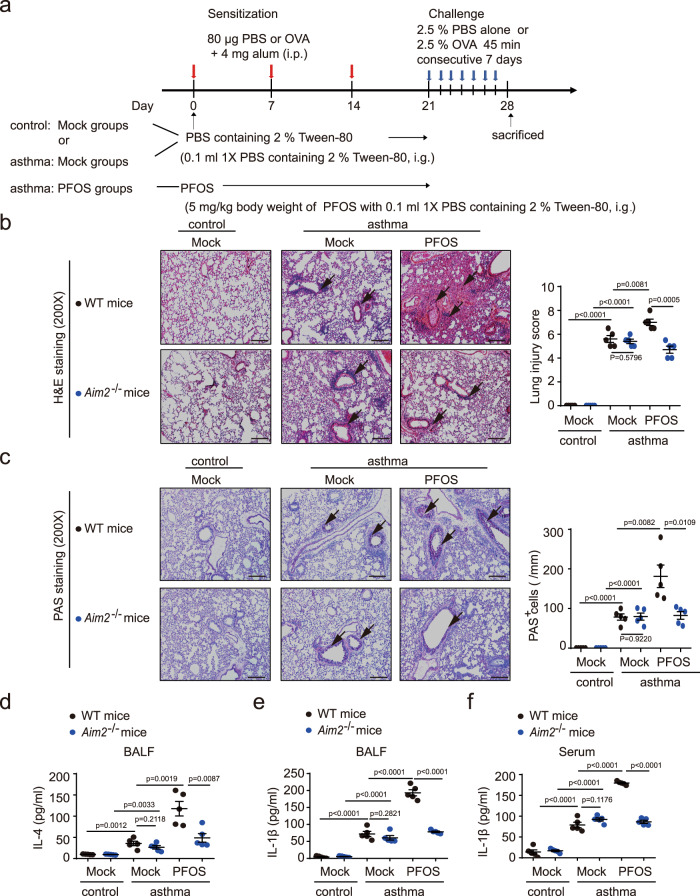
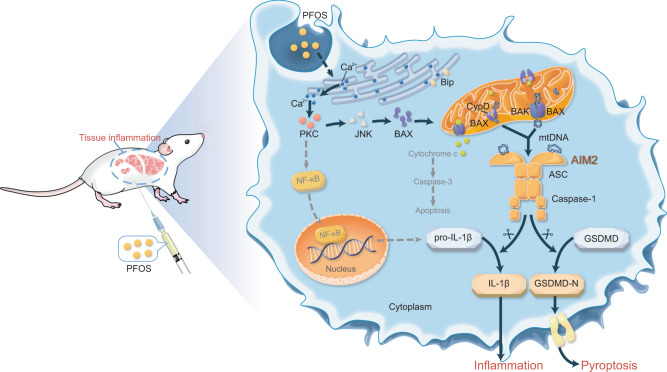
Perfluoroalkyl substances (PFAS) are widely used in various manufacturing processes. Accumulation of these chemicals has adverse effects on human health, including inflammation in multiple organs, yet how PFAS are sensed by host cells, and how tissue inflammation eventually incurs, is still unclear. Here, we show that the double-stranded DNA receptor AIM2 is able to recognize perfluorooctane sulfonate (PFOS), a common form of PFAS, to trigger IL-1β secretion and pyroptosis. Mechanistically, PFOS activates the AIM2 inflammasome in a process involving mitochondrial DNA release through the Ca2+-PKC-NF-κB/JNK-BAX/BAK axis. Accordingly, Aim2-/- mice have reduced PFOS-induced inflammation, as well as tissue damage in the lungs, livers, and kidneys in both their basic condition and in an asthmatic exacerbation model. Our results thus suggest a function of AIM2 in PFOS-mediated tissue inflammation, and identify AIM2 as a major pattern recognition receptor in response to the environmental organic pollutants.


Conflict of interest statement

The authors declare no competing interests.

Figures

Fig. 1
Fig. 1. PFOS triggers caspase-1 activation and IL-1β secretion in macrophages.
a, b Bone marrow-derived macrophages (BMDMs) were treated with PFOS in indicated dose points for 6 h, cell lysates were collected to determine mRNA levels of IL-1β, and cell supernatants were collected to measure IL-1β secretion and cell death (a). Immunoblot analysis of of caspase-1 activation and IL-1β maturation in the supernatants, and ASC oligomerization, pro-caspase-1, pro-IL-1β, and GSDMD cleavage in the lysates of PFOS-treated BMDMs (b). c, d PMA-differentiated THP-1 cells (THP-1-derived macrophages) were stimulated with PFOS as indicated for 6 h. Cell lysates were harvested to analyze mRNA levels of IL-1β, and cell supernatants were collected to determine IL-1β and IL-18 production, and cell death (c). Immunoblot analysis of caspase-1 activation and IL-1β maturation in the supernatants, and ASC oligomerization, pro-caspase-1, pro-IL-1β, and GSDMD cleavage in the lysates of PFOS-treated THP-1-derived macrophages (d). e Knockout (KO) efficiency of CASPASE-1 (CAS1) KO and ASC KO THP-1-derived macrophages were evaluated by immunoblot. f, g IL-1β secretion from wild type (WT), two clones of CAS1 KO (KO#1: black plots, KO#2: gray plots) (f) or ASC KO (KO#1: red plots; KO#2: orange plots) (g) THP-1-derived macrophages was determined by ELISA. The cells were treated with PFOS (150 μM, 6 h) or poly (dA:dT) (2 μg/ml, 6 h) or pre-treated with LPS (200 ng/ml, 3 h) followed by ATP (5 mM, 6 h). In a, c, f and g, all error bars, mean values ± SEM, P-values were determined by unpaired two-tailed Student’s t test of n = 3 independent biological experiments. For b, d and e, similar results are obtained for three independent biological experiments. Source data are provided as a Source data file.
Fig. 2
Fig. 2. PFOS specifically activates AIM2 inflammasome.
ad Wild type (WT) or indicated NLRP3 knockout (KO#1: deep red plots; KO#2: light red plots) THP-1-derived macrophages (a, b) or AIM2 KO (KO#1: deep blue plots; KO#2: light blue plots) THP-1-derived macrophages (c, d) were treated with PFOS (150 μM, 6 h), poly (dA:dT) (2 μg/ml, 6 h) or pre-treated with LPS (200 ng/ml, 3 h) before ATP (5 mM, 6 h). IL-1β release was measured in the supernatants by ELISA (a, c). Cell lysates and supernatants were harvested for immunoblot (b, d). e, f WT, Nlrp3−/− (red plots) or Aim2−/− (blue plots) Bone marrow-derived macrophages (BMDMs) were treated with indicated stimulations, and supernatants were collected to determine IL-1β production by ELISA (e), cell extracts and supernatants were collected for immunoblot (f). In a, c and e, all error bars, mean values ± SEM, P-values were determined by unpaired two-tailed Student’s t test of n = 3 independent biological experiments. For b, d and f, similar results are obtained for three independent biological experiments. Source data are provided as a Source data file.
Fig. 3
Fig. 3. PFOS-induced mtDNA accumulation triggers AIM2 inflammasome activation.
a mtDNA amount from cytosolic extracts derived from THP-1-derived macrophages stimulated with PFOS was detected by qRT-PCR. b, c Relative enrichment of DNA in AIM2-pulldown material from Mock or PFOS (150 μM, 6 h) condition. qRT-PCR for three sets of primers that amplify fragments from different regions of the human genomic gDNA (b) or mtDNA (c). d mtDNA amount of total DNA extractions from THP-1-derived macrophages or bone marrow-derived macrophages (BMDMs) treated for 7 days without or with ethidium bromide (EtBr). eh ELISA analysis of IL-1β secretion from supernatants of THP-1-derived macrophages (e, red plots) or BMDMs (f, blue plots) depleted of mtDNA and stimulated with PFOS (150 μM, 6 h), poly (dA:dT) (2 μg/ml, 6 h) or pre-treated with LPS (200 ng/ml, 3 h) followed by ATP (5 mM, 6 h). The cleavage of caspase-1 (p10) and the maturation of IL-1β (p17) in the cell supernatants or pro-Casp1 and pro-IL-1β in the cell lysates of THP-1-derived macrophages (g) or Bone marrow-derived macrophages (BMDMs) (h) depleted of mtDNA were determined by immunoblot. In af, all error bars, mean values ± SEM, P-values were determined by unpaired two-tailed Student’s t test of n = 3 independent biological experiments. For g and h, similar results are obtained for three independent biological experiments. Source data are provided as a Source data file.
Fig. 4
Fig. 4. PFOS induces mitochondrial dysfunction and apoptosis in macrophages.
a, b Bone marrow-derived macrophages (BMDMs) were treated with PFOS (150 μM, 6 h), then the cells were stained with Mitotracker deep red (a) or tetramethylrhodamine methyl ester (TMRM) (b) to detect the mitochondrial respiration and membrane potential by flow cytometry, respectively. c Immunoblot analysis of Cytochrome c release and apoptosis in BMDMs as indicated treatment. d, e THP-1-derived macrophages were treated with DMSO or cyclosporine A (50 μM, red plots) for 1 h followed by PFOS (150 μM, 6 h), poly (dA:dT) (2 μg/ml, 6 h) treatment or pre-treated with LPS (200 ng/ml, 3 h) followed ATP (5 mM, 6 h) treatment. IL-1β secretion in the supernatants of the indicated THP-1-derived macrophages were determined by ELISA (d). The caspase-1 activation (p10) and IL-1β maturation (p17) in the cell supernatants or pro-caspase-1 and pro-IL-1β in the cell lysates were detected by immunoblot (e). f Immunoblot analysis of the supernatants and cell extracts of BMDMs pre-treated with DMSO or cyclosporine A (50 μM) for 1 h. BMDMs were then treated with PFOS (150 μM, 6 h), poly (dA:dT) (2 μg/ml, 6 h) or pre-treated with LPS (200 ng/ml, 3 h) followed ATP (5 mM, 6 h) treatment. g, h Wild type (WT, black plots), CYPD knockout (KO#1: red plots; KO#2: blue plots) THP-1-derived macrophages were treated with PFOS (150 μM) for 6 h. Relative enrichment of mtDNA in AIM2-pulldown material were determined (g). IL-1β production in the supernatants were measured by ELISA (g). The maturation of IL-1β in the supernatants or pro- IL-1β and CypD in lysates were detected by immunoblot (h). i, j Immunoblot analysis of Cytochrome c from cytosolic extracts and mitochondria from indicated cells pre-treated with DMSO or cyclosporine A (50 μM) for 1 h, followed with PFOS treatment (150 μM, 6 h) (i). Relative enrichment of mtDNA in AIM2-pulldown material from the THP-1-derived macrophages (WT, black plots; CYPD KO#2: blue plots) were checked (j). In a, b, d, g and j, all error bars, mean values ± SEM, P-values were determined by unpaired two-tailed Student’s t test of n = 3 independent biological experiments. For c, e, f, h and i, similar results are obtained for three independent biological experiments. Source data are provided as a Source data file.
Fig. 5
Fig. 5. PFOS-induced BAX/BAK oligomerization contributes to mtDNA release.
a THP-1-deirived macrophages were treated with PFOS as indicated for 6 h, cell lysates were collected to detect the mRNA levels of BCL-2, BAX, and BAK. b Immunoblot analysis of mitochondrial apoptosis pathway and BAX translocation in THP-1-derived macrophages treated as indicated. c Cell lysates and crosslinked pellets from THP-1-derived macrophages treated as indicated were analyzed by immunoblotting for BAX/BAK oligomerization. dh Wild type (WT, black plots), BAX knockout (KO#1: red plots; KO#2: blue plots), BAK KO (KO#1: yellow plots; KO#2: purple plots) and BAX/BAK double KO (KO#1: gray plots; KO#2: white plots) THP-1-derived macrophages were generated (d). The indicated cells were treated with PFOS (150 μM) for 6 h. The cell death was determined by detecting the LDH release in the supernatants (e). Relative enrichment of mtDNA in AIM2-pulldown material was determined (f). IL-1β production in the supernatants was measured by ELISA (g). The maturation of IL-1β in the supernatants and pro-IL-1β in lysates were detected by immunoblot (h). In a and eg, all error bars, mean values ± SEM, P-values were determined by unpaired two-tailed Student’s t test of n = 3 independent biological experiments. For b, c, d and h, similar results are obtained for three independent biological experiments. Source data are provided as a Source data file.
Fig. 6
Fig. 6. The effects of AIM2 inflammasome on PFOS-induced inflammatory responses in vivo.
ad Wild type (WT), Nlrp3−/− (red plots) or Aim2−/− (blue plots) mice (female, 6 weeks old) were i.p. with PBS containing 2% Tween-80 (Mock, n = 5) or PFOS (dissolved in PBS containing 2% Tween-80, n = 5). In order to better show the protective role of inflammasome component deficiency in the presence of PFOS exposure, the dose of PFOS in this model we used was 25 mg/kg body weight per day. At 5 days post-treatment, liver tissue, lung tissue, and kidney tissue of these mice were stained with hematoxylin-eosin (H&E) and assayed using a light microscope with ×200 magnification. Scale bar, 100 μm. The tissue (liver, lung, and kidney) injury score was determined and averaged in 5 randomly selected nonoverlapping fields from respective individual mouse tissue sections. All histology analyses were conducted in a blinded manner (a). At 5 days post-treatment, the serum and peritoneal fluids were collected to determine the level of IL-1β (b), TNF-α (c), and IL-6 (d) by ELISA. The liver, lung, and kidney of treated mice were isolated and cultured for 24 h, and the secretion of IL-1β (b), TNF-α (c), and IL-6 (d) in the supernatants were detected by ELISA. In bd, all error bars, mean values ± SD, P-values were determined by unpaired two-tailed Student’s t test (n = 5 independent biological mice per group). Source data are provided as a Source data file.
Fig. 7
Fig. 7. AIM2 inflammasome plays a critical role in PFOS-induced allergic asthma exacerbation.
a The model of PFOS-induced allergic asthma exacerbation. bf Wild type (WT, black plots) or Aim2−/− (blue plots) mice undergone intragastric administration with PBS or PFOS followed by OVA challenge, were sacrificed 24 h after the final OVA challenge. H&E staining (b) and periodic acid-Schiff (PAS) staining (c) of lung tissue were assayed using a light microscope with ×200 magnification. BALF or serum was collected 24 h after the final OVA challenge and ELISA analysis of IL-4 (d) in the BALF and IL-1β in the BALF (e) or serum (f). Scale bar, 100 μm. The lung injury scores and the number of PAS-positive cells per unit of length (mm) of the basement membrane were determined and averaged in five randomly selected nonoverlapping fields from respective individual mouse tissue sections. All histology analyses were conducted in a blinded manner. In df, all error bars, mean values ± SD, P-values were determined by unpaired two-tailed Student’s t test (n = 5 independent biological mice per group). Source data are provided as a Source data file.
Fig. 8
Fig. 8. Schematic diagram to illustrate the mechanisms that PFOS exposure induces AIM2 inflammasome activation to promote tissue damage.
PFOS induces mitochondrial DNA (mtDNA) release through the Ca2+-PKC-NF-κB/JNK-BAX/BAK axis; and PFOS-induced mtDNA serves as an essential danger-associated molecular pattern (DAMP) to trigger AIM2 inflammation activation, ultimately leading to tissue inflammation.

References

    1. Lindstrom AB, Strynar MJ, Libelo EL. Polyfluorinated compounds: past, present future. Environ. Sci. Technol. 2011;45:7954–7961. - PubMed
    1. Sunderland EM, et al. A review of the pathways of human exposure to poly- and perfluoroalkyl substances (PFASs) and present understanding of health effects. J. Expo. Sci. Environ. Epidemiol. 2019;29:131–147. - PMC - PubMed
    1. Boiteux V, et al. Concentrations and patterns of perfluoroalkyl and polyfluoroalkyl substances in a river and three drinking water treatment plants near and far from a major production source. Sci. Total Environ. 2017;583:393–400. - PubMed
    1. Cao W, et al. Perfluoroalkyl substances in umbilical cord serum and gestational and postnatal growth in a Chinese birth cohort. Environ. Int. 2018;116:197–205. - PubMed
    1. Chang ET, Adami HO, Boffetta P, Wedner HJ, Mandel JS. A critical review of perfluorooctanoate and perfluorooctanesulfonate exposure and immunological health conditions in humans. Crit. Rev. Toxicol. 2016;46:279–331. - PMC - PubMed

Publication types

MeSH terms

LinkOut - more resources