. 2021 May 18;12(6):504.
doi: 10.1038/s41419-021-03792-8.

TRPV1 alleviates osteoarthritis by inhibiting M1 macrophage polarization via Ca2+/CaMKII/Nrf2 signaling pathway

Affiliations

TRPV1 alleviates osteoarthritis by inhibiting M1 macrophage polarization via Ca2+/CaMKII/Nrf2 signaling pathway

Zhongyang Lv et al. Cell Death Dis. .

Abstract

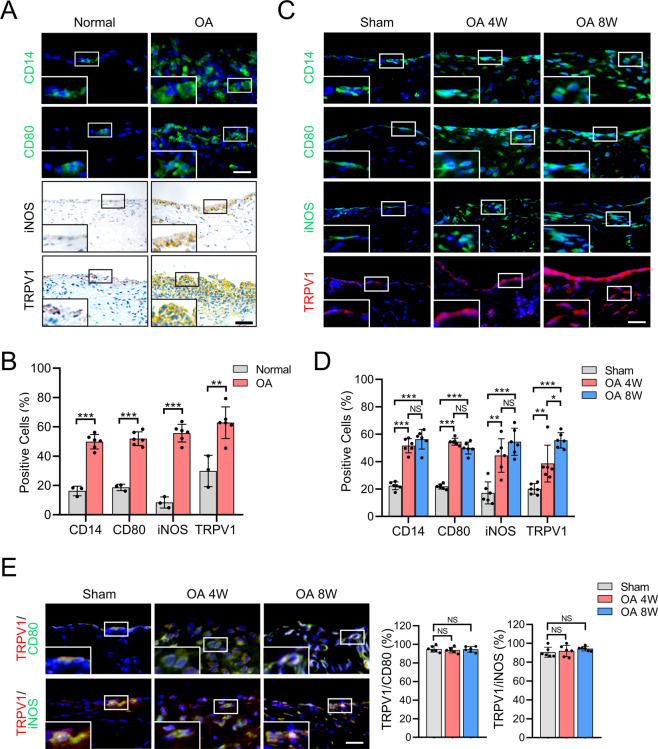
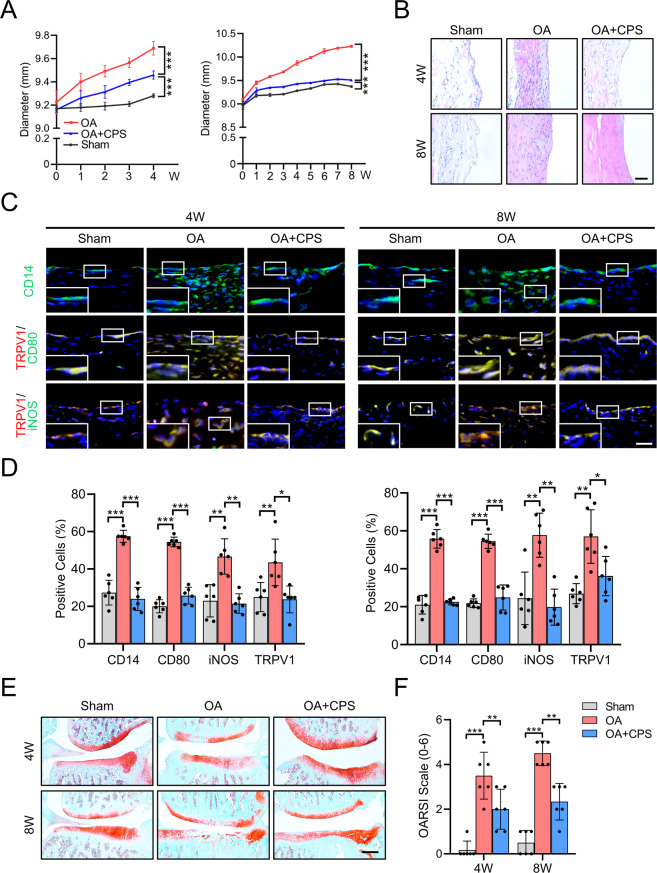
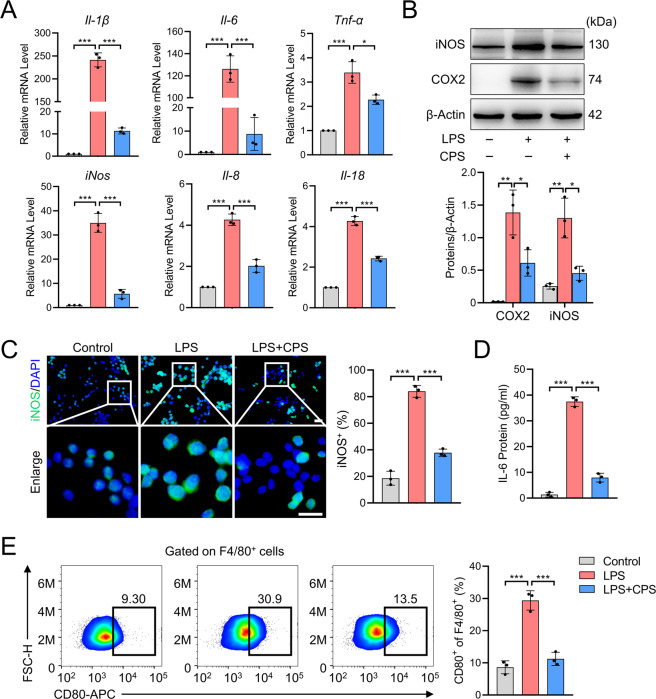
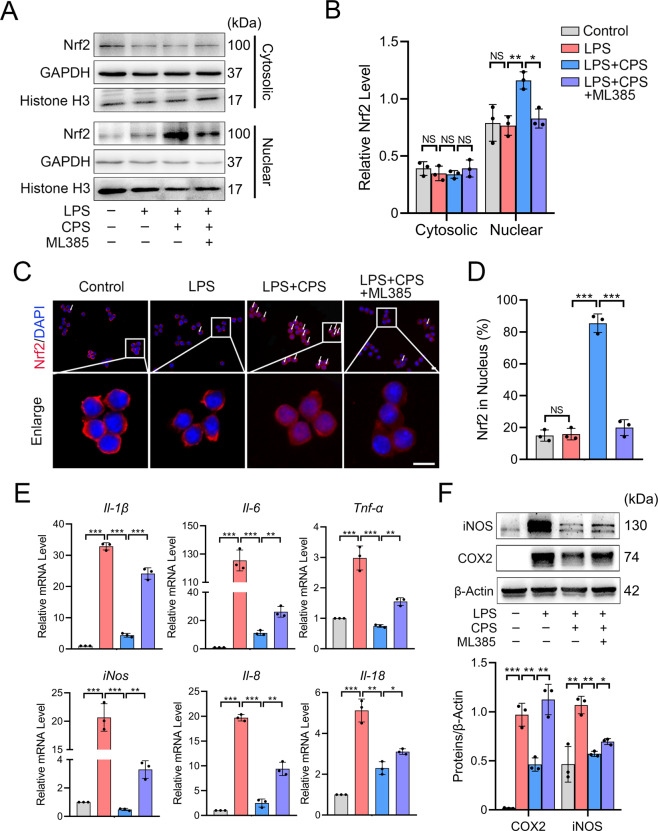
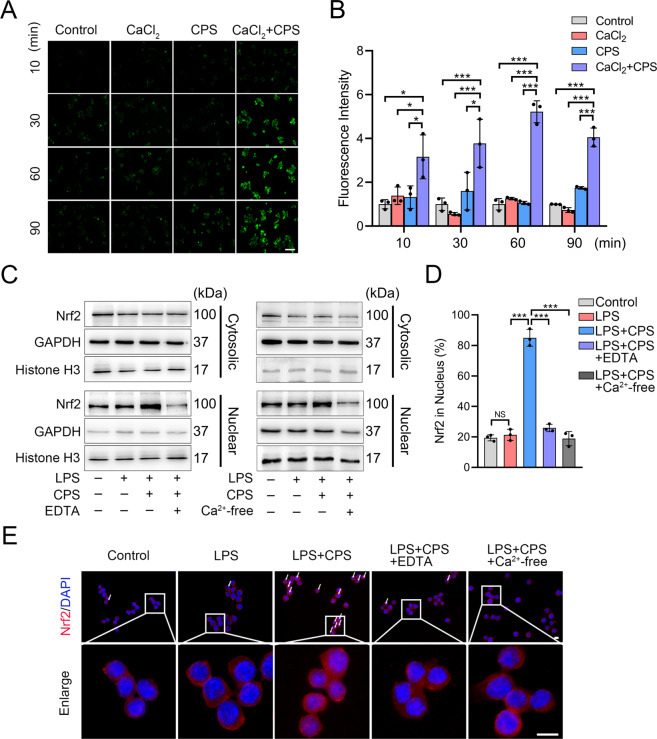
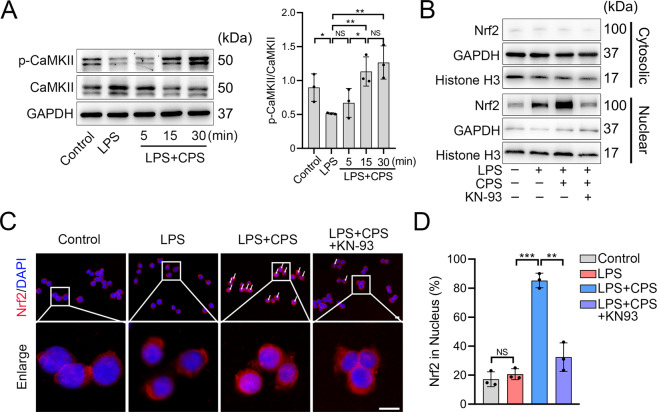
Osteoarthritis (OA) is the major course of joint deterioration, in which M1 macrophage-driven synovitis exacerbates the pathological process. However, precise therapies for M1 macrophage to decrease synovitis and attenuate OA progression have been scarcely proposed. Transient receptor potential vanilloid 1 (TRPV1) is a cation channel that has been implicated in pain perception and inflammation. In this study, we investigated the role of TRPV1 in the M1 macrophage polarization and pathogenesis of OA. We demonstrated that TRPV1 expression and M1 macrophage infiltration were simultaneously increased in both human and rat OA synovium. More than 90% of the infiltrated M1 macrophages expressed TRPV1. In the rat OA model, intra-articular injection of capsaicin (CPS), a specific TRPV1 agonist, significantly attenuated OA phenotypes, including joint swelling, synovitis, cartilage damage, and osteophyte formation. CPS treatment markedly reduced M1 macrophage infiltration in the synovium. Further mechanistic analyses showed that TRPV1-evoked Ca2+ influx promoted the phosphorylation of calcium/calmodulin-dependent protein kinase II (CaMKII) and facilitated the nuclear localization of nuclear factor-erythroid 2-related factor 2 (Nrf2), which ultimately resulted in the inhibition of M1 macrophage polarization. Taken together, our findings establish that TRPV1 attenuates the progression of OA by inhibiting M1 macrophage polarization in synovium via the Ca2+/CaMKII/Nrf2 signaling pathway. These results highlight the effect of targeting TRPV1 for the development of a promising therapeutic strategy for OA.


Conflict of interest statement

The authors declare no competing interests.

Figures

Fig. 1
Fig. 1. TRPV1 expression and M1 macrophage infiltration in the synovium of OA patients and rat OA model.
A Immunofluorescence images for CD14 and CD80 staining, and immunohistochemical staining for iNOS and TRPV1 in normal and OA human synovium. B Quantification of CD14-, CD80-, iNOS-, and TRPV1-positive cells as a proportion of total cells in normal (n = 3) and OA (n = 6) human synovium. C Immunofluorescence images for CD14, CD80, iNOS, and TRPV1 in the synovium of sham and rats at 4 and 8 weeks after the radial transection of the medial meniscus. D Quantification of CD14-, CD80-, iNOS-, and TRPV1-positive cells as a proportion of total cells in the synovium of sham and 4- and 8-week-old OA rats (n = 6). E Co-immunostaining of TRPV1 with CD80 or iNOS in the synovium of sham and 4- and 8-week-old OA rats, and quantitative analysis of TRPV1-positive macrophages compared to total CD80- or iNOS-positive cells in the synovium of sham and 4- and 8-week-old OA rats (n = 6). Enlarged image is in the boxed area in the bottom left corner. Scale bars: 25 μm. Data are shown as mean ± SD. *P < 0.05; **P < 0.01; ***P < 0.001; NS nonsignificant.
Fig. 2
Fig. 2. TRPV1 alleviates OA by inhibiting M1 macrophage polarization in vivo.
A Time course of rat knee joint diameter in the sham, OA, and OA + CPS groups until 4 (left) and 8 (right) weeks after the radial transection of the medial meniscus. B H&E staining of the synovium in the 4- and 8-week-old sham, OA, and OA + CPS groups. Scale bars: 100 μm. C Immunofluorescence of CD14 and co-immunostaining of CD80 and iNOS with TRPV1 in the 4 and 8 weeks of sham, OA, and OA + CPS groups. Scale bars: 25 μm. Enlarged image is in the boxed area in the bottom left corner. D Quantification of CD14-, CD80-, iNOS-, and TRPV1-positive cells as a proportion of total cells in the synovium of 4- (left panel) and 8- (right panel) week sham, OA, and OA + CPS groups. E SO staining of the knee joint of 4- and 8-week-old sham, OA, and OA + CPS groups. F Quantitative analysis of the OARSI scale of 4- and 8-week-old sham, OA, and OA + CPS groups. Data (n = 6) are shown as mean ± SD. *P < 0.05; **P < 0.01; ***P < 0.001. W week, SO Safranin O/fast green.
Fig. 3
Fig. 3. TRPV1 inhibits M1 macrophage polarization in RAW264.7 cells.
A qPCR analysis of mRNA levels of M1 macrophage markers in the cells treated with LPS with or without CPS for 24 h. B Western blot and quantitative analysis of iNOS and COX2 proteins in the cells treated with LPS with or without CPS for 48 h. C Immunofluorescence and quantitative analysis of iNOS in RAW264.7 cells treated with LPS with or without CPS for 48 h. D ELISA analysis of IL-6 levels in the supernatant of the culture medium of RAW264.7 cells treated with LPS with or without CPS for 48 h. E Flow cytometry for detection and quantitative analysis of F4/80+CD80+ cells after the treatment of LPS with or without CPS for 48 h. Data (n = 3) are shown as mean ± SD. *P < 0.05; **P < 0.01; ***P < 0.001. Scale bars: 25 μm.
Fig. 4
Fig. 4. TRPV1 promotes the nuclear translocation of Nrf2 and inhibits M1 macrophage polarization in RAW264.7 cells.
A Western blot and B quantitative analysis of cytosolic and nuclear Nrf2 protein levels in cells treated with LPS and LPS + CPS with or without ML385 for 3 h. C Immunofluorescence image of Nrf2 and D its quantitative analysis in RAW264.7 cells treated with LPS and LPS + CPS with or without ML385 for 3 h. White arrow: cells with Nrf2 nuclear translocation. E qPCR analysis of mRNA levels of M1 macrophage markers in RAW264.7 cells treated with LPS and LPS + CPS with or without ML385 for 24 h. F Western blot and quantitative analysis of iNOS and COX2 protein expression levels in RAW264.7 cells treated with LPS and LPS + CPS with or without ML385 for 48 h. Data (n = 3) are shown as mean ± SD. *P < 0.05; **P < 0.01; ***P < 0.001. Scale bars: 10 μm. NS nonsignificant.
Fig. 5
Fig. 5. TRPV1-mediated Ca2+ influx promotes Nrf2 nuclear translocation in RAW264.7 cells.
A Fluorescence images and B their quantitative analysis of intensity in the Fluo-4 AM-loaded RAW264.7 cells treated with CaCl2, CPS, or CaCl2 + CPS under the Ca2+-free medium for 10, 30, 60, and 90 min. Scale bars: 50 μm. C Western blot analysis of cytosolic and nuclear Nrf2 protein levels in the cells treated with LPS, LPS + CPS, and LPS + CPS with EDTA (left) or Ca2+-free medium (right) for 3 h. D Quantitative analysis and E representative images of Nrf2 immunofluorescence in the cells treated with LPS, LPS + CPS, and LPS + CPS with EDTA or Ca2+-free medium for 3 h. Scale bars: 10 μm. White arrow: cells with Nrf2 nuclear translocation. Data (n = 3) are shown as mean ± SD. *P < 0.05; ***P < 0.001; NS nonsignificant.
Fig. 6
Fig. 6. CaMKII mediates the TRPV1-promoted Nrf2 nuclear translocation in RAW264.7 cells.
A Western blot and quantitative analyses of CaMKII and p-CaMKII protein levels in the cells treated with LPS with or without CPS for 5, 15, and 30 min. B Western blot analysis of cytosolic and nuclear Nrf2 protein levels in the cells treated with LPS and LPS + CPS with or without KN-93 for 3 h. C Immunofluorescence images and D quantitative analysis of Nrf2 in the cells treated with LPS and LPS + CPS with or without KN-93 for 3 h. Scale bars: 10 μm. Data (n = 3) are shown as mean ± SD. *P < 0.05; **P < 0.01; ***P < 0.001; NS nonsignificant.

References

    1. Martel-Pelletier J, et al. Osteoarthritis. Nat. Rev. Dis. Prim. 2016;2:1–18. - PubMed
    1. Hunter DJ, Bierma-Zeinstra S. Osteoarthritis. Lancet. 2019;393:1754–1759. - PubMed
    1. Atukorala I, et al. Synovitis in knee osteoarthritis: a precursor of disease? Ann. Rheum. Dis. 2016;75:390–395. doi: 10.1136/annrheumdis-2014-205894. - DOI - PMC - PubMed
    1. Raghu H, et al. CCL2/CCR2, but not CCL5/CCR5, mediates monocyte recruitment, inflammation and cartilage destruction in osteoarthritis. Ann. Rheum. Dis. 2017;76:914–922. doi: 10.1136/annrheumdis-2016-210426. - DOI - PMC - PubMed
    1. Robinson WH, et al. Low-grade inflammation as a key mediator of the pathogenesis of osteoarthritis. Nat. Rev. Rheumatol. 2016;12:580–592. doi: 10.1038/nrrheum.2016.136. - DOI - PMC - PubMed

Publication types

Substances