. 2021 May 18;12(1):2899.
doi: 10.1038/s41467-021-22833-6.

Mycobacterium tuberculosis precursor rRNA as a measure of treatment-shortening activity of drugs and regimens

Affiliations

Mycobacterium tuberculosis precursor rRNA as a measure of treatment-shortening activity of drugs and regimens

Nicholas D Walter et al. Nat Commun. .

Abstract

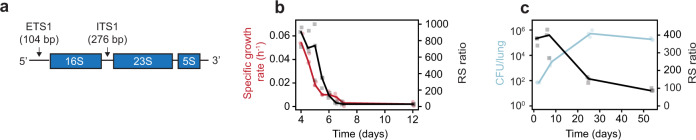
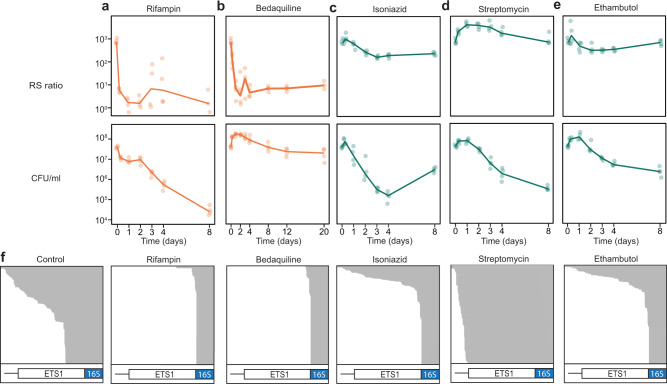
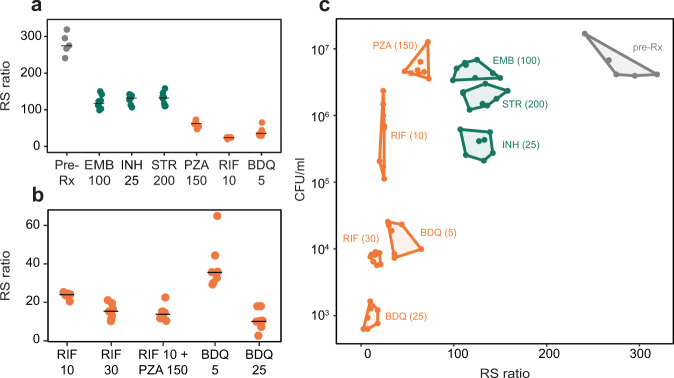
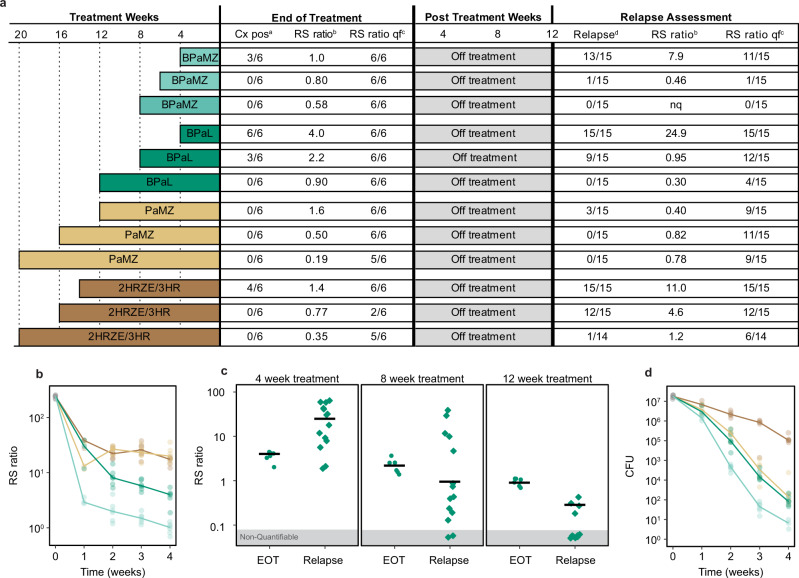
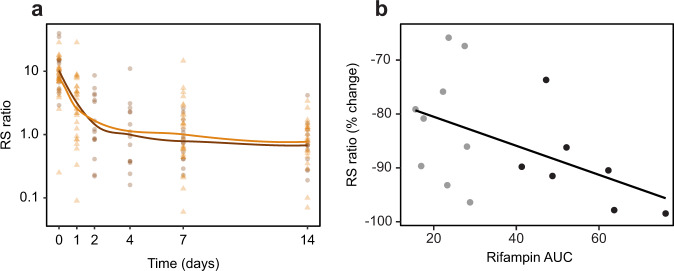
There is urgent need for new drug regimens that more rapidly cure tuberculosis (TB). Existing TB drugs and regimens vary in treatment-shortening activity, but the molecular basis of these differences is unclear, and no existing assay directly quantifies the ability of a drug or regimen to shorten treatment. Here, we show that drugs historically classified as sterilizing and non-sterilizing have distinct impacts on a fundamental aspect of Mycobacterium tuberculosis physiology: ribosomal RNA (rRNA) synthesis. In culture, in mice, and in human studies, measurement of precursor rRNA reveals that sterilizing drugs and highly effective drug regimens profoundly suppress M. tuberculosis rRNA synthesis, whereas non-sterilizing drugs and weaker regimens do not. The rRNA synthesis ratio provides a readout of drug effect that is orthogonal to traditional measures of bacterial burden. We propose that this metric of drug activity may accelerate the development of shorter TB regimens.


Conflict of interest statement

The University of Colorado has filed a patent application entitled “Methods of Evaluating Treatment Efficacy and/or Treatment Duration In Mycobacterial Diseases [Application 16/632,310, filed January 17, 2020, currently pending] pertaining to use of pre-rRNA ratios for monitoring treatment efficacy. Inventors are N.D.W., M.I.V., G.T.R., A.J.L., G.D., G.S., P.N., and J.L.D. The remaining authors declare no competing interests.

Figures

Fig. 1
Fig. 1. RS ratio correlates with Mtb replication.
a Mtb ribosomal operon. b The RS ratio (black) mirrored specific growth rate (red) in an in vitro progressive oxygen depletion model. Dots represent values from three independent experiments. Lines connect median values. c In the BALB/c chronic infection model, the lung Mtb CFU burden (blue) rose rapidly and then plateaued over time. The RS ratio (black) indicated rapid initial rRNA synthesis that slowed as Mtb burden plateaued. Dots represent values from three individual mice. Lines connect mean values from each timepoint. Source data are provided as a Source Data file.
Fig. 2
Fig. 2. Single-bacillus RS ratio in situ indicates that Mtb rRNA synthesis is lower in caseum than the granuloma’s inflammatory rim.
a H&E-stained section of a single typical lung granuloma from C3HeB/FeJ mouse. Most of the lesion is comprised of caseous necrosis (1). The caseum is surrounded by a rim of inflammatory cells that include viable and degenerate neutrophils and heavily vacuolated macrophages (2). The granuloma is contained by an outer rim of compressed lung tissue, fibrosis, and infiltrating leukocytes (3). b Granuloma from C3HeB/FeJ mouse lung with multiplexed ISH overlay staining for 23S rRNA (green), pre-rRNA (red), and DAPI for host-cell nuclei (blue). The channels for ISH are shown individually in c and d. c 23S rRNA ISH identified Mtb present throughout the granuloma. d pre-rRNA ISH indicated lower Mtb rRNA synthesis in the caseum compared with the inflammatory rim. e Graphical analysis as well as statistical testing of the RS ratio by ISH showed that there was greater population heterogeneity in rRNA synthesis in the inflammatory rim (orange) than in the caseum (blue). Components of this raincloud plot are: (1) density plots for the distribution of 164,878 RS ratio values for individual bacilli in a single granuloma on a log10 scale, (2) scatterplots to visualize all points measured, and (3) boxplots to present the range of values in the RS ratio. The center and ends of the box represent the median and first and third quartiles of the RS ratio. The boxplot whiskers represent the maximum and minimum values in each group. f Magnification of high-powered images depicts co-occurrence of rRNA signals within individual bacilli. g Further magnification demonstrates 23S signals distributed in a reticular pattern around a central confluence of pre-rRNA signals. Panels ad were imaged at ×40; scale bars represent 500 µm. Z-stacked images surrounding this image are provided in Supplementary Fig 4. Panels f and g were imaged at ×63; scale bars represent 10 and 5 µm, respectively. Panels ag are results from a single lung granuloma. Replicate results from two additional granulomas from two different mice in separate independent experiments are provided in Supplementary Fig. 2.
Fig. 3
Fig. 3. Canonical sterilizing drugs suppress rRNA synthesis more than non-sterilizing drugs in vitro.
Change in RS ratio and CFU burden in time-kill experiments with a rifampin, b bedaquiline, c isoniazid, d streptomycin, and e ethambutol. Sterilizing and non-sterilizing drugs shown in orange and green, respectively. Dots represent values from three independent experiments. Lines connect mean values from each timepoint. f RNAseq results for log-phase untreated control and after 48 h of drug exposure. Integrative Genomics Viewer (IGV) images demonstrate abundant ETS1 reads in the control sample compared with near-absence of ETS1 reads after exposure to rifampin and bedaquiline. Gray shading denotes individual reads. White and blue bars indicate the ETS1 pre-rRNA and 16S rRNA regions, respectively. Source data for a–e are provided as a Source Data file.
Fig. 4
Fig. 4. Canonical sterilizing drugs suppress rRNA synthesis more than non-sterilizing drugs in mice.
a RS ratio in lung tissue of BALB/c mice treated for 28 days with individual non-sterilizing (green) and sterilizing (orange) drugs. Dots indicate individual mice (N = 8 per treatment). Horizontal lines indicate group means. b Dose–response relationship between rifampin and bedaquiline dose and the RS ratio. Also shown is the combination of rifampin 10 mg kg−1 and pyrazinamide. Dots indicate individual mice (N = 8 per treatment). Horizontal lines indicate group means. c Contrasting effects of 28-day treatment with individual drugs/doses on CFU and the RS ratio in BALB/c mice. A convex hull was used to display data groupings. Source data are provided as a Source Data file.
Fig. 5
Fig. 5. RS ratio correlated with the sterilizing potency of four regimens in the conventional relapsing mouse model.
a Summary of treatment durations and outcomes at the end of treatment and the time of relapse assessment in the BALB/c mouse relapse model. At the end of treatment, the numbers of mice with growth of Mtb in culture and with quantifiable RS ratios are shown. The median RS ratio for each treatment is shown. At the time of relapse assessment, the numbers of mice with microbiologic relapse and with quantifiable RS ratios are shown. The median RS ratio for each treatment is shown. b RS ratio during treatment weeks 1–4 in lung homogenate from mice treated with BPaMZ (light green), BPaL (dark green), PaMZ, (light brown), or HRZE (dark brown). Circles represent values from individual mice (N = 3 per regimen at week 1 and N= 6 per regimen at weeks 2, 3, and 4). Solid lines connect median values. c RS ratio results following 4, 8, and 12 weeks of treatment with BPaL. Circles represent individual mice (N= 6 per regimen and duration) at end of treatment (EOT). Squares represent mice at the time of relapse determination (N = 15 per regimen and duration) after a 12-week drug holiday. d CFU per lung at the same timepoints in the same mice as in b with the same number of mice represented in the same color scheme.
Fig. 6
Fig. 6. Sputum RS ratio declines rapidly with standard treatment and a dose-response relationship is evident.
a Longitudinal change in the RS ratio in serial sputa among Ugandan and Vietnamese adults treated with HRZE for drug-susceptible TB. Brown and orange dots indicate individual patients from Uganda and Vietnam, respectively. The solid line is a Lowess fit. b Association between rifampin exposure (AUC) and change in sputum RS ratio between pre-treatment and day 14 among Beninese patients treated with HRZE with rifampin 10 mg kg−1 (gray) or 15 mg kg−1 (black).

References

    1. Connolly LE, Edelstein PH, Ramakrishnan L. Why is long-term therapy required to cure tuberculosis? PLoS Med. 2007;4:e120. doi: 10.1371/journal.pmed.0040120. - DOI - PMC - PubMed
    1. Davies GR. Early clinical development of anti-tuberculosis drugs: science, statistics and sterilizing activity. Tuberculosis. 2010;90:171–176. doi: 10.1016/j.tube.2010.03.007. - DOI - PubMed
    1. Reid MJA, et al. Building a tuberculosis-free world: The Lancet Commission on Tuberculosis. Lancet. 2019;393:1331–1384. doi: 10.1016/S0140-6736(19)30024-8. - DOI - PubMed
    1. Nahid P, et al. Tuberculosis biomarker and surrogate endpoint research roadmap. Am. J. Resp. Crit. Care. 2011;184:972–979. doi: 10.1164/rccm.201105-0827WS. - DOI - PMC - PubMed
    1. World Health Organization. An International Roadmap for Tuberculosis Research (2011).

Publication types

MeSH terms