. 2021 May 18;12(1):2936.
doi: 10.1038/s41467-021-22841-6.

Nociceptive sensory neurons promote CD8 T cell responses to HSV-1 infection

Affiliations

Nociceptive sensory neurons promote CD8 T cell responses to HSV-1 infection

Jessica Filtjens et al. Nat Commun. .

Abstract

Host protection against cutaneous herpes simplex virus 1 (HSV-1) infection relies on the induction of a robust adaptive immune response. Here, we show that Nav1.8+ sensory neurons, which are involved in pain perception, control the magnitude of CD8 T cell priming and expansion in HSV-1-infected mice. The ablation of Nav1.8-expressing sensory neurons is associated with extensive skin lesions characterized by enhanced inflammatory cytokine and chemokine production. Mechanistically, Nav1.8+ sensory neurons are required for the downregulation of neutrophil infiltration in the skin after viral clearance to limit the severity of tissue damage and restore skin homeostasis, as well as for eliciting robust CD8 T cell priming in skin-draining lymph nodes by controlling dendritic cell responses. Collectively, our data reveal an important role for the sensory nervous system in regulating both innate and adaptive immune responses to viral infection, thereby opening up possibilities for new therapeutic strategies.


Conflict of interest statement

The authors declare no competing interests.

Figures
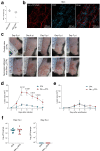
Fig. 1
Fig. 1. Cutaneous HSV-1 infection in Nav1.8-DTA mice.
Control DTA and Nav1.8-DTA mice were infected with HSV-OVA-TK after flank scarification. a C57BL/6 mice were infected with the HSV-OVA or HSV-OVA-TK viral strains. Viral titres in the skin were analysed 2 days pi, n = 4 mice per group. b Immunofluorescence staining of Nav1.8-TdTomato mouse skin. Whole-mount skin samples were stained with anti-CD45 antibodies (blue); Nav1.8+ cells express TdTomato (red), n = 2 samples. c Representative pictures of the skin lesion progression in control DTA (top line) and Nav1.8-DTA mice (bottom line). d Size of the skin lesions of control DTA and Nav1.8-DTA mice after HSV-OVA-TK infection (n = 19–20 mice per group) or e treated with PBS only, after flank scarification (n = 5–9 mice per group) (the data obtained for each mouse are shown in Supplementary Table 1). P values were obtained by mixed-effect analysis followed by Sidak’s multiple comparison test. f Viral titres in the skin of control DTA and Nav1.8-DTA mice after HSV-OVA-TK infection on days 3 pi (n = 13 DTA mice and n = 11 Nav1.8-DTA mice) and 8 pi (n = 5 DTA mice and n = 6 Nav1.8-DTA mice). Data are presented as mean ± SEM.
Fig. 2
Fig. 2. Excessive skin inflammation in Nav1.8-DTA mice following cutaneous HSV-1 infection.
Cytokine and chemokine concentrations in skin homogenates of control DTA (blue bars) and Nav1.8-DTA (red bars) mice 6 days after HSV-OVA-TK infection or in PBS-treated mice. Data from three independent experiments are presented as mean ± SEM; P values were obtained by using one-way ANOVA followed by Sidak’s multiple comparison test. Each dot represents the data obtained for one mouse. N = 4–10 mice per group.
Fig. 3
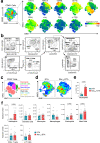
Fig. 3. Nociceptor-deficient mice present higher levels of neutrophil infiltration in the skin after HSV-1 infection.
Control DTA and Nav1.8-DTA mice were infected with HSV-OVA-TK by flank scarification. Immune responses in the skin were analysed 6 days pi by flow cytometry. a tSNE analysis of CD45+ cells with the CD11c, MHC-II, CD206, CD11b, Ly6G, CD24, c-kit, CD4 and γδ TCR markers. The colours in the expression-level heatmaps (right panel) represent the median intensity values for each marker. b Flow cytometry gating strategy used to identify immune cell subsets: the CD45+ cell population was selected after the exclusion of doublets and dead cells. DCs were gated as CD11chigh MHC-II+ cells and split into subsets on the basis of their expression of CD24 and CD11b. cDC1 was defined as CD24+ CD11b DC, cDC2 as CD11b+ CD24 DC and Langerhans cells (LC) as CD24+ CD11b+ DC. Neutrophils were gated as CD11b+ Ly6G+ cells. Eosinophils were then gated as CD11b+ CD24+ cells. Monocytes and macrophages were defined as CD11b+ CD24 cells and subdivided into macrophages (CD11b+ CD24 CD206+ CD64+) and monocytes (CD11b+ CD24 CD206 Ly6Chigh/low). Finally, within the non-DC subset, lymphoid cells were gated as CD11b γδ TCR+ cells and subdivided into CD4+ T cells (CD4+ γδ TCR), γδ T cells (CD4 γδ TCR+) and other lymphoid cells (CD4 γδ TCR). c Distribution of the different immune cell subsets in the tSNE analysis: neutrophils (CD11b+ Ly6G+, in red), dendritic cells (CD11chigh MHC-II+, in green), monocytes (CD11b+ Ly6G CD24 CD206, in pink), macrophages (CD11b+ Ly6G CD24 CD206+, in blue), eosinophils (CD11b+ Ly6G CD24+, in orange), mast cells (CD11b+ c-kit+, in black), CD4+ T cells (CD11b TCRγδ CD4+, in cyan), γδ T cells (CD11b TCRγδ+, in dark yellow) and other lymphoid cells (CD11b TCRγδ CD4, in grey). d Relative clustering of skin immune cells from the indicated mouse strains (control DTA or Nav1.8-DTA) used for the tSNE analysis. e Percentages of neutrophils among CD45+ skin cells from DTA and Nav1.8-DTA mice 6 days pi. f Absolute numbers of immune cells subsets in the skin of DTA and Nav1.8-DTA mice 6 days pi. The data presented are from three independent experiments (n = 8–11 mice per group) and are shown as mean ± SEM; P values were obtained by using a Mann–Whitney test (two-tailed).
Fig. 4
Fig. 4. Cellular source of inflammatory cytokines.
Control DTA and Nav1.8-DTA mice were infected with HSV-OVA-TK by flank scarification. Inflammatory cytokine production by immune cell subsets in the skin was analysed by intracellular staining and flow cytometry analysis 6 days pi. a, b Representative dot plots and quantification of the % of TNF-α+, IL-6+ and IL-1b+ monocytes (a) and neutrophils (b) in the skin of DTA and Nav1.8-DTA mice 6 days pi. c, d Absolute numbers of TNF-α+, IL-6+ and IL-1β+ monocytes (c) and neutrophils (d) in the skin of DTA and Nav1.8-DTA mice 6 days pi. The results shown are from three independent experiments (n = 7–11 mice per group). The data are presented as mean ± SEM. P values were obtained by using a Mann–Whitney test (two-tailed).
Fig. 5
Fig. 5. Nociceptors are required to promote a robust CD8 T cell response to HSV-1 infection.
a Immunofluorescence staining of the epidermis of DTA (top panels) and Nav1.8-DTA (bottom panels) mice. Neurons were stained with anti-PGP9.5 antibodies (in red), Langerhans cells (LC) were stained with anti-langerin antibodies (in green) and T cells were stained with anti-CD3 antibodies (in blue). N = 2–3 mice per group. b Control DTA and Nav1.8-DTA mice were infected with HSV-OVA-TK by flank scarification. Skin DC subsets were analysed by flow cytometry using the gating strategy presented in Fig. 3b. Absolute numbers of cDC1, cDC2 and LC on day 6 pi are shown. Each dot represents the data obtained for one mouse. N = 8–11 mice per group. The data are presented as mean ± SEM. P values were obtained by using a Mann–Whitney test (two-tailed). c, d In vitro activation of OT-I T cells. OT-I T cells from naive mice were purified, stained with a fluorescent marker and co-cultured for 48 h with purified CD11c+ DCs from infected control DTA (blue) or Nav1.8-DTA (red) brachial and axillary lymph nodes isolated on 4 days pi. Representative dot plots and quantification of the frequency of proliferating OT-I T cells in the presence (c) or absence (d) of the OVA peptide (SIINFEKL). N = 5–6 per group. The data are presented as mean ± SEM. P values were obtained by using a Mann–Whitney test (two-tailed). e Experimental design used for monitoring antiviral CD8 T cell responses in vivo. Control DTA (blue) and Nav1.8-DTA (red) recipient mice were injected with 5 × 104 naive virus-specific T cells (CD45.1+ OT-I T cells) 1 day before HSV-OVA-TK infection by flank scarification and were analysed 4 or 8 days pi. f, g Absolute numbers of virus-specific T cells (OT-I) in dLN (n = 4–24 mice per group) (f) and spleens (n = 3–30 per group) (g) were determined at the indicated time points. Virus-specific T cells were detected by flow cytometry and gated based on their expression of the Vα2, CD45.1, CD3 and CD8 markers, the gating strategy used is shown in Supplementary Fig. 4e. The results shown are representative of at least three independent experiments. The data are presented as mean ± SEM; P values were obtained by using a Mann–Whitney test (two-tailed).
Fig. 6
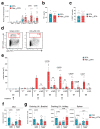
Fig. 6. Regulation of the neutrophil response by nociceptors is required to reduce the severity of HSV-1-induced skin lesions and to elicit a robust CD8 T cell response.
a Longitudinal follow-up of the absolute numbers of neutrophils in the skin of HSV-1-infected control DTA and Nav1.8-DTA mice. N = 3–17 mice per group. The data are presented as mean ± SEM. b HIF-1α concentrations in skin homogenates from control DTA and Nav1.8-DTA mice 6 days pi. N = 5 mice per group. The data are presented as mean ± SEM. P values were obtained by using a Mann–Whitney test (two-tailed). c Percentage of DAPI+ neutrophils in the skin of HSV-1-infected control DTA and Nav1.8-DTA mice 6 days pi. N = 10–11 mice per group. The data are presented as mean ± SEM. P values were obtained by using a Mann–Whitney test (two-tailed). d, e, f, g Control DTA (blue) and Nav1.8-DTA (red)-recipient mice were injected with 5 × 104 naive virus-specific T cells (CD45.1+ OT-I T cells) 1 day before HSV-OVA-TK infection by flank scarification. Neutrophils were depleted using anti-Ly6G monoclonal antibody treatment. d Representative dot plots showing CD45+ cells in the spleen of control (isotype control antibody-treated mice, left) and anti-Ly6G antibody-treated mice (right). Ly6C+GR1high cells (gated area) were identified as neutrophils. e Size of skin lesions in infected control DTA and Nav1.8-DTA mice treated with isotype control (IC) or anti-Ly6G antibodies. Arrows represent the time points at which anti-Ly6G or IC antibodies were injected (N = 2–10 mice per group). Data are presented as mean ± SEM. P values were obtained by using a Mann–Whitney test (two-tailed). f Skin DCs were identified by flow cytometry 8 days pi (see the gating strategy presented in Fig. 3b). The absolute numbers of cDC1 in the skin are shown. Data are presented as mean ± SEM. P values were obtained by using a Kruskal–Wallis test followed by Dunn’s multiple comparison test. N = 5–10 mice per group. g Absolute numbers of OT-I cells in brachial LN, axillary LN and spleen of control DTA and Nav1.8-DTA 8 days pi are shown. Data are presented as mean ± SEM. P values were obtained by using a one-way ANOVA followed by Sidak’s multiple comparison test. N = 5–10 mice per group.
Fig. 7
Fig. 7. T cell and neutrophil responses are unaffected in Nav1.8-DTA mice in a model of cutaneous vaccination.
a Percentages of neutrophils among CD45+ cells within the skin foot pad 5 days after the injection of an emulsion of 50% PBS and 50% complete Freund adjuvant (CFA). N = 4 per group. bd Injection of OVA (100 μg) in CFA into the paw of the mice. b Increase (Δ) in paw thickness relative to baseline 5 days after CFA or CFA + OVA injection. N = 3–7 mice per group. c, d Percentage of OVA-specific CD8+ T cells among total CD8+ T cells (c), N = 5–10 mice per group; and absolute numbers of OVA-specific CD8+ T cells (d) in the skin-draining lymph node 7 days after the injection of CFA +/− OVA, N = 5–10 mice per group. ad The results shown are from two independent experiments. The data shown are the mean ± SEM. P values were obtained by using a Mann–Whitney test (two-tailed).

References

    1. Heath, W. R. & Carbone, F. R. The skin-resident and migratory immune system in steady state and memory: innate lymphocytes, dendritic cells and T cells. Nat. Rev. Immunol. 14, 978 (2013). - PubMed
    1. Nathan C. Neutrophils and immunity: challenges and opportunities. Nat. Rev. Immunol. 2006;6:173–182. doi: 10.1038/nri1785. - DOI - PubMed
    1. Malissen B, Tamoutounour S, Henri S. The origins and functions of dendritic cells and macrophages in the skin. Nat. Rev. Immunol. 2014;14:417–428. doi: 10.1038/nri3683. - DOI - PubMed
    1. Sumpter TL, Balmert SC, Kaplan DH. Cutaneous immune responses mediated by dendritic cells and mast cells. JCI Insight. 2019;4:1–13. doi: 10.1172/jci.insight.123947. - DOI - PMC - PubMed
    1. Basbaum AI, Bautista DM, Scherrer G, Julius D. Cellular and molecular mechanisms of pain. Cell. 2009;139:267–284. doi: 10.1016/j.cell.2009.09.028. - DOI - PMC - PubMed

Publication types

MeSH terms

Substances