. 2021 May 18;12(1):2907.
doi: 10.1038/s41467-021-23029-8.

Gene-level metagenomic architectures across diseases yield high-resolution microbiome diagnostic indicators

Affiliations

Gene-level metagenomic architectures across diseases yield high-resolution microbiome diagnostic indicators

Braden T Tierney et al. Nat Commun. .

Abstract

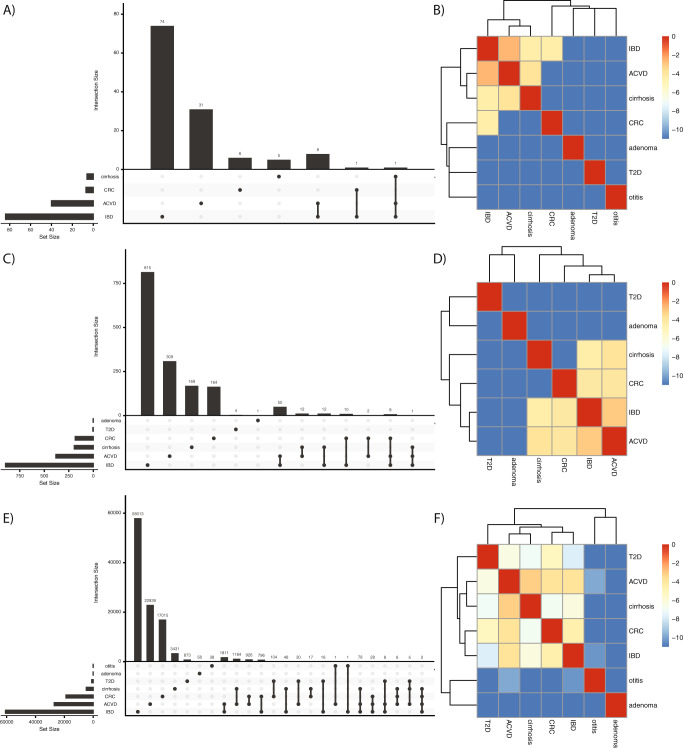
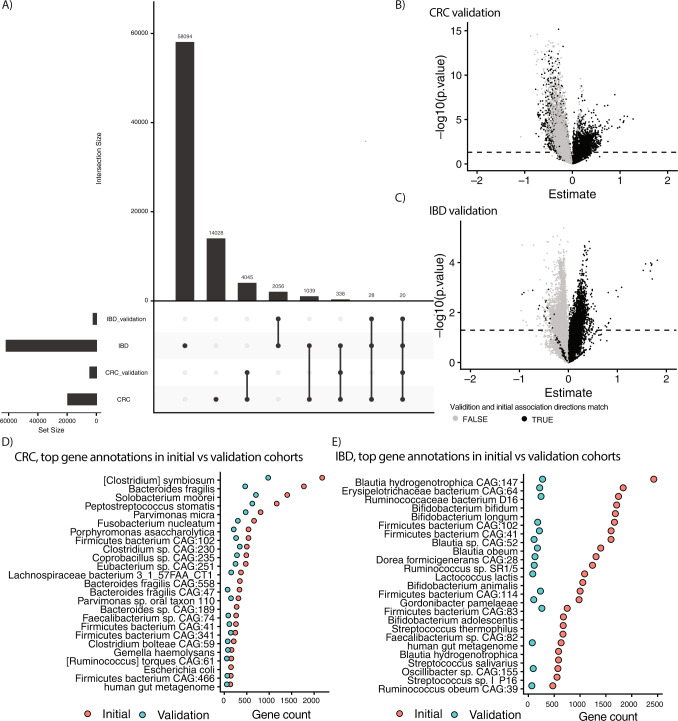
We propose microbiome disease "architectures": linking >1 million microbial features (species, pathways, and genes) to 7 host phenotypes from 13 cohorts using a pipeline designed to identify associations that are robust to analytical model choice. Here, we quantify conservation and heterogeneity in microbiome-disease associations, using gene-level analysis to identify strain-specific, cross-disease, positive and negative associations. We find coronary artery disease, inflammatory bowel diseases, and liver cirrhosis to share gene-level signatures ascribed to the Streptococcus genus. Type 2 diabetes, by comparison, has a distinct metagenomic signature not linked to any one specific species or genus. We additionally find that at the species-level, the prior-reported connection between Solobacterium moorei and colorectal cancer is not consistently identified across models-however, our gene-level analysis unveils a group of robust, strain-specific gene associations. Finally, we validate our findings regarding colorectal cancer and inflammatory bowel diseases in independent cohorts and identify that features inversely associated with disease tend to be less reproducible than features enriched in disease. Overall, our work is not only a step towards gene-based, cross-disease microbiome diagnostic indicators, but it also illuminates the nuances of the genetic architecture of the human microbiome, including tension between gene- and species-level associations.


Conflict of interest statement

A.D.K. is a cofounder of and scientific advisor to FitBiomics, Inc. At the time of the writing, C.J.P. was an advisor to XY.ai. B.T.T. and Y.T. report no competing interests.

Figures

Fig. 1
Fig. 1. Pipeline overview.
A Using publicly available metagenomic, shotgun sequencing datasets, we computed linear associations between microbiome features (gene family, pathway, or species abundances) and for each of seven different diseases separately. In cases where multiple cohorts were present for one disease, we meta-analyzed the association output. B We then computed Vibration of Effects (VoE), where, given the available individual-level metadata, we determined how model specification changes the association between each false-discovery rate significant feature and host phenotype.
Fig. 2
Fig. 2. Initial association output.
Initial association outputs for each A meta-analyzed and B single-cohort phenotype, split by species associations, pathway associations, and gene family associations. Each point represents a different feature (e.g., species). Y axes are false-discovery rate-adjusted log10 P values. Solid line is false-discovery rate-adjusted statistical significance (P < 0.05). X axes are the beta-coefficient on the binary, independent disease variable of interest.
Fig. 3
Fig. 3. Examples of associations of varying strength.
Example of a robust (A) and nonrobust (B) association as identified by modeling vibration of effects. Each point represents the association deriving from multiple linear regression between the disease and microbial feature of interest for a different modeling strategy. Y axes are nominal log10 P values. Solid line is nominal statistical significance (P < 0.05). X axes are the beta-coefficient on the binary, independent disease variable of interest. Dotted lines represented the false-discovery rate-adjusted P values. Point colors correspond to cohorts. The solid blue diamond marks the P value and estimates achieved through meta-analysis across all cohorts. The species listed in A was included in the downstream analysis, as it exhibited meta-analytic false-discovery rate (FDR)-adjusted statistical significance, whereas the species in B was not included, as it was not FDR-significant and was not robust, as nominally significant opposite sign results (a Janus Effect) could be achieved with differing model specifications.
Fig. 4
Fig. 4. The disease architecture of the human microbiome across seven phenotypes as a function of data modality.
A, C, E describe the species, pathways, and gene families associated with each phenotype and the overlap therein, respectively. B, D, F show the natural log of pairwise jaccard similarity between binary vectors indicating all of the features (e.g., species or pathways or gene families) associated with a given phenotype.
Fig. 5
Fig. 5. Cross-disease, gene-level architectures.
The taxonomic distribution of genes associated with at least two phenotypes, excluding adenoma due to a lack of significant, robust, and overlapping associations. Heatmap color for the inner six rings corresponds, for a particular phenotype, the fraction (of the N in the axis labels) of genes associated with a given taxonomic annotation. Lighter colors indicate a value closer to 1. Outer ring corresponds to if an association was negative (black) or positive (beige) across all phenotypes. Text color corresponds to phylum, with nonbacterial phyla listed as “Other”.
Fig. 6
Fig. 6. Vibration of an association with CRC at the species versus gene level.
Each point corresponds to a different linear model specification. Y axes are log10 P values. Solid line is nominal statistical significance (P < 0.05). X axes are the beta-coefficient on the binary, independent disease variable of interest. The dotted lines correspond to the 0.05 false-discovery rate-adjusted log10 cutoff (for species and genes, respectively) in our original meta-analysis, whereas the solid line corresponds to the nominal (P = 0.05) cutoff. The gene-level plot (right) contains the overlaid vibration output for every S. moorei gene (N = 662, all deriving from one strain) that was significantly associated with CRC.
Fig. 7
Fig. 7. Validation of gene-level architectures for CRC and IBD.
We used unadjusted, univariate linear models to test the association between gene abundance and disease state for the genes associated with IBD and CRC in two cohorts not analyzed in our initial study. A Overlaps between the initial and validation cohorts in terms of significant genes. B, C Volcano plots of CRC and IBD estimate sizes and nominal log10 P values for validation cohorts. Each point represents a different gene family. Dotted line is nominal (P value < 0.05) significance. Exact P values < 0.05 are shown above the line. Y axes are nominal log10 P values. X axes are the beta-coefficient on the binary, independent disease variable of interest. Black dots indicate the association direction (e.g., positive vs. negative) matched in the initial cohort(s), gray indicates initial, and validation associations did not have the same direction. D, E The top 25 taxonomic annotations (by frequency) of genes associated with CRC and IBD in the initial cohorts and how many of these are also found in the top 25 annotations of genes in the validation cohorts.

References

    1. Rothschild, D. et al. Environment dominates over host genetics in shaping human gut microbiota. Nature10.1038/nature25973 (2018). - PubMed
    1. Gilbert JA, et al. Current understanding of the human microbiome. Nat. Med. 2018;24:392–400. - PMC - PubMed
    1. Timpson NJ, Greenwood CMT, Soranzo N, Lawson DJ, Richards JB. Genetic architecture: the shape of the genetic contribution to human traits and disease. Nat. Rev. Genet. 2018;19:110–124. doi: 10.1038/nrg.2017.101. - DOI - PubMed
    1. Yu J, et al. Metagenomic analysis of faecal microbiome as a tool towards targeted non-invasive biomarkers for colorectal cancer. Gut. 2017;66:70–78. doi: 10.1136/gutjnl-2015-309800. - DOI - PubMed
    1. Li SS, et al. Durable coexistence of donor and recipient strains after fecal microbiota transplantation. Science. 2016;352:586–589. doi: 10.1126/science.aad8852. - DOI - PubMed

Publication types

MeSH terms

Supplementary concepts

LinkOut - more resources