. 2021 May 18;12(1):2910.
doi: 10.1038/s41467-021-22899-2.

Nuclear organisation and replication timing are coupled through RIF1-PP1 interaction

Affiliations

Nuclear organisation and replication timing are coupled through RIF1-PP1 interaction

Stefano Gnan et al. Nat Commun. .

Abstract

Three-dimensional genome organisation and replication timing are known to be correlated, however, it remains unknown whether nuclear architecture overall plays an instructive role in the replication-timing programme and, if so, how. Here we demonstrate that RIF1 is a molecular hub that co-regulates both processes. Both nuclear organisation and replication timing depend upon the interaction between RIF1 and PP1. However, whereas nuclear architecture requires the full complement of RIF1 and its interaction with PP1, replication timing is not sensitive to RIF1 dosage. The role of RIF1 in replication timing also extends beyond its interaction with PP1. Availing of this separation-of-function approach, we have therefore identified in RIF1 dual function the molecular bases of the co-dependency of the replication-timing programme and nuclear architecture.


Conflict of interest statement

The authors declare no competing interests.

Figures
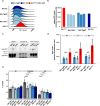
Fig. 1
Fig. 1. Expression levels and chromatin association of RIF1-TgWT and RIF1-ΔPP1 are comparable to those of RIF1 in hemizygous cells.
a Quantitative analysis of total levels of FH-tagged RIF1, measured by intra-cellular FACS staining. Anti-HA mouse ascites 16B12 was used to stain the indicated cell lines. Rif1FH/FH: homozygous knock-in FH-tagged RIF1, as a control of quantitative staining. The plot shows distributions of densities from HA signal, measured in arbitrary units. One representative experiment is shown. b Quantification from Fig. 1a. The bar plot represents the median intensities for the experiment shown and the error bars indicate 95% confidence intervals, calculated through bootstrapping with 10,000 iterations. c Total proteins were extracted from cells expressing untagged wild type RIF1 (WT), or from hemizygote cells expressing RIF1-TgWT or RIF1-ΔPP1 (HA tagged), and immunoprecipitated with anti-HA antibody. The input, immunoprecipitated complex and flow through were analysed by western blot with anti-mouse RIF1 affinity-purified rabbit polyclonal antibody (1240) and anti-PP1α. d Quantitative analysis of the levels of chromatin-associated FH-tagged RIF1 throughout the cell cycle measured by FACS staining. Cytoplasmic and nucleoplasmic proteins were pre-extracted before fixing chromatin-associated proteins. Anti-HA mouse ascites 16B12 was used to visualise FH-tagged RIF1 as in a. Cell cycle stage was determined by DNA quantification (DAPI staining). Means from the results from two independent experiments, each with 2 or 3 independent cell lines per genotype are summarised. The error bars indicate standard deviations. P values were calculated by two-sided unpaired t test. e Cell cycle distribution of the indicated cell lines, as determined by FACS quantification of EdU incorporation (S-phase) and DAPI staining (DNA amount). The mean value of three independent clones per genotype, from three experiments is shown. Error bars indicate the standard error of the mean. P values are calculated using two-sided Wilcoxon rank-sum test.
Fig. 2
Fig. 2. Effect of loss of RIF1–PP1 interaction on the replication-timing programme and on the spatial distribution of replication foci.
a Hierarchical cluster analysis of Pearson correlation coefficient of genome-wide replication-timing (RT) profiles between replicas, bin size 50 kb. The analysis shows preferential clustering of RT distribution from Rif1-KO and Rif1-ΔPP1 lines, while RT distribution from Rif1-WT clusters with Rif1-TgWT and Rif1-FH lines. b Representative RT profile from Chromosome 17. The solid line shows the mean of three biological replicas, except for Rif1-FH (single, parental clone). RT scores are calculated as the log2 of the ratio between mapped reads in the early and late replicating fractions of the cell cycle over bins of 50 kb. c Genome-wide distribution of 50 kb genomic windows on the basis of their RT scores. Mean of three independent lines per genotype is shown, except for Rif1-FH. Shaded areas represent standard deviations. If the mean minus the standard deviation was <0, it was set to 0. RT scores from Rif1-WT and Rif1 hemizygous lines (Rif1-TgWT and Rif1-FH) show a bimodal distribution, defining distinct early and late genomic regions. On the contrary, the distribution of RT scores from Rif1-KO lines shows a tendency towards a unimodal distribution, centred around zero. Rif1-ΔPP1 lines display an increase in the windows with RT close to 0, but still a bimodal distribution of the RT values. d The spatial distribution of replication foci (replication patterns) was visualised by EdU and DAPI staining. Cells were pulsed for 30 min with EdU and fixed. Examples in Fig. S5A. Pie charts show the relative distribution of S-phase cells (EdU positive) between replication patterns corresponding to early, mid, and late S-phase. For each genotype, three independent lines and two separate experiments were blind-scored. As Rif-FH cells are a single cell line with no biological replicas (parental) and the results are very similar to the results from Rif1-TgWT, they were pooled (Rif1-hem). In the table, statistically significant differences are summarised. P values are calculated by χ2 test.
Fig. 3
Fig. 3. RIF1 spatially confines chromatin contacts in a dose-dependent manner.
a Normalised contact frequency versus genomic distances for Hi-C reads. Median from three biological replicas per genotype, except for Rif1-FH, are shown. Intra-TADs contacts (line at a median TAD’s size of ~0.3 Mbp), and long-range (over 10 Mbp apart) are indicated. Shaded areas represent standard deviations. b Representative distribution of the median number of in cis chromatin contacts per indicated position (arbitrary units) within the specified region of Chromosome 11. Three independent clones per genotype were used. Upper: log(balanced HiC signals). Lower: log((balanced HiC signals (indicated line/Rif1-WT)). Red indicates a gain of interactions over Rif1-WT, while blue represents a loss.
Fig. 4
Fig. 4. Segregation of A and B nuclear compartments is sensitive to RIF1 dosage.
a Top row: Saddle plot of Hi-C data, binned at 250 kb resolution for loci ranked by their replication timing. An increase in contacts of genomic positions of opposite replication timings is progressively more evident from Rif1-WT to Rif1-KO. The triplicates for each genotype (except for Rif1-FH) were combined. Lower row: Hi-C for each genotype, data normalised to Rif1-WT. Red indicates a gain in contacts. A and B indicates the compartments. b Top row: Saddle plot of Hi-C data, binned at 250 kb resolution for loci ranked by their association with RIF1. An increase in contacts between RIF1-associated and RIF1-devoided genomic positions is progressively more evident from Rif1-WT to Rif1-KO. The triplicates for each genotype (except for Rif1-FH) were combined. Lower row: Hi-C for each genotype, data normalised to Rif1-WT. Red indicates a gain in contacts. A and B indicate the compartments. c Principle component analysis of A/B compartmentalisation for the indicated genotypes in triplicate, except for Rif1-FH. d Distribution of genomic regions of 250 kb windows between the A and B compartment. Mean of three biological replicates is shown, except for the parental line Rif1-FH. e Top row: Saddle plot of Hi-C data, binned at 250 kb resolution for loci ranked by their eigenvector values. An increase in contacts between genomic positions in different compartments is progressively more evident from Rif1-WT to Rif1-KO. The triplicates for each genotype (except for Rif1-FH) were combined. Lower row: Hi-C for each genotype, data normalised by Rif1-WT. Red indicates a gain in contacts. A and B indicates the compartments, calculated from our data. f Compartment strength variation with distance for the indicated genotypes. Individual values for the three biological replicates are represented by the outlined circles, except for Rif1-FH. The line represents the median and the bars the standard deviations.

Similar articles

Cited by

References

    1. Chagin VO, et al. 4D Visualization of replication foci in mammalian cells corresponding to individual replicons. Nat. Commun. 2016;7:11231. doi: 10.1038/ncomms11231. - DOI - PMC - PubMed
    1. Dimitrova DS, Gilbert DM. The spatial position and replication timing of chromosomal domains are both established in early G1 phase. Mol. Cell. 1999;4:983. doi: 10.1016/S1097-2765(00)80227-0. - DOI - PubMed
    1. Muller I, Boyle S, Singer RH, Bickmore WA, Chubb JR. Stable morphology, but dynamic internal reorganisation, of interphase human chromosomes in living cells. PLoS ONE. 2010;5:e11560. doi: 10.1371/journal.pone.0011560. - DOI - PMC - PubMed
    1. Dileep V, et al. Topologically associating domains and their long-range contacts are established during early G1 coincident with the establishment of the replication-timing program. Genome Res. 2015;25:1104. doi: 10.1101/gr.183699.114. - DOI - PMC - PubMed
    1. Pope BD, et al. Topologically associating domains are stable units of replication-timing regulation. Nature. 2014;515:402. doi: 10.1038/nature13986. - DOI - PMC - PubMed

Publication types