. 2021 May 18;11(1):10515.
doi: 10.1038/s41598-021-89716-0.

A metabolomic endotype of bioenergetic dysfunction predicts mortality in critically ill patients with acute respiratory failure

Affiliations

A metabolomic endotype of bioenergetic dysfunction predicts mortality in critically ill patients with acute respiratory failure

Raymond J Langley et al. Sci Rep. .

Abstract

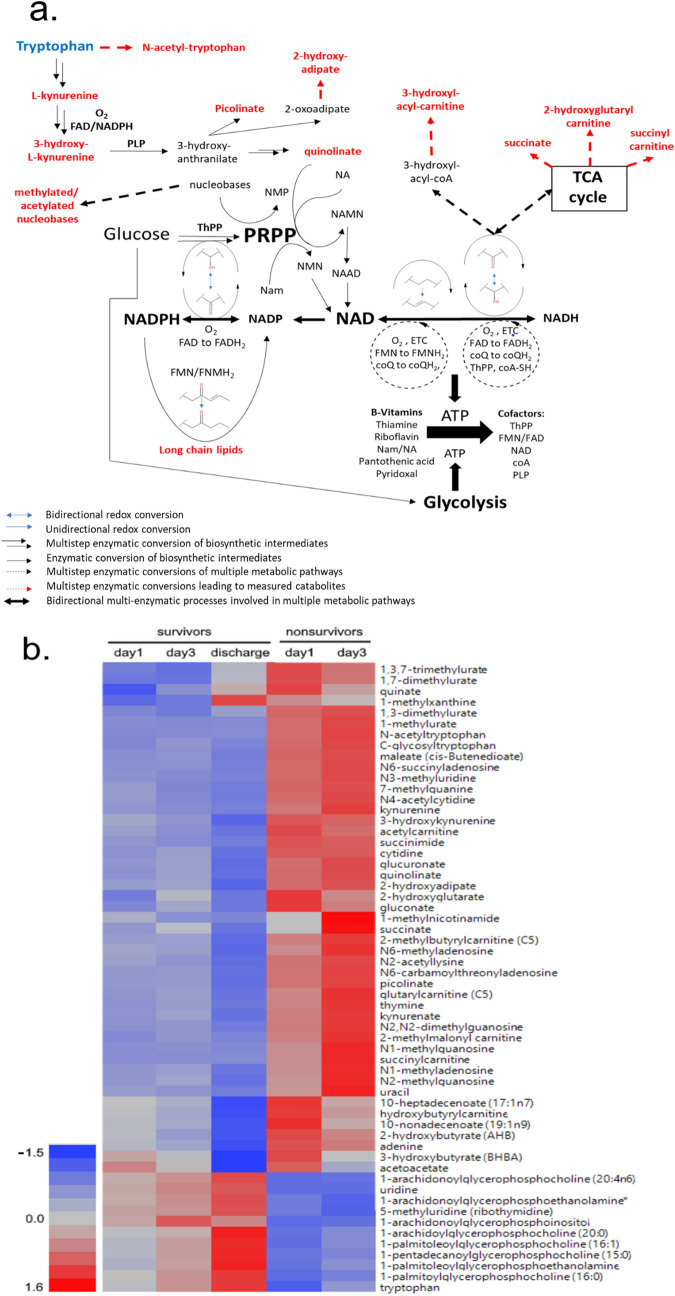
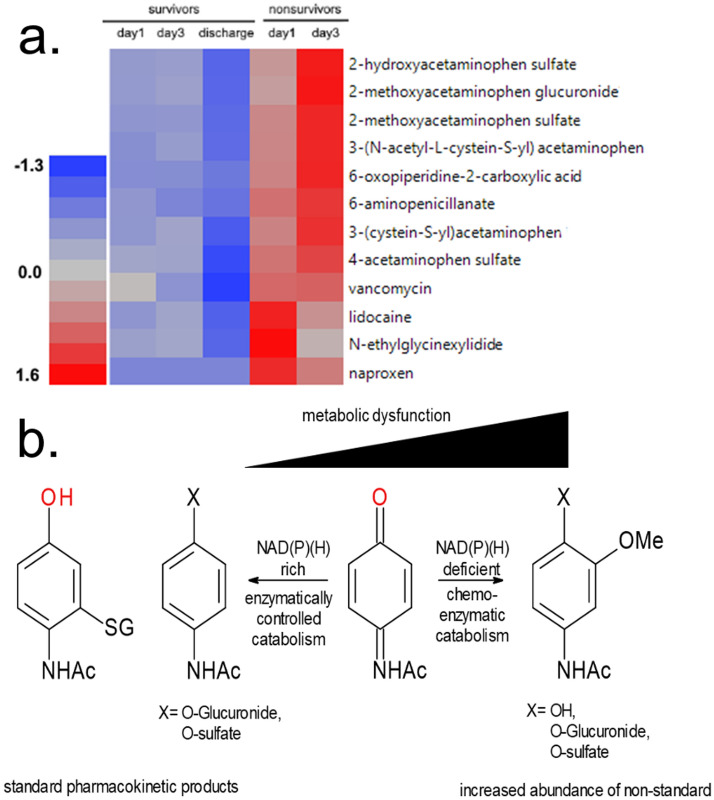
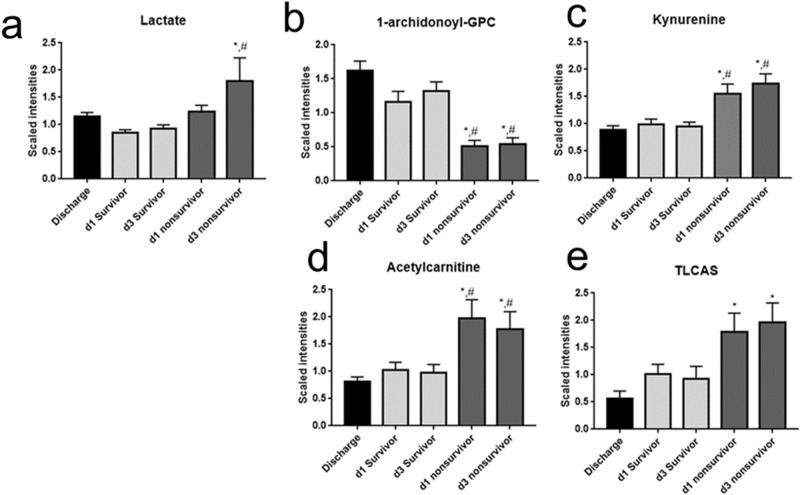
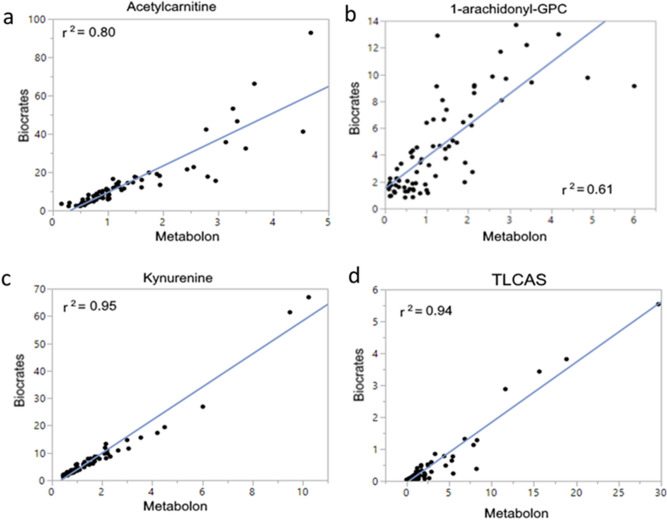
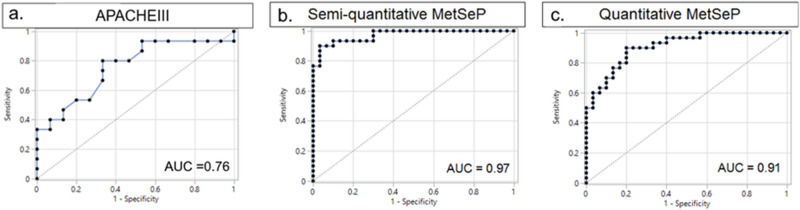
Acute respiratory failure (ARF) requiring mechanical ventilation, a complicating factor in sepsis and other disorders, is associated with high morbidity and mortality. Despite its severity and prevalence, treatment options are limited. In light of accumulating evidence that mitochondrial abnormalities are common in ARF, here we applied broad spectrum quantitative and semiquantitative metabolomic analyses of serum from ARF patients to detect bioenergetic dysfunction and determine its association with survival. Plasma samples from surviving and non-surviving patients (N = 15/group) were taken at day 1 and day 3 after admission to the medical intensive care unit and, in survivors, at hospital discharge. Significant differences between survivors and non-survivors (ANOVA, 5% FDR) include bioenergetically relevant intermediates of redox cofactors nicotinamide adenine dinucleotide (NAD) and NAD phosphate (NADP), increased acyl-carnitines, bile acids, and decreased acyl-glycerophosphocholines. Many metabolites associated with poor outcomes are substrates of NAD(P)-dependent enzymatic processes, while alterations in NAD cofactors rely on bioavailability of dietary B-vitamins thiamine, riboflavin and pyridoxine. Changes in the efficiency of the nicotinamide-derived cofactors' biosynthetic pathways also associate with alterations in glutathione-dependent drug metabolism characterized by substantial differences observed in the acetaminophen metabolome. Based on these findings, a four-feature model developed with semi-quantitative and quantitative metabolomic results predicted patient outcomes with high accuracy (AUROC = 0.91). Collectively, this metabolomic endotype points to a close association between mitochondrial and bioenergetic dysfunction and mortality in human ARF, thus pointing to new pharmacologic targets to reduce mortality in this condition.


Conflict of interest statement

The authors declare no competing interests.

Figures

Figure 1
Figure 1
ARF leads to dysregulated NAD metabolism in nonsurvivors. (A) Pathway analysis of bioenergetic changes in ARF nonsurvivors. A loss of functional levels of PRPP due to a decline in the levels of functional B-vitamin derived cofactors and nucleotides can explain the accumulation of catabolites (red) observed to greatly differ between survivors and nonsurvivors. (B) Ward hierarchical cluster heat map of dysregulated bioenergetic metabolites in ARF nonsurvivors. Concentration of metabolites is depicted by least-squares means with red being increased concentration and blue as reduced concentration in the serum. Metabolites for presentation were selected as representatives of the primary affected pathways represented in 1A. Heatmap made utilizing JMP Genomics 8.0, https://www.jmp.com/en_us/software/genomics-data-analysis-software.html. NAD: nicotinamide adenine dehydrogenase; NAMN: nicotinic acid mononucleotide; NMN: nicotinamide mononucleotide; NAAD: nicotinic acid adenine dinucleotide; ETC: electron transport chain; TCA: tricarboxylic acid; NMP: ribonucleoside monophosphate; ThPP: thiamine pyrophosphate; FMN: flavin monophosphate; FMNH2: flavin mononucleotide reduced form; FAD: flavin adenine dinucleotide; FADH2: flavin adenine dinucleotide reduced form; coA-SH: coenzyme-A; PLP: phosphopyridoxal; coQ: coenzyme Q; CoQH2: coenzyme Q, reduced form.
Figure 2
Figure 2
Dysregulated Metabolism of Acetaminophen. (A). Ward hierarchical cluster heatmap of dysregulated drug metabolism in nonsurvivors. Concentration of metabolites is depicted by least squares means with red being increased concentration and blue as reduced concentration in the serum. Heatmap made utilizing JMP Genomics 8.0, https://www.jmp.com/en_us/software/genomics-data-analysis-software.html. (B) Accumulation of 2-methoxyacetaminophen derivatives are evidence of an overwhelmed NQO1/NQO2 redox process and accumulation of the quinone intermediate. As glutathione levels decline, methyl-derivatives accumulate, likely derived from the nucleophilic addition of water on the quinone intermediate followed by methylation. N-acetyl cysteine and acetyl cysteine conjugated to the quinone intermediate and the resulting adducts, cysteine-derivatives of acetaminophen accumulate in nonsurvivors. Metabolites selected are representative of the significantly different drug xenobiotics identified by the semiquantitative analysis.
Figure 3
Figure 3
Demographics and semiquantitative analysis of sepsis outcomes predictive metabolite. (AF) semiquantitative analysis of outcome predictive metabolites. Significant difference using ANOVA and 5% FDR. *, significantly different from discharge; #, significantly different from time-matched survivor. Figures made utilizing GraphPad Prism 7.0. https://www.graphpad.com/scientific-software/prism/.
Figure 4
Figure 4
Correlation analysis of quantitative and semiquantitative results. Spearman’s Rank correlation analysis performed on quantitative (Biocrates) and semiquantitative (Metabolon) results shows a strong correlation (r = 0.79–0.97) and comparable predictive value for each pathway measured. Figures made utilizing JMP Genomics 8.0, https://www.jmp.com/en_us/software/genomics-data-analysis-software.html.
Figure 5
Figure 5
AUROC analysis of lactate and MetSeP score. APACHEIII was measured in the TARGET patients at ICU admittance. MetSeP was measured using semiquantitative results from Metabolon and quantitative analyses. Logistic regression shows that APACHEIII values were less accurate (area under the curve; AUC = 0.76) for patient outcome prediction than MetSeP scores (AUC = 0.97 and 0.91, respectively). Figures made utilizing JMP Genomics 8.0, https://www.jmp.com/en_us/software/genomics-data-analysis-software.html.

Similar articles

Cited by

References

    1. Matthay MA, et al. Acute respiratory distress syndrome. Nat Rev Dis Primers. 2019;5:18. doi: 10.1038/s41572-019-0069-0. - DOI - PMC - PubMed
    1. Metwaly S, et al. Evolution of ARDS biomarkers: will metabolomics be the answer? Am J Physiol Lung Cell Mol Physiol. 2018;315:L526–L534. doi: 10.1152/ajplung.00074.2018. - DOI - PMC - PubMed
    1. Suliman HB, Piantadosi CA. Mitochondrial biogenesis: regulation by endogenous gases during inflammation and organ stress. Curr Pharm Des. 2014;20:5653–5662. doi: 10.2174/1381612820666140306095717. - DOI - PMC - PubMed
    1. Piantadosi CA, Suliman HB. Mitochondrial dysfunction in lung pathogenesis. Annu Rev Physiol. 2017;79:495–515. doi: 10.1146/annurev-physiol-022516-034322. - DOI - PubMed
    1. Crouser ED. Mitochondrial dysfunction in septic shock and multiple organ dysfunction syndrome. Mitochondrion. 2004;4:729–741. doi: 10.1016/j.mito.2004.07.023. - DOI - PubMed

Publication types