Integrated metabolomic analysis and cytokine profiling define clusters of immuno-metabolic correlation in new-onset psoriasis
- PMID: 34006909
- PMCID: PMC8131691
- DOI: 10.1038/s41598-021-89925-7
Integrated metabolomic analysis and cytokine profiling define clusters of immuno-metabolic correlation in new-onset psoriasis
Abstract
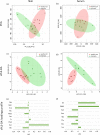
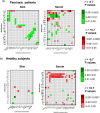
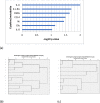
The association between the metabolic profile and inflammatory cytokines in psoriasis is poorly understood. We analyzed the metabolic and cytokine/chemokine profiles in serum and skin from patients with new-onset psoriasis and healthy subjects (n = 7/group) by HR-MAS NMR and Bio-Plex immunoassay. Immuno-metabolic correlation matrix was analyzed in skin and serum to identify a potential immune-metabolic signature. Metabolomics analysis showed a significant increase in ascorbate and a decrease in scyllo-inositol, and a trend towards an increase in eight other metabolites in psoriatic skin. In serum, there was a significant increase of dimethylglycine and isoleucine. In parallel, psoriatic skin exhibited an increase of early inflammatory cytokines (IL-6, IL-8, TNF-α, IL-1β) and correlation analysis highlighted some major clusters of immune-metabolic correlations. A cluster comprising scyllo-inositol and lysine showed correlations with T-cell cytokines; a cluster comprising serine and taurine showed a negative correlation with early inflammatory cytokines (IL-6, G-CSF, CCL3). A strong positive correlation was enlightened between glutathione and inflammatory cytokines/angiogenesis promoters of psoriasis. The integration of metabolic and immune data indicated a molecular signature constituted by IL-6, IL1-ra, DMG, CCL4, Ile, Gly and IL-8, which could discriminate patients and healthy subjects and could represent a candidate tool in the diagnosis of new-onset psoriasis.
Conflict of interest statement
The authors declare no competing interests.
Figures


Similar articles
-
Circulating Metabolomic Signature in Generalized Pustular Psoriasis Blunts Monocyte Hyperinflammation by Triggering Amino Acid Response.Front Immunol. 2021 Sep 8;12:739514. doi: 10.3389/fimmu.2021.739514. eCollection 2021. Front Immunol. 2021. PMID: 34567002 Free PMC article.
-
Calcipotriol and betamethasone dipropionate exert additive inhibitory effects on the cytokine expression of inflammatory dendritic cell-Th17 cell axis in psoriasis.J Dermatol Sci. 2016 Mar;81(3):153-64. doi: 10.1016/j.jdermsci.2015.12.009. Epub 2015 Dec 23. J Dermatol Sci. 2016. PMID: 26794805
-
A distinct multicytokine profile is associated with anti-cyclical citrullinated peptide antibodies in patients with early untreated inflammatory arthritis.J Rheumatol. 2004 Dec;31(12):2336-46. J Rheumatol. 2004. PMID: 15570632
-
Cytokine network in psoriasis revisited.Eur Cytokine Netw. 2011 Dec;22(4):160-8. doi: 10.1684/ecn.2011.0294. Eur Cytokine Netw. 2011. PMID: 22236965 Review.
-
Systemic inflammatory response to exhaustive exercise. Cytokine kinetics.Exerc Immunol Rev. 2002;8:6-48. Exerc Immunol Rev. 2002. PMID: 12690937 Review.
Cited by
-
Inhibition of LPS-Induced Inflammatory Response of Oral Mesenchymal Stem Cells in the Presence of Galectin-3.Biomedicines. 2023 May 24;11(6):1519. doi: 10.3390/biomedicines11061519. Biomedicines. 2023. PMID: 37371614 Free PMC article.
-
Toward Personalized Interventions for Psoriasis Vulgaris: Molecular Subtyping of Patients by Using a Metabolomics Approach.Front Mol Biosci. 2022 Jul 19;9:945917. doi: 10.3389/fmolb.2022.945917. eCollection 2022. Front Mol Biosci. 2022. PMID: 35928224 Free PMC article.
-
Development of metabolome extraction strategy for metabolite profiling of skin tissue.Metabolomics. 2024 Apr 29;20(3):48. doi: 10.1007/s11306-024-02120-3. Metabolomics. 2024. PMID: 38683208
-
Uremic Toxins and Inflammation: Metabolic Pathways Affected in Non-Dialysis-Dependent Stage 5 Chronic Kidney Disease.Biomedicines. 2024 Mar 7;12(3):607. doi: 10.3390/biomedicines12030607. Biomedicines. 2024. PMID: 38540220 Free PMC article.
-
Therapeutic Potential of Combining IL-6 and TNF Blockade in a Mouse Model of Allergic Asthma.Int J Mol Sci. 2022 Mar 24;23(7):3521. doi: 10.3390/ijms23073521. Int J Mol Sci. 2022. PMID: 35408882 Free PMC article.
References
Publication types
MeSH terms
Substances
LinkOut - more resources
Full Text Sources
Other Literature Sources

