. 2021 May 18;11(1):10527.
doi: 10.1038/s41598-021-89558-w.

Kokumi taste perception is functional in a model carnivore, the domestic cat (Felis catus)

Affiliations

Kokumi taste perception is functional in a model carnivore, the domestic cat (Felis catus)

A Laffitte et al. Sci Rep. .

Abstract

Kokumi taste is a well-accepted and characterised taste modality and is described as a sensation of enhancement of sweet, salty, and umami tastes. The Calcium Sensing Receptor (CaSR) has been designated as the putative kokumi taste receptor for humans, and a number of kokumi-active ligands of CaSR have been discovered recently with activity confirmed both in vivo and in vitro. Domestic cats (Felis catus) are obligate carnivores and accordingly, their diet is abundant in proteins, peptides, and amino acids. We hypothesised that CaSR is a key taste receptor for carnivores, due to its role in the detection of different peptides and amino acids in other species. Using in silico, in vitro and in vivo approaches, here we compare human CaSR to that of a model carnivore, the domestic cat. We found broad similarities in ligand specificity, but differences in taste sensitivity between the two species. Indeed our in vivo data shows that cats are sensitive to CaCl2 as a kokumi compound, but don't show this same activity with Glutathione, whereas for humans the reverse is true. Collectively, our data suggest that kokumi is an important taste modality for carnivores that drives the palatability of meat-derived compounds such as amino acids and peptides, and that there are differences in the perception of kokumi taste between carnivores and omnivores.


Conflict of interest statement

A.L., M.G., C.HdA., J.A., Z.N.L., D.W.L., and S.J.M. are all employees of Mars Petcare UK. All of the work presented was funded by Mars Petcare UK.

Figures

Figure 1
Figure 1
CaSR is expressed in cat circumvallate papillae (a). GAPDH is expressed in both circumvallate papillae and non-taste epithelial tissue (b). (a) CaSR RT-PCR for a cat circumvallate papilla (CV), non-taste epithelial tissue (NT) and no-template controls (NTC). (b) GAPDH RT-PCR was used as a positive control in the same tissues. Expression of CaSR was only observed in the CV tissue. M—Molecular size marker.
Figure 2
Figure 2
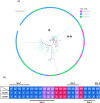
CaSR phylogenetic tree of mammalian species (a) and alignment of the residues from all four Ca2+ binding sites compared between cCaSR and hCaSR (b). (a) Labels are coloured by diet type (green = herbivore; blue = omnivore; pink = carnivore). *—Homo sapiens, **—Felis catus. (b) Sequence alignment comparing the residues that bind Ca2+ (blue), GSH (red) or both (purple) for hCaSR and cCaSR. The sites indicated, correspond to Ca2+ binding sites on the receptor .
Figure 3
Figure 3
NTD with Ca2+ of the hCaSR crystal structure (left) and homology model of cCaSR (right) (a). hCaSR (left) and cCaSR (right) with GSH bound into their respective binding sites (b). (a) The Ca2+ binding site of hCaSR (left) and the Ca2+ binding site of cCaSR (right). The secondary structure of the hCaSR protein is in grey. The Ca2+ binding site of hCaSR (PDB structure 5fbk that was the template for cCaSR) is identical to cCaSR, including the enumeration of the amino-acids. The secondary structure of the cCaSR protein is in cyan. (b) The GSH (in green) binding site is also situated in the NTD of hCaSR (left) and cCaSR (right). The GSH binding site of hCaSR is identical to cCaSR, including the enumeration of the amino-acids. In both species, hydrogen bonds form with residues ALA168, THR145, SER147, SER170, SER272, GLU297; hydrophobic interaction with TYR218; charged interaction of zwitterionic nitrogen of the amino acid group to GLU297; charged interaction of the carboxyl group to Ca2+ (not shown for clarity of image). The images were generated using with the Discovery Studio Visualizer (BIOVIA, Dassault Systèmes).
Figure 4
Figure 4
Schematic representation of the hypothesis driven, iterative approach used to predict ligand binding into cCaSR. In the process, we used information from literature on hCaSR, as well as our homology model used for docking. Between sample set I and sample set II, some compounds were repeated, and a final number of 159 unique compounds were screened on cCaSR.
Figure 5
Figure 5
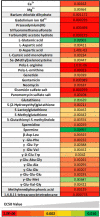
Heat map generated with CaSR agonists, classed according to their affinity for cCaSR. The Compounds with higher affinities (low µM range) appear in bright red, compounds with medium affinity in different hues of orange (mid to high µM range), and finally the compounds with lower affinities with the receptor are colored in green (mM range).
Figure 6
Figure 6
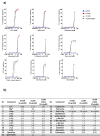
Both hCaSR and cCaSR bind agonists with similar affinities when expressed in the same cellular system (a). The EC50 values calculated for all the constructs are within similar ranges (b). (a) For each ligand the response of transiently expressed hCaSR (red square) and cCaSR (green triangle) and stably expressed cCaSR (purple triangle) were measured in response to increasing doses of the ligand. The maximal response used to calculate the % of maximal response was measured with CaCl2 at 30 mM. The measurements were made with luminescence, and each point was repeated in two independent measurements, and is represented with ± SEM. In each case, the measurements were made in parallel with cells containing the corresponding CaSR vectors, and cells containing a mock vector (blue circle) to confirm specificity of response. (b) All EC50 values are expressed in mM, except for poly-L-arginine which is expressed in µg/ml. All measurements were repeated over at least three wells on the same assay plate. If the maximal response to a compound was not reached, the EC50 value could not be determined and is expressed as an estimation at > 3 mM.
Figure 7
Figure 7
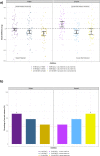
In vivo response of cats to three cCaSR agonists, CaCl2, MgCl2 and GSH, measured on a water panel in water and umami mix (15 mM L-Phe, 15 mM L-His and 15 mM L-Trp) (a). Human sensory panel evaluation of three compounds, CaCl2, MgCl2 and GSH, measured in Water and Umami Mix (1.18 mM MSG, 0.57 mM IMP and 119.7 mM NaCl) (b). (a) The cats did not significantly differentiate between water and CaCl2 (dark purple dots) at 8 mM, and there was no significant difference in intake (P = 0.3848). However, with the umami amino acid mix, the cats showed significant (P = 0.0039) preference to the mix that was supplemented with CaCl2 (light purple dots). The cats rejected the MgCl2 (dark blue dots) solution in comparison to pure water, and had a significantly lower intake of the MgCl2 solution (P = 0.0023). Similarly, the cats also significantly rejected the amino acid mixture containing MgCl2 (light blue dots) when compared to the amino acid mixture on its own (P = 0.0009). Finally, the cats significantly rejected the GSH solution (dark yellow dots) and had a lower intake for it when compared to pure water (P = 0.0002), and they had no significant preference to the amino acid mixture supplemented with GSH (light yellow dots) compared to the amino acid mixture on its own (P = 0.0630). n = 24 for all tests. For each compound, the test was repeated on two separate days, while switching the sides of the drinkers to account for side bias. (b) The assessors significantly differentiated CaCl2 in water (dark purple bar), but did not find any difference with the solutions proposed containing the synthetic umami mixture (light purple bar). The assessors did not differentiate the MgCl2 solutions significantly in either of the solutions proposed, water (dark blue bar) or the umami mix (light blue bar). The assessors did not significantly differentiate the GSH solubilised in water when compared with the blank (dark yellow bar), however they did differentiate it in the synthetic umami mix (light yellow bar). For each test, statistical significance was determined by a p-value ≤ 0.05 and n = 24 for all tests, except for MgCl2 in water and umami mix where n = 25.

Similar articles

Cited by

References

    1. Yarmolinsky DA, Zuker CS, Ryba NJ. Common sense about taste: From mammals to insects. Cell. 2009;139:234–244. doi: 10.1016/j.cell.2009.10.001. - DOI - PMC - PubMed
    1. Gaillard D, Kinnamon SC. New evidence for fat as a primary taste quality. Acta Physiol. (Oxf. Engl). 2019;226:e13246. doi: 10.1111/apha.13246. - DOI - PMC - PubMed
    1. Pires MA, Pastrana LM, Fuciños P, Abreu CS, Oliveira SM. 2020. Sensorial Perception of astringency: Oral mechanisms and current analysis methods. Foods (Basel, Switzerland) - DOI - PMC - PubMed
    1. Pirkwieser P, Behrens M, Somoza V. Metallic sensation-just an off-flavor or a biologically relevant sensing pathway? J. Agric. Food Chem. 2020 doi: 10.1021/acs.jafc.0c06463. - DOI - PubMed
    1. Rhyu M-R, et al. Kokumi taste active peptides modulate salt and umami taste. Nutrients. 2020;12:1198. doi: 10.3390/nu12041198. - DOI - PMC - PubMed