. 2021 May 18;11(1):10494.
doi: 10.1038/s41598-021-88698-3.

In-depth transcriptomic analysis of human retina reveals molecular mechanisms underlying diabetic retinopathy

Affiliations

In-depth transcriptomic analysis of human retina reveals molecular mechanisms underlying diabetic retinopathy

Kolja Becker et al. Sci Rep. .

Abstract

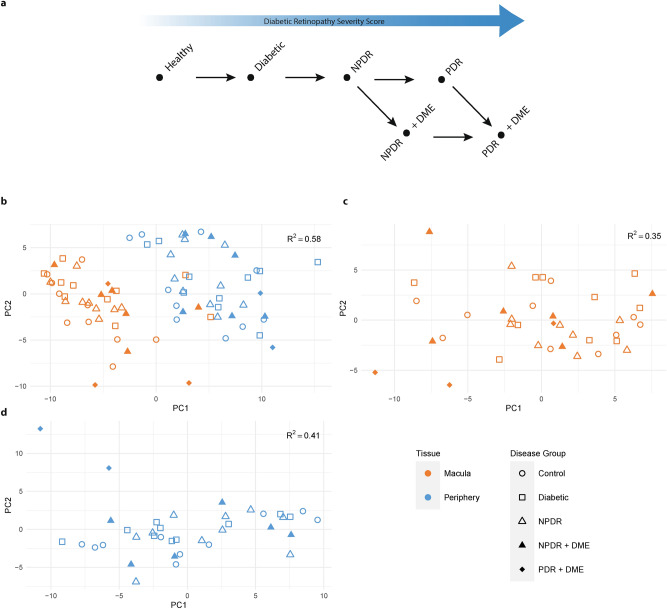
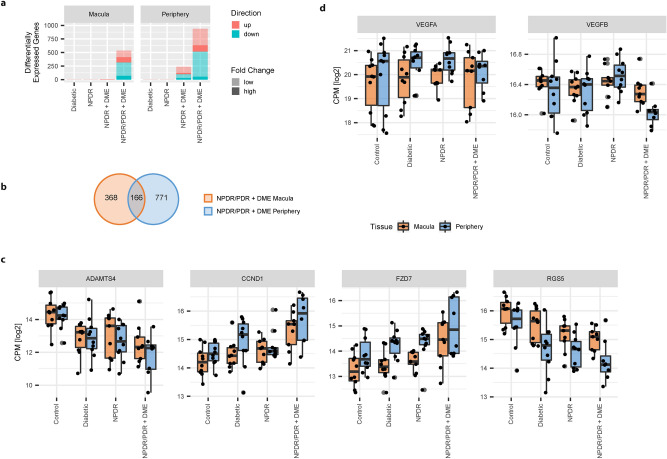
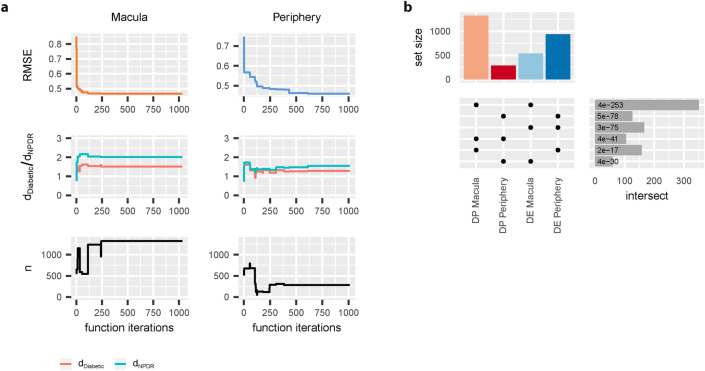
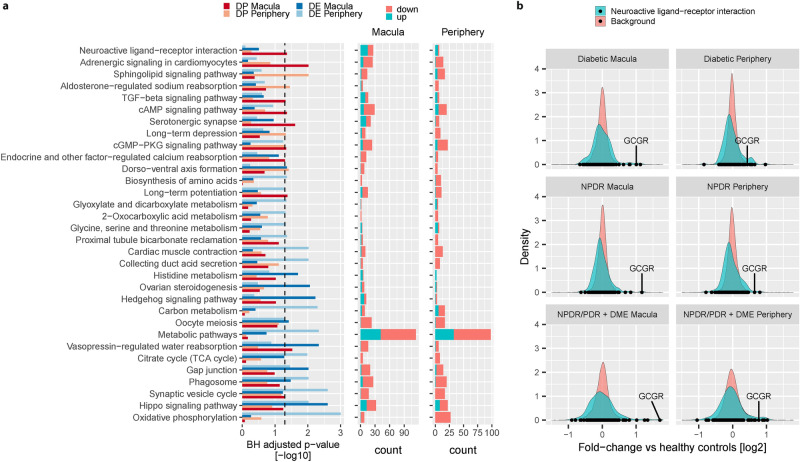
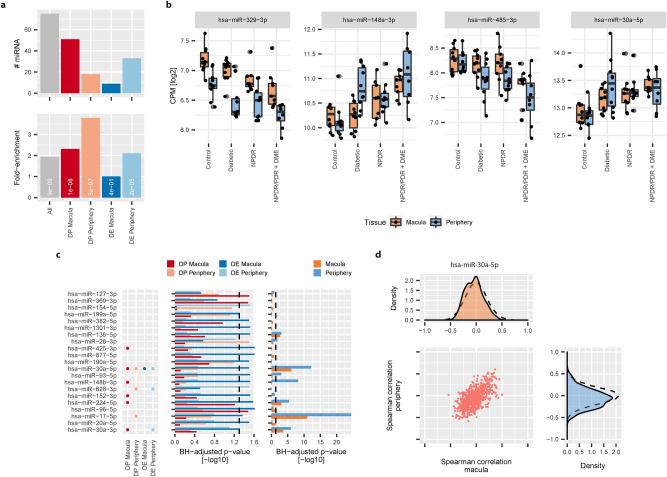
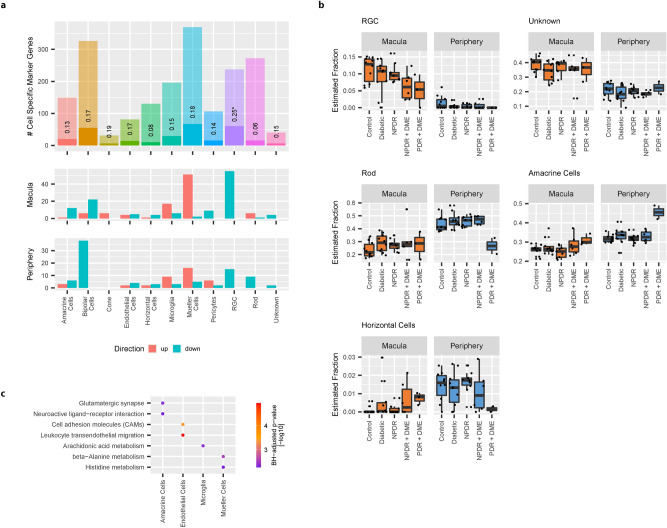
Diabetic Retinopathy (DR) is among the major global causes for vision loss. With the rise in diabetes prevalence, an increase in DR incidence is expected. Current understanding of both the molecular etiology and pathways involved in the initiation and progression of DR is limited. Via RNA-Sequencing, we analyzed mRNA and miRNA expression profiles of 80 human post-mortem retinal samples from 43 patients diagnosed with various stages of DR. We found differentially expressed transcripts to be predominantly associated with late stage DR and pathways such as hippo and gap junction signaling. A multivariate regression model identified transcripts with progressive changes throughout disease stages, which in turn displayed significant overlap with sphingolipid and cGMP-PKG signaling. Combined analysis of miRNA and mRNA expression further uncovered disease-relevant miRNA/mRNA associations as potential mechanisms of post-transcriptional regulation. Finally, integrating human retinal single cell RNA-Sequencing data revealed a continuous loss of retinal ganglion cells, and Müller cell mediated changes in histidine and β-alanine signaling. While previously considered primarily a vascular disease, attention in DR has shifted to additional mechanisms and cell-types. Our findings offer an unprecedented and unbiased insight into molecular pathways and cell-specific changes in the development of DR, and provide potential avenues for future therapeutic intervention.


Conflict of interest statement

KB, HK, ES, CV, GL, CS, FFA, and RAB are employed by Boehringer Ingelheim Pharma GmbH & Co. KG. CH is employed by Boehringer Ingelheim RCV GmbH & Co KG. VC is employed by BI International GmbH. MHK has no conflict of interest.

Figures

Figure 1
Figure 1
Gene expression differences between sample sites: (a) Schematic of disease progression in DR (NPDR: Non-Proliferative Diabetic Retinopathy, PDR: Proliferative Diabetic Retinopathy, DME: Diabetic Macular Edema). From left to right the Diabetic Retinopathy Severity Score (DRSS) increases. (b) Principal component analysis (PCA) scores of combined and processed mRNA and miRNA expression values for all samples. (c) PCA scores of macula samples only. (d) PCA scores of periphery samples only. In all cases, PCA was applied to the top 100 most variable features in each sample group (all, macula, periphery). Cumulative R2-values for two principal components are shown in the upper right corner.
Figure 2
Figure 2
Significant changes in late stage disease progression: (a) Barplot with number of significant changes in RNA expression between disease groups and healthy control (BH adjusted p value < 0.05). Gene expression changes with fold-change below 50% are transparent. Up- and down-regulation are shown in red and blue respectively. (b) Venn diagram showing the overlap between macula and periphery of differentially expressed transcripts identified in the NPDR/PDR + DME group. (c) Log2 CPM expression values (black dots) of significantly changing genes identified from NPDR/PDR + DME samples with strongest mean fold-change between macula and periphery. Black line denotes median log2 CPM. Boxplot lower and upper hinges correspond to the first and third quartiles respectively. Whiskers extend to the largest expression value no further than 1.5 interquartile range from the hinge. Outliers are shown in transparent gray. (d) Log2 CPM values (black dots) of VEGFA and VEGFB expression throughout subsequent disease groups. Boxplot specifications correspond to those given in the previous plot.
Figure 3
Figure 3
Identification of disease progression genes: (a) Convergence properties of sparse partial least squares regression model to identify disease progression (DP) transcripts: Minimum Root Mean Squared Prediction Error (RMSE) of the regression model after each function iteration for macula and periphery (upper panel). Value of dDiabetic and dNPDR model hyperparameters for the best model fit at each function iteration (middle panel) for macula and periphery samples. Number of selected transcripts (n) for the best model fit at each function iteration (lower panel). (b) Comparison of identified DP RNA with RNA identified from differential gene expression analysis (upper panel) and corresponding two-set intersects (lower right panel). Values in the lower right panel denote BH adjusted p values (hypergeometric test).
Figure 4
Figure 4
Molecular pathways associated with different disease stages of DR: (a) Barplot showing BH-adjusted p values of KEGG 2016 pathway enrichment analysis for each the four identified groups of disease-associated transcripts (left panel, Oxidative phosphorylation BH adjusted p value = 1.15e−07). Only pathways with BH-adjusted p value < 0.05 are shown. Middle and right panel indicate the direction of change in NPDR/PDR + DME samples vs healthy control for each of the significantly changing transcripts included in a given pathway (Middle panel: Macula; Right panel: Periphery). (b) Distribution of fold-changes for each sample group vs healthy controls for transcripts associated with the Neuroactive ligand–receptor interaction pathway. Black dots indicate fold-changes of individual genes in the Neuroactive ligand–receptor interaction pathway. As example, we specifically plot Glucagon Receptor (GCGR). The background distribution shows fold-changes [log2] of all transcripts not included in the pathway.
Figure 5
Figure 5
Integrated analysis of miRNA and mRNA expression: (a) Number of miRNA in all identified disease-associated transcripts (upper panel, gray bar) or in each group of identified disease-associated transcripts. Lower panel shows relative enrichment (observed vs expected) of miRNA in each of the defined disease-associated groups. White labels correspond to BH-corrected p values of a hypergeometric test. (b) Log2 CPM expression of miRNA identified in all four groups of disease-associated transcripts (black dots). Black line denotes median log2 CPM. Boxplot lower and upper hinges correspond to the first and third quartiles respectively. Whiskers extend to the largest expression value no further than 1.5 interquartile range from the hinge. Outliers are shown in transparent gray. (c) Barplot of BH-adjusted p values [− log10] of miRNA target enrichment analysis for each of the four identified groups of disease-associated genes (left panel). Only miRNA with significant enrichment of their target genes in any of the four defined groups of disease-associated mRNA are shown. Dashed line indicates the level of significance chosen (BH-adjusted p value < 0.05). Right panel shows BH-adjusted p values [− log10] of a Kolmogorov–Smirnov test for negative skew in correlation between miRNA and target mRNA expression (Orange: Macula samples, Blue: Periphery samples). (d) Distribution of Spearman correlation values between miR-30a-5p and its putative target genes in either macula (upper panel) or periphery samples (right panel). Dashed line corresponds to background distribution of 100.000 correlations between non-associated miRNA/mRNA pairs. Middle panel represents the scatter plot for individual Spearman correlation values between miR-30a-5p and its targets.
Figure 6
Figure 6
Cell specific expression of disease-associated RNA: (a) Enrichment of disease-associated genes with cell type specific genes identified from single cell RNASeq data. Barplots indicate the number of cell type specific marker genes identified for each cell type (upper panel). Non-transparent area of bars show the overlap of disease-associated genes (union of DE and DP genes from macula and periphery) with cell type specific marker genes. Middle and lower panel correspond to the direction of expression changes in NPDR/PDR + DME samples vs healthy controls of disease-associated genes (Middle panel: Macula; Lower panel: Periphery). (b) Estimation of cell type abundances from bulk retinal samples using deconvolution. Black dots show predicted fraction of different cell types in each of the bulk retinal samples. Black line indicates the median fraction of different cell types in each disease group. Boxplot lower and upper hinges correspond to the first and third quartiles respectively. Whiskers extend to the largest cell type fraction no further than 1.5 interquartile range from the hinge. Outliers are shown in transparent gray. (c) Enrichment of cell type specific disease-associated genes with molecular pathways. Plot shows significant (Hypergeometric test, BH-adjusted p value < 0.01) associations between cell type specific disease-associated genes and KEGG 2016 pathways. Color indicates BH-adjusted p values [− log10].

Similar articles

Cited by

References

    1. Lee R, Wong TY, Sabanayagam C. Epidemiology of diabetic retinopathy, diabetic macular edema and related vision loss. Eye Vis. (Lond.) 2015;2:17. doi: 10.1186/s40662-015-0026-2. - DOI - PMC - PubMed
    1. Amoaku WM, et al. Diabetic retinopathy and diabetic macular oedema pathways and management: UK Consensus Working Group. Eye (Lond.) 2020;34:1–51. doi: 10.1038/s41433-020-0961-6. - DOI - PMC - PubMed
    1. Fundus photographic risk factors for progression of diabetic retinopathy. ETDRS report number 12. Early Treatment Diabetic Retinopathy Study Research Group. Ophthalmology98, 823–833 (1991). - PubMed
    1. Wong TY, et al. Guidelines on diabetic eye care: The international council of ophthalmology recommendations for screening, follow-up, referral, and treatment based on resource settings. Ophthalmology. 2018;125:1608–1622. doi: 10.1016/j.ophtha.2018.04.007. - DOI - PubMed
    1. Wykoff CC, et al. Predictors of diabetic macular edema treatment frequency with ranibizumab during the open-label extension of the RIDE and RISE trials. Ophthalmology. 2016;123:1716–1721. doi: 10.1016/j.ophtha.2016.04.004. - DOI - PubMed