. 2021 May 18;11(1):10511.
doi: 10.1038/s41598-021-89799-9.

Super-resolution imaging of platelet-activation process and its quantitative analysis

Affiliations

Super-resolution imaging of platelet-activation process and its quantitative analysis

Jinkyoung Chung et al. Sci Rep. .

Abstract

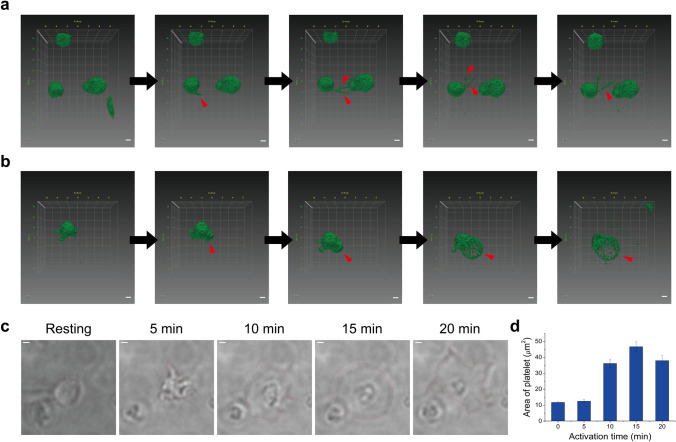
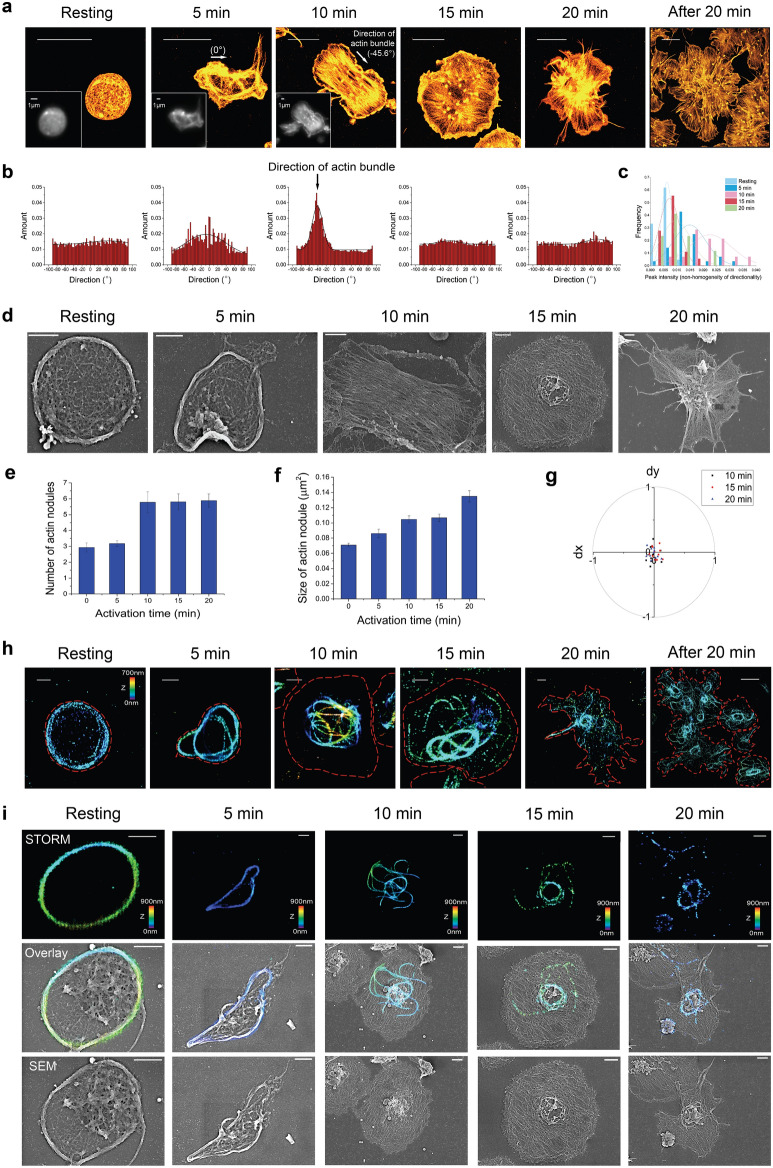
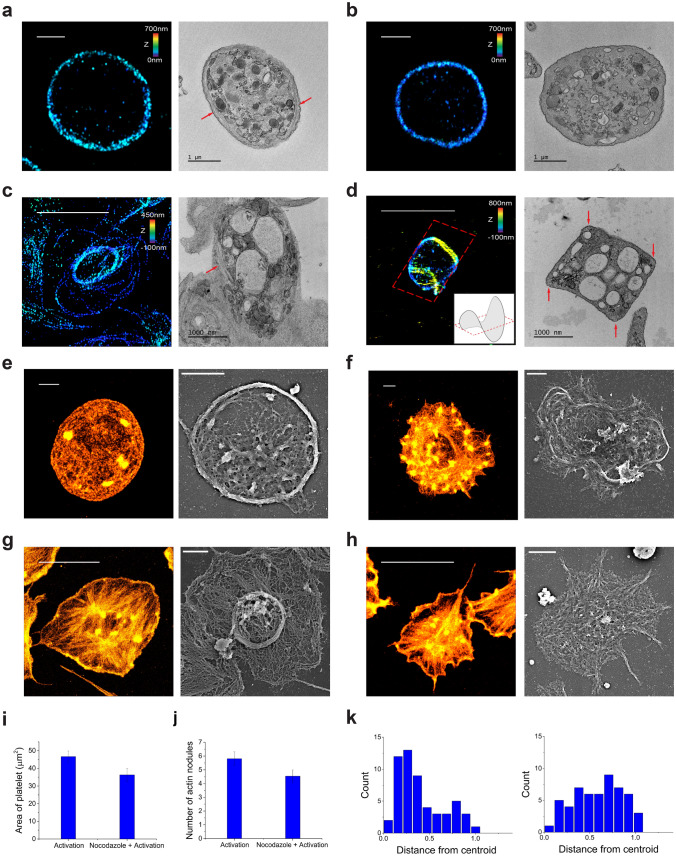
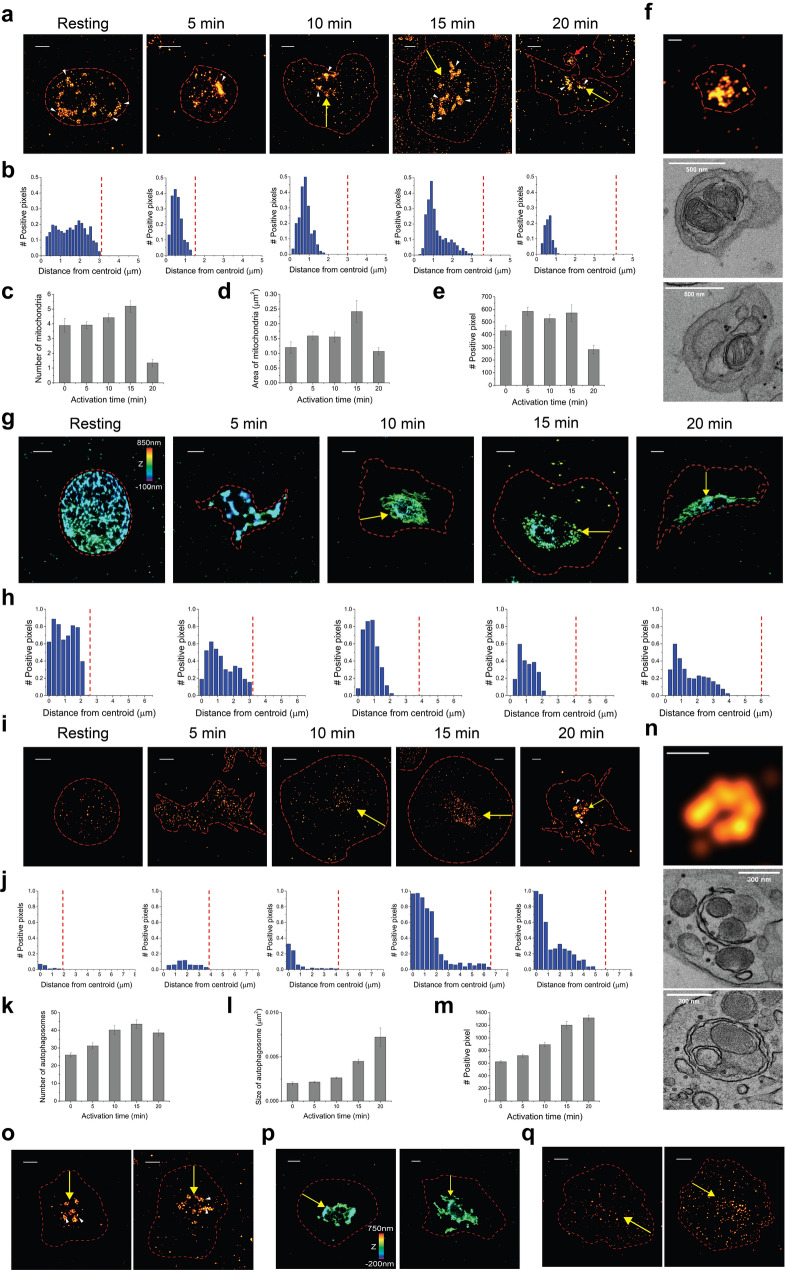
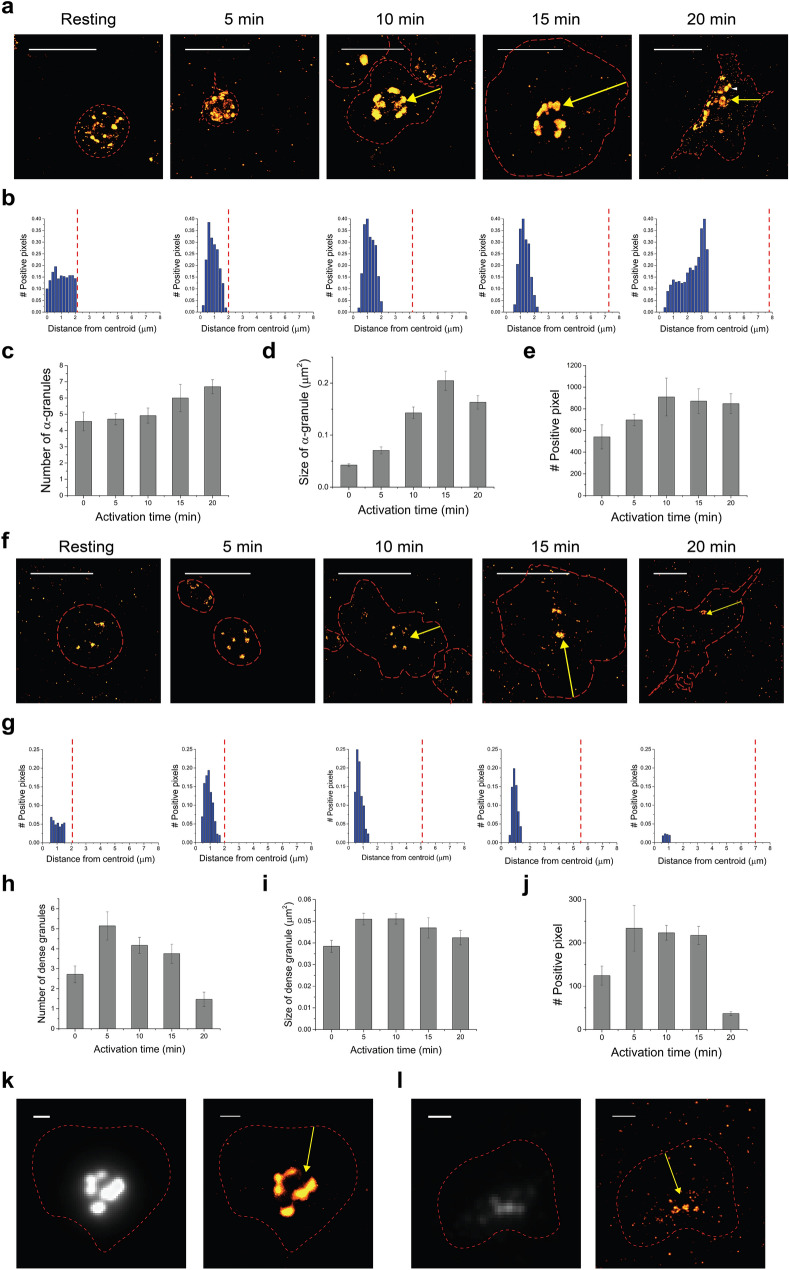
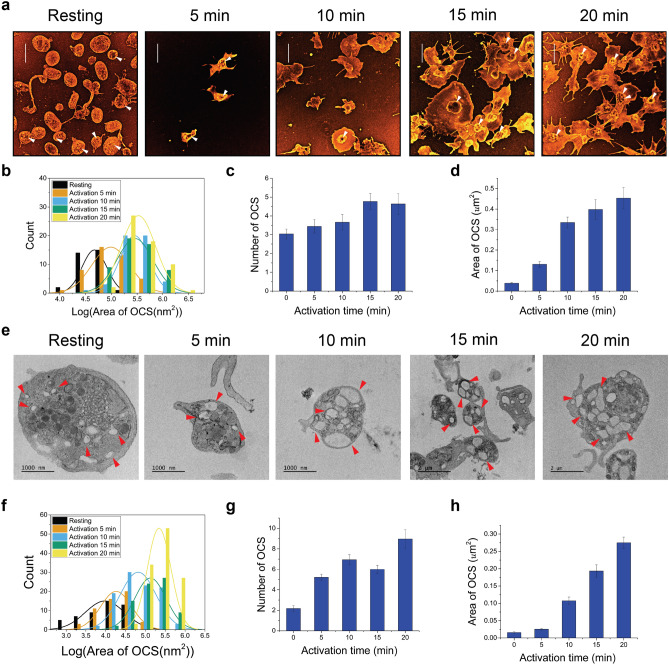
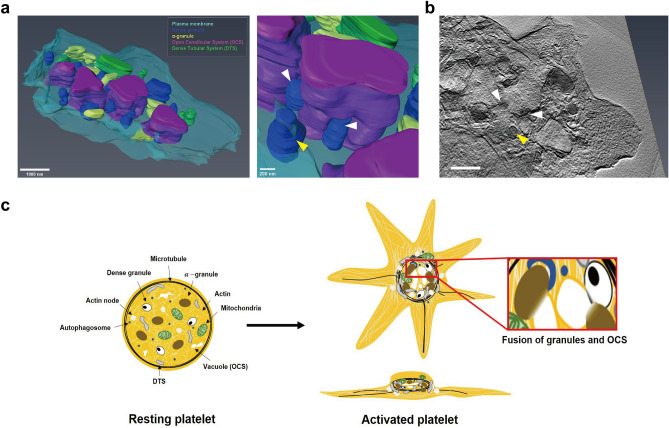
Understanding the platelet activation molecular pathways by characterizing specific protein clusters within platelets is essential to identify the platelet activation state and improve the existing therapies for hemostatic disorders. Here, we employed various state-of-the-art super-resolution imaging and quantification methods to characterize the platelet spatiotemporal ultrastructural change during the activation process due to phorbol 12-myristate 13-acetate (PMA) stimuli by observing the cytoskeletal elements and various organelles at nanoscale, which cannot be done using conventional microscopy. Platelets could be spread out with the guidance of actin and microtubules, and most organelles were centralized probably due to the limited space of the peripheral thin regions or the close association with the open canalicular system (OCS). Among the centralized organelles, we provided evidence that granules are fused with the OCS to release their cargo through enlarged OCS. These findings highlight the concerted ultrastructural reorganization and relative arrangements of various organelles upon activation and call for a reassessment of previously unresolved complex and multi-factorial activation processes.


Conflict of interest statement

The authors declare no competing interests.

Figures

Figure 1
Figure 1
Spatiotemporal dynamics of live platelets on a glass coverslip. (a) 3D optical diffraction tomography time-lapse sequence showing a platelet with dynamic protrusions (red arrow) for sensing the environment as the first step of platelet activation (5 min per snapshot). (b) 3D optical diffraction tomography time-lapse sequence showing a platelet undergoing ballooning (red arrow) on adhesion to a glass surface as the first step of platelet activation (5 min per snapshot). (c) Examples of activated platelets showing five consecutive differential-interference-contrast snapshots (5 min per snapshot). The red dashed line represents the boundary of the platelet identified from the DIC images. (d) The bar graph indicating the area change of a platelet upon activation induced by PMA (mean ± SD; n = 34–60). Scale bars 1 μm in (ac).
Figure 2
Figure 2
Super-resolution images of main cytoskeleton elements in activated platelets. (a) 2D STORM images of actin filaments in activated platelets. Actin filaments were observed from the platelets that were fixed at different activation time points (0, 5, 10, 15, and 20 min). After 20 min, the activated platelets were aggregated. (b) The directionality histogram indicating the amount of structures in a given direction to infer the preferred orientation of structures from the STORM image shown in (a). (c) The distribution of directional non-homogeneity at different activation time points (n = 14–28). (d) SEM images of activated platelets. (e,f) The bar graph indicating the number (e) and size (f) of actin node in a platelet during the activation process observed from STORM images (mean ± SD; n = 23–61). (g) The relative position difference (dx, dy) between the center of mass of nodules and the centroid of the spread platelet for activated platelets (10, 15, 20 min), showing their similar values (n = 10–12). (h) 3D STORM images of microtubules in the activated platelet. Microtubules were observed from the platelets that were fixed at different activation time points (0, 5, 10, 15, and 20 min). The red dashed line represents the boundary of the platelet identified from the corresponding DIC images (white arrows: formation of the small microtubule ring). (i) 2D and 3D STORM images of the resting (0 min) (left) and activated (15 min) platelets (right) stained for acetylated microtubules. The red dashed line represents the boundary of the platelet identified from the corresponding DIC images. (j) Correlative STORM and SEM images of microtubules in the activated platelets fixed at different activation time points (0, 5, 10, 15, and 20 min). Top: STORM; middle: overlay; bottom: SEM (white arrows: formation of the small microtubule ring; yellow arrow: pseudopodia, probably consisting of actin filaments). Scale bar 5 μm in (a) and 1 μm in (d,h,i,j).
Figure 3
Figure 3
Effect of cytochalasin D and nocodazole pretreatment on ultrastructure of activated platelets. (a) Representative 3D STORM (left) and TEM (right) images of microtubules showing the MB in the resting platelet (red arrow: microtubules). (b) Representative 3D STORM (left) and TEM (right) images of microtubules in cytochalasin-D-pretreated resting platelets showing similar structure of microtubules to that in the control sample. (c) Representative 3D STORM (left) and TEM (right) images of microtubules showing the newly formed small ring of microtubules in the activated platelet (red arrow: microtubules). (d) Representative 3D STORM (left) and TEM (right) images of microtubules showing the ‘potato-chip’-like structure of microtubules in cytochalasin-D-pretreated activated platelets. Inset in 3D STORM image: schematic representation showing ‘potato-chip-like platelet’. TEM images of the cytochalasin D-pretreated activated platelet showing the microtubule bundles at four corners of the ‘potato chip’-like structure of microtubules (red arrow). (e) Representative 2D STORM (left) and SEM (right) images of actin filaments in a resting platelet. (f) Representative 2D STORM (left) and SEM (right) images of actin filaments in nocodazole-pretreated a resting platelet. (g) Representative 3D STORM (left) and SEM (right) images of actin filaments showing the radially spreading actin bundles with centralized actin nodules and a small ring of microtubules in activated platelets. (h) Representative 3D STORM (left) and SEM (right) images of actin filaments showing the radially spreading actin bundles with relatively dispersed actin nodules in the absence of a small ring of microtubules in nocodazole-pretreated activated platelets. (i) The bar graph indicates the area of non-treated and nocodazole-pretreated activated platelets (mean ± SD; n = 32, 40). (j) The bar graph indicates the number of actin nodules in non-treated and nocodazole-pretreated activated platelets (mean ± SD; n = 33, 40). (k) The radial distribution graph of actin nodules in non-treated (left) and nocodazole-pretreated (right) activated platelets from the STORM images shown in (g,h), showing moved nodules slightly towards the edge of the spread platelets, compared to non-treated samples. Scale bar 5 μm in (c,d,g,h) and 1 μm in (a,b,e,f).
Figure 4
Figure 4
Super-resolution images of double membrane-bound organelles in activated platelets. (a) 2D STORM images of mitochondria in activated platelets. Mitochondria were observed from the platelets that were fixed at different activation time points (0, 5, 10, 15, and 20 min). Red arrow: released mitochondria from the activated platelet. Yellow arrows: centralization of mitochondria upon activation. (b) The radial distribution graph of mitochondria showing how mitochondria-positive pixel density varies as a function of distance from the centroid of the platelet is shown in (a), implying the centralization of mitochondria upon activation. (ce) The bar graph indicates the number of mitochondria per platelet (c), the averaged area of mitochondria (d), and the averaged mitochondria-positive pixel number per platelet (e) upon activation induced by PMA (mean ± SD, n = 19). (f) Representative 2D STORM (top) and TEM (middle, bottom) images of released mitochondria encapsulated in microparticles. (g) 3D STORM images of DTS in activated platelets. DTS was observed from the platelets that were fixed at different activation time points (0, 5, 10, 15, and 20 min) (yellow arrows: centralization of DTS upon activation). (h) The radial distribution graph of DTS showing how DTS-positive pixel density varies as a function of distance from the centroid of the platelet is shown in (g), implying the centralization of DTS upon activation. The vacant space in the center was observed at 10–15 min, probably suggesting OCS regions. (i) 2D STORM images of autophagosomes in activated platelets. Autophagosomes were observed from the platelets that were fixed at different activation time points (0, 5, 10, 15, and 20 min) (yellow arrows: centralization of autophagosomes upon activation). (j) The radial distribution graph of autophagosome showing how autophagosome-positive pixel density varies as a function of distance from the centroid of the platelet shown in (i), implying the centralization of autophagosome upon activation. (km) The bar graph indicates the number of autophagosome per platelet (k), the averaged area of autophagosome (l), and the averaged autophagosome-positive pixel number per platelet (m) upon activation induced by PMA (mean ± SD, n = 18). (n) Representative 2D STORM (top) and TEM (middle, bottom) images of cup-like (middle) and shell-like (bottom) structure of autophagosomes. (oq) STORM images of mitochondria (o), DTS (p), and autophagosome (q) in nocodazole-pretreated activated platelets, implying the centralization of organelles (yellow arrows) upon activation even in nocodazole treatment. Scale bar 1 μm in (a,g,i,o,p,q), 500 nm in (f) and 300 nm in (n).
Figure 5
Figure 5
Super-resolution images of secretory vesicles in activated platelets. (a) 2D STORM images of α-granules in the activated platelet. α-granules were observed from the platelets that were fixed at different activation time points (0, 5, 10, 15, and 20 min) (yellow arrows: centralization of α-granules upon activation). (b) The radial distribution graph of α-granules showing how α-granules-positive pixel density varies as a function of distance from the centroid of the platelet is shown in (a), implying the centralization of α-granules upon activation. The vacant space in the center was observed at 10–15 min, probably suggesting OCS regions. (c) The bar graph indicates the number of α-granules per platelet upon activation induced by PMA (mean ± SD; n = 10–23). (d) The bar graph indicates the size of α-granules upon activation induced by PMA (mean ± SD; n = 19–28). (e) The bar graph indicates the averaged α-granule-positive pixel number per platelet upon activation induced by PMA (mean ± SD; n = 21). (f) 2D STORM images of dense granules in the activated platelet. Dense granules were observed from the platelets that were fixed at different activation time points (0, 5, 10, 15, and 20 min) (yellow arrows: centralization of dense granules upon activation). (g) The radial distribution graph of dense granules showing how dense granules-positive pixel density varies as a function of distance from the centroid of the platelet shown in (f), implying the centralization of dense granules upon activation. The vacant space in the center was observed at 10–15 min, probably implying OCS regions. (h) The bar graph indicates the number of dense granules per platelet upon activation induced by PMA (mean ± SD; n = 7–15). (i) The bar graph shows the size of dense granules per platelet upon activation induced by PMA (mean ± SD; n = 15–34). (j) The bar graph indicates the averaged dense granule-positive pixel number per platelet upon activation induced by PMA (mean ± SD; n = 19). (k,l) Conventional (left) and 2D STORM (right) images of α-granules (k) and dense granule (l) in nocodazole-pretreated activated platelets, implying the centralization of secretory vesicles upon activation (yellow arrows) even in nocodazole treatment. The red dashed line represents the boundary of the platelet identified from the corresponding DIC images. Scale bar 5 μm in (a,f) and 1 μm in (k,l).
Figure 6
Figure 6
Super-resolution images of OCS in activated platelets. (a) 2D STORM images of a Nile Red-labeled activated platelet showing OCS. They were observed from the platelets that were fixed at different activation time points (0, 5, 10, 15, and 20 min) (white arrows: OCS). (b) The size distribution of OCS at different activation time points from 2D STORM images (n = 10). (c) The bar graph indicates the number of OCS per platelet upon activation induced by PMA from 2D STORM images (mean ± SD; n = 10). (d) The bar graph indicates the size of OCS per platelet upon activation induced by PMA from 2D STORM images (mean ± SD; n = 25–29). (e) TEM images of platelet were observed from the differentially-fixed samples at different activation time points (0, 5, 10, 15, and 20 min). Red arrows: OCS. (f) The size distribution of OCS at different activation time points from TEM images. (g) The bar graph indicates the number of OCS per platelet upon activation induced by PMA from TEM images (mean ± SD; n = 15). (h) The bar graph indicates the size of OCS per platelet upon activation induced by PMA from TEM images (mean ± SD; n = 18–34). Scale bar 5 μm in (a).
Figure 7
Figure 7
The structural organization of activated platelets. (a) The 3D reconstructed HV-EM image of activated platelets visualized at different angles. The fusion of granules and OCS were observed (white arrows). (b) The cross-section images showing the fusion of granules and OCS (white arrows). Different membrane contrasts were observed in the fused granules (white arrows) and unfused granules (yellow arrow). Scale bar 1 μm. (c) Scheme showing the structural organization of resting and activated platelets.

Similar articles

Cited by

References

    1. Koneti Rao A. Congenital disorders of platelet function: Disorders of signal transduction and secretion. Am. J. Med. Sci. 1998;316:69–76. doi: 10.1016/s0002-9629(15)40381-7. - DOI - PubMed
    1. Miao S, et al. Cancer cell-derived immunoglobulin G activates platelets by binding to platelet FcγRIIa. Cell Death Dis. 2019;10:1–13. doi: 10.1038/s41419-018-1236-z. - DOI - PMC - PubMed
    1. Poulter NS, et al. Platelet actin nodules are podosome-like structures dependent on Wiskott-Aldrich syndrome protein and ARP2/3 complex. Nat. Commun. 2015;6:7254. doi: 10.1038/ncomms8254. - DOI - PMC - PubMed
    1. Watson SP. Platelet activation by extracellular matrix proteins in haemostasis and thrombosis. Curr. Pharm. Des. 2009;15:1358–1372. doi: 10.2174/138161209787846702. - DOI - PubMed
    1. Sixma JJ, de Groot PG. Von Willebrand factor and the blood vessel wall. Mayo Clin. Proc. 1991;66:628–633. doi: 10.1016/s0025-6196(12)60523-0. - DOI - PubMed

Publication types

MeSH terms

Substances

LinkOut - more resources