. 2021 May 18;11(1):10490.
doi: 10.1038/s41598-021-89974-y.

Visual motion integration of bidirectional transparent motion in mouse opto-locomotor reflexes

Affiliations

Visual motion integration of bidirectional transparent motion in mouse opto-locomotor reflexes

L A M H Kirkels et al. Sci Rep. .

Abstract

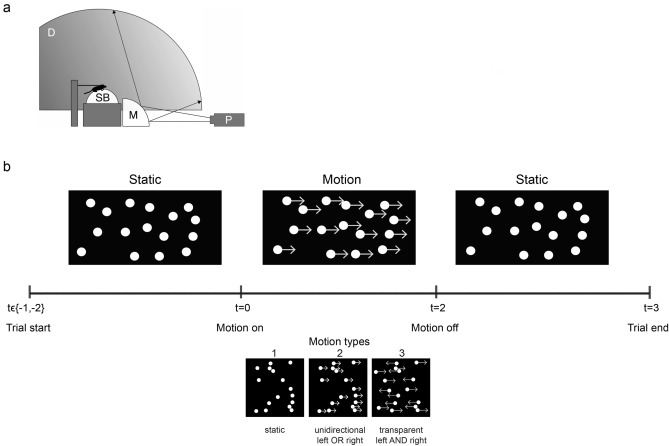
Visual motion perception depends on readout of direction selective sensors. We investigated in mice whether the response to bidirectional transparent motion, activating oppositely tuned sensors, reflects integration (averaging) or winner-take-all (mutual inhibition) mechanisms. We measured whole body opto-locomotor reflexes (OLRs) to bidirectional oppositely moving random dot patterns (leftward and rightward) and compared the response to predictions based on responses to unidirectional motion (leftward or rightward). In addition, responses were compared to stimulation with stationary patterns. When comparing OLRs to bidirectional and unidirectional conditions, we found that the OLR to bidirectional motion best fits an averaging model. These results reflect integration mechanisms in neural responses to contradicting sensory evidence as has been documented for other sensory and motor domains.


Conflict of interest statement

The authors declare no competing interests.

Figures

Figure 1
Figure 1
Stimuli and rationale. (ac) Schematic drawings of the (a) static, (b) unidirectional right and (c) bidirectional visual motion stimuli. (df) Ideal schematic OLRs over time for the (d) static, (e) unidirectional and (f) bidirectional stimuli are shown, without response variability, biases or outliers. (e) Responses to left or right unidirectional motion are indicated by blue and red, respectively. (f) Note that the two models yield different responses: the averaging model, indicated by the solid green line, predicts an OLR of 0, while the WTA model, indicated by the dashed green line, predicts either a leftward or rightward turn. The vertical yellow lines indicate end of stimulus, 2 s after stimulus onset. (gi) Schematic OLR probability distribution determined at 2 s after stimulus onset are shown for each stimulus, including response variability. The drawings for the (g) static and (h) unidirectional stimuli are fictional, but resemble data observed in earlier reports,. (i) The OLR probability distributions according to the WTA (dashed green line) and averaging (solid green line) readout rules are predicted from the fictional unidirectional motion response data in (h) (see Methods for exact predictions determined from unimodal response distributions). Note that both distributions are unimodally peaked, yet can be distinguished by their width.
Figure 2
Figure 2
OLR mean and probability distributions. (ac) Mean OLRs over time averaged across trials of five mice for the (a) static, (b) unidirectional left (blue) or right (red) and (c) bidirectional visual motion stimuli. Shaded areas represent 95% confidence intervals of the mean across trials. Trial numbers are depicted in each panel. The vertical yellow lines indicate end of stimulus, 2 s after stimulus onset. (df) OLR probability distributions determined at 2 s after stimulus onset are shown for each stimulus, including response variability. (f) The OLR probability distributions according to the WTA (dashed green line) and averaging (solid green line) readout rules are predicted from the actual unidirectional motion response data in (e). The actual OLR probability distribution is represented by the solid black line.
Figure 3
Figure 3
Temporal characteristics. (a) Averaged standard deviation of measured OLRs to bidirectional transparent motion (actual; solid black line) compared to that of WTA (dashed green line) and averaging (solid green line) predictions. (b) Inverse of the peak probability of measured OLR data (actual; solid black line) compared to that of WTA (dashed green line) and averaging (solid green line) predictions. (c) Difference in average standard deviation between measured OLR and WTA (dashed green line) or averaging (solid green line) predictions. (d) Difference in inverse peak probability between measured OLR and WTA (dashed green line) or averaging (solid green line) predictions. All curves are averages across all animals (n = 5). Shaded areas represent 95% confidence intervals of the mean across animals (n = 5).
Figure 4
Figure 4
Experimental setup. (a) Schematic drawing of the setup. Projector (P) displayed patterns of randomly positioned dots via a mirror (M) onto the inside of a dome (D). Mice ran under head-fixed conditions on a Styrofoam ball (SB) floating on air. (b) The time course of trials for (moving) dot patterns. Trials started with presentation of either 1 or 2 s of stationary dots followed by 2 s of one of four “motion types” (1) static, (2) unidirectional leftward OR rightward moving at 36 deg/s or (3) bidirectional transparent leftward AND rightward moving at 36 deg/s. Trials ended with 1 s of stationary dots.

Similar articles

Cited by

References

    1. Groh JM, Born RT, Newsome WT. How is a sensory map read out? Effects of microstimulation in visual area MT on saccades and smooth pursuit eye movements. J. Neurosci. 1997;17:4312–4330. doi: 10.1523/JNEUROSCI.17-11-04312.1997. - DOI - PMC - PubMed
    1. Lisberger SG, Ferrera VP. vector averaging for smooth pursuit eye movements initiated by two moving targets in monkeys. J. Neurosci. 1997;17:7490–7502. doi: 10.1523/JNEUROSCI.17-19-07490.1997. - DOI - PMC - PubMed
    1. O’Connell RG, Shadlen MN, Wong-Lin KF, Kelly SP. Bridging neural and computational viewpoints on perceptual decision-making. Trends Neurosci. 2018;41:838–852. doi: 10.1016/j.tins.2018.06.005. - DOI - PMC - PubMed
    1. Salzman CD, Murasugi CM, Britten KH, Newsome WT. Microstimulation in visual area MT: effects on direction discrimination performance. J. Neurosci. 1992;72:2331–2355. doi: 10.1523/JNEUROSCI.12-06-02331.1992. - DOI - PMC - PubMed
    1. van Wezel RJA, Britten KH. Multiple uses of visual motion. The case for stability in sensory cortex. Neuroscience. 2002;111:739–759. doi: 10.1016/S0306-4522(02)00036-2. - DOI - PubMed

Publication types

LinkOut - more resources