. 2021 May;7(5):696-705.
doi: 10.1038/s41477-021-00913-1. Epub 2021 May 17.

A general non-self response as part of plant immunity

Affiliations

A general non-self response as part of plant immunity

Benjamin A Maier et al. Nat Plants. 2021 May.

Abstract

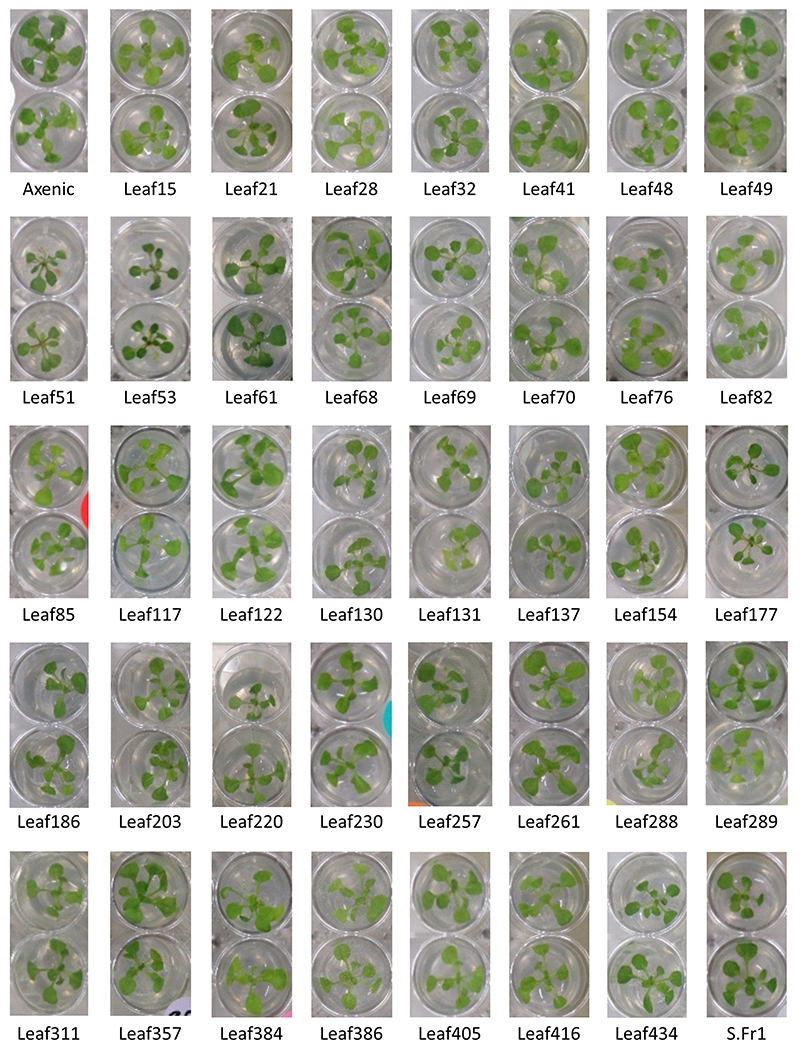
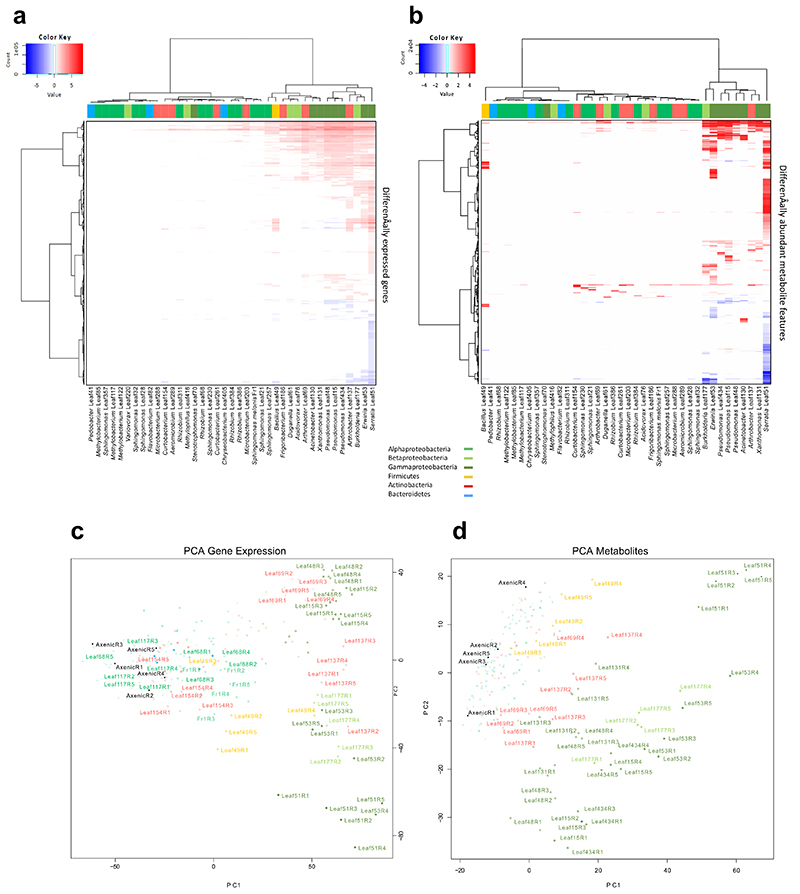
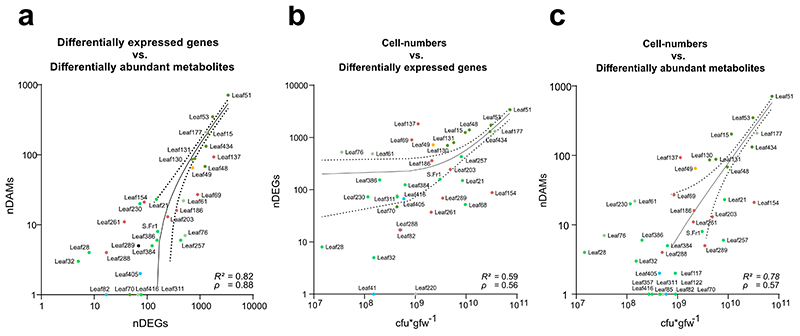
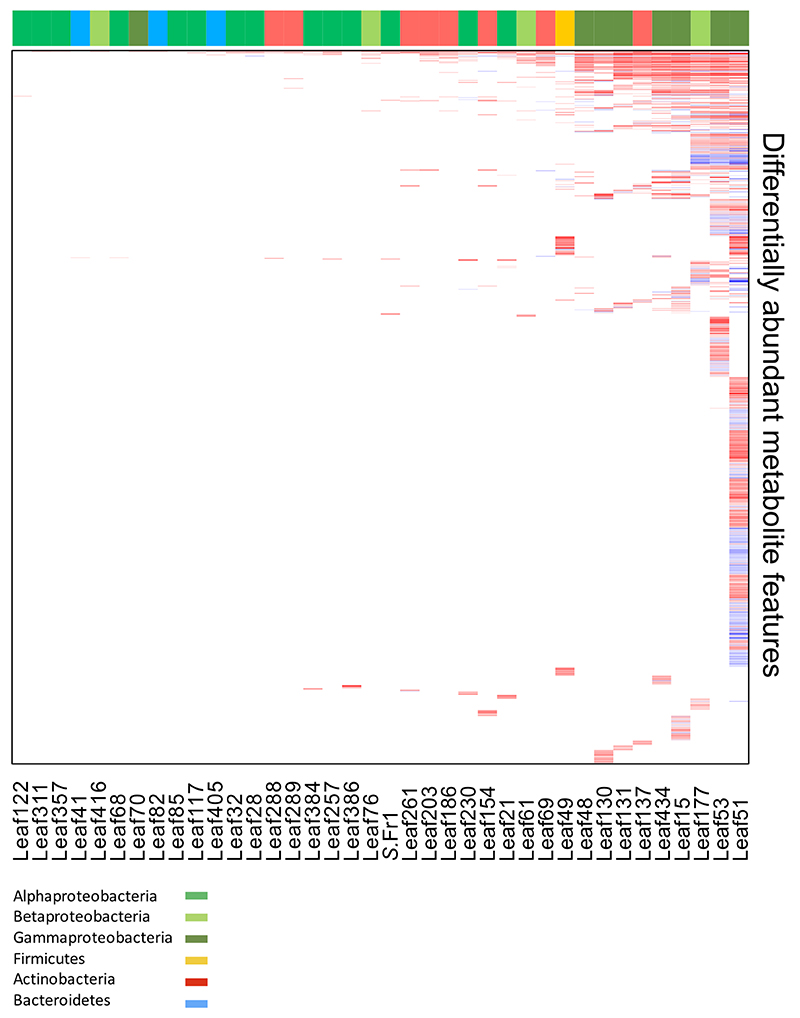
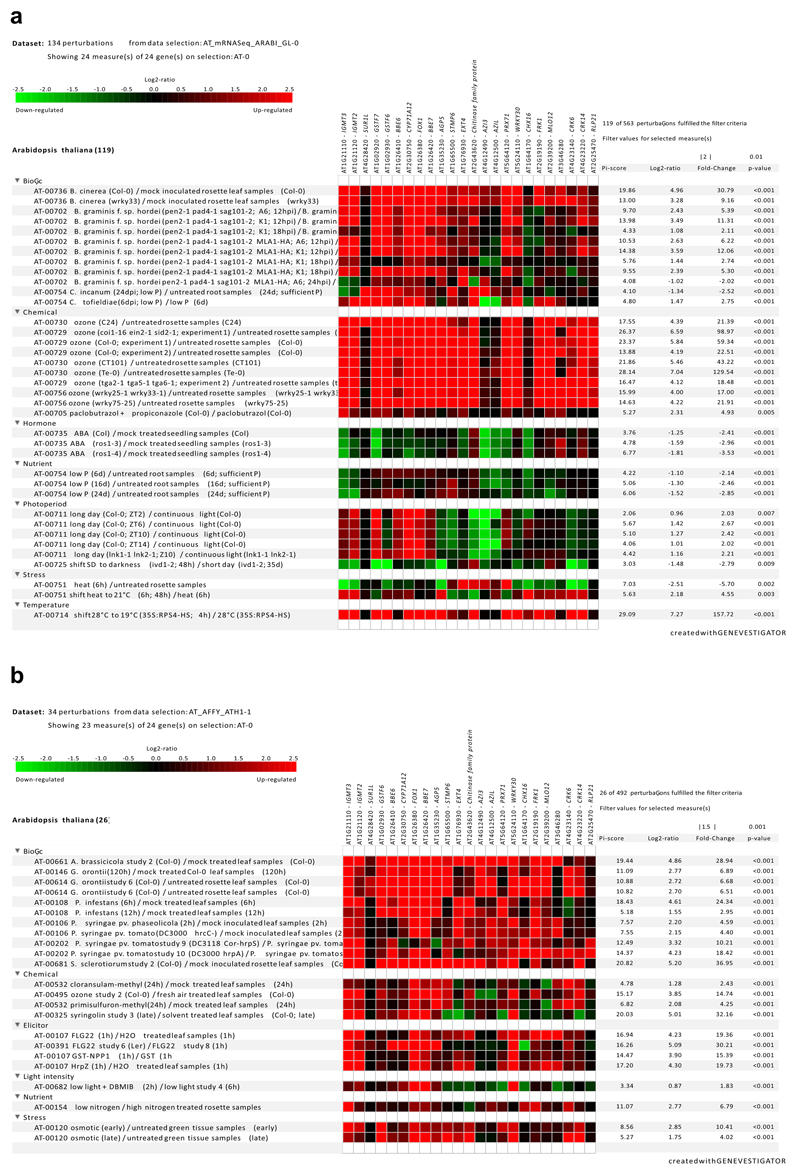
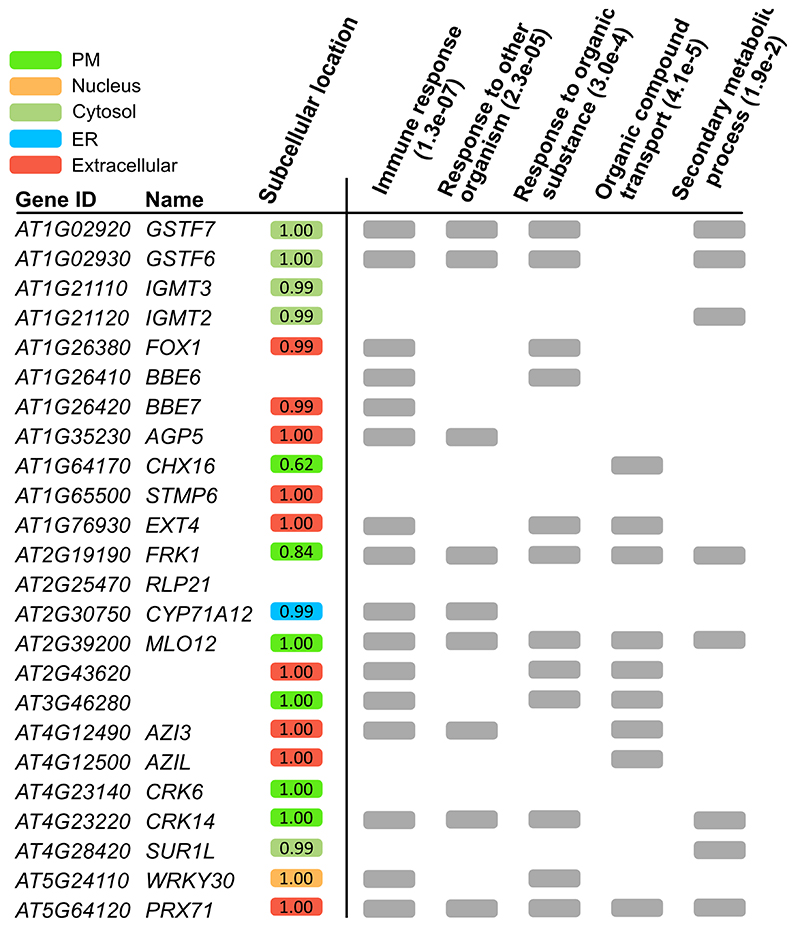
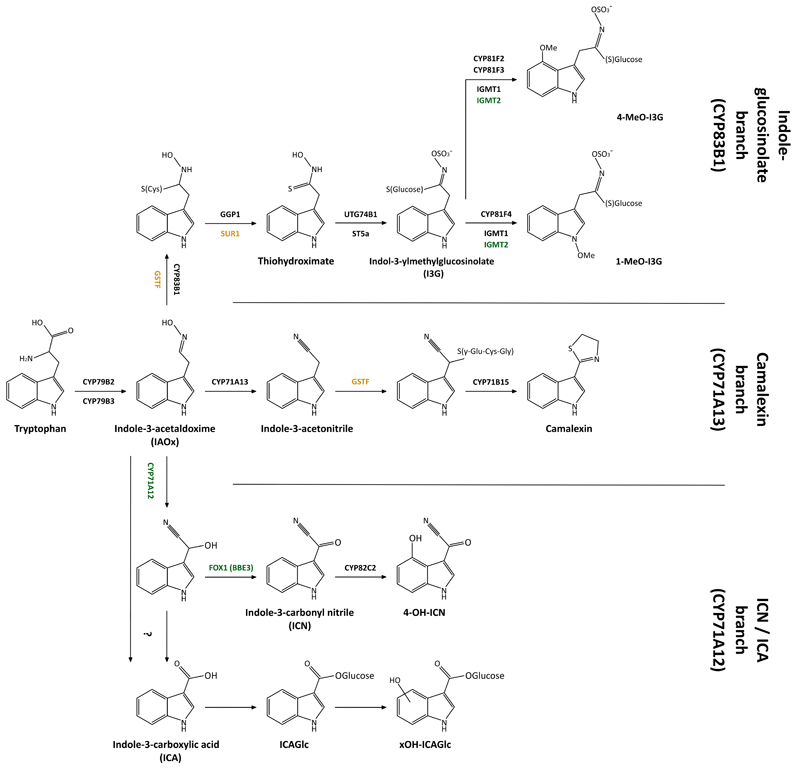
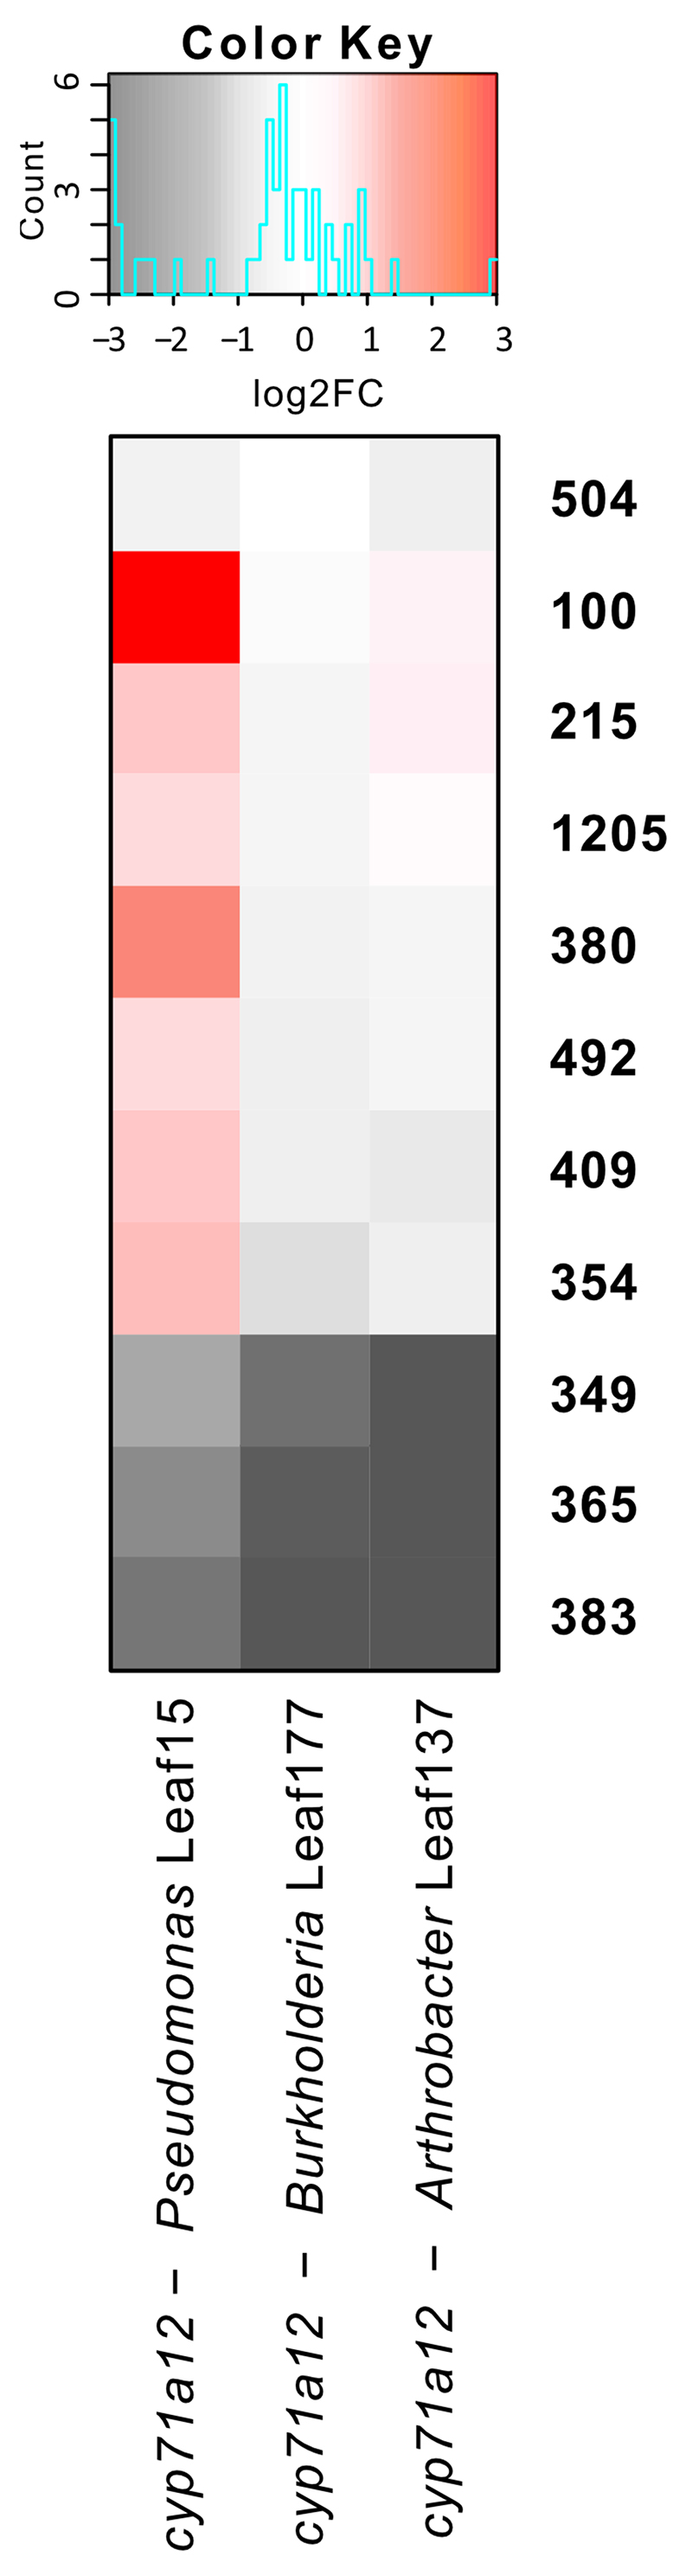
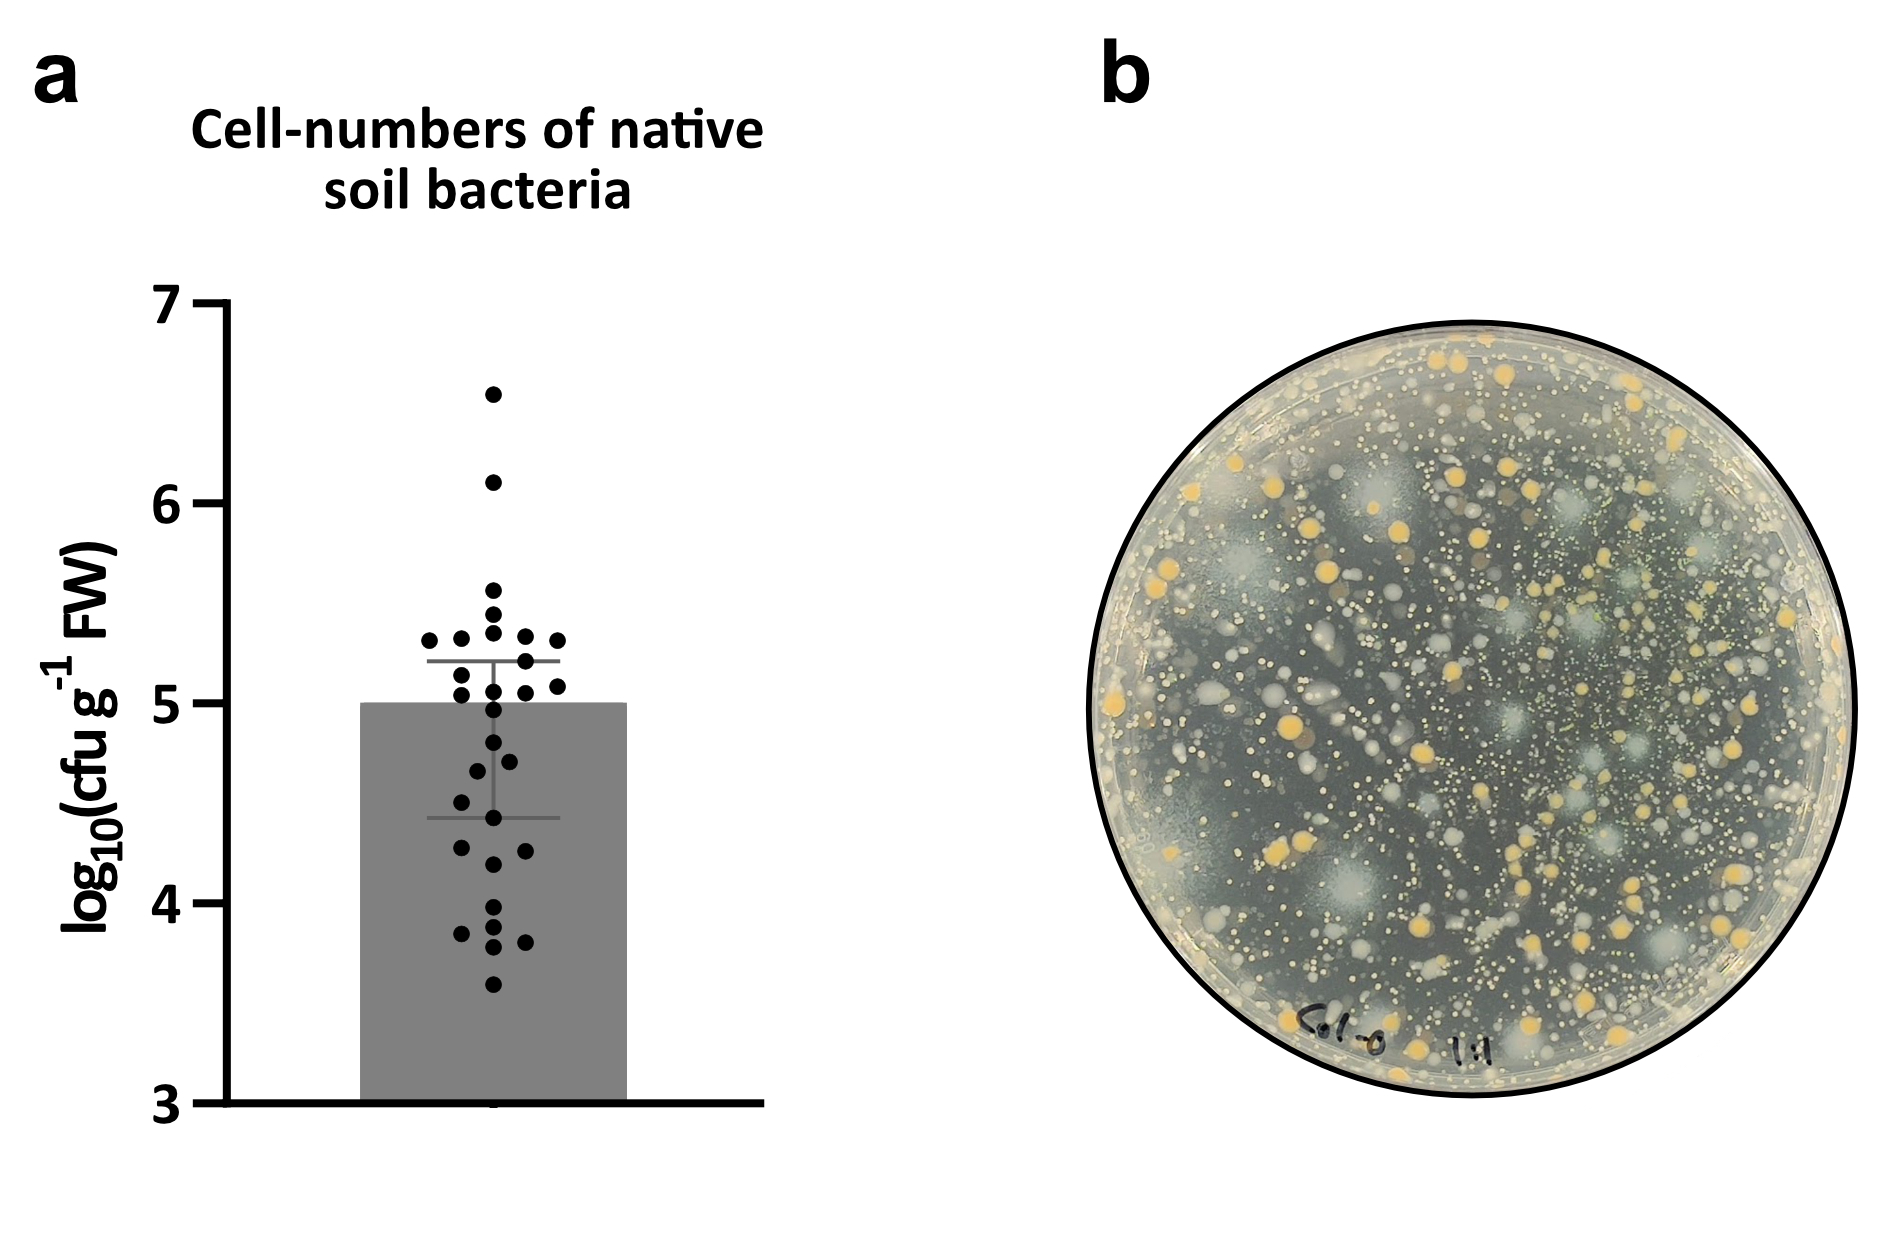
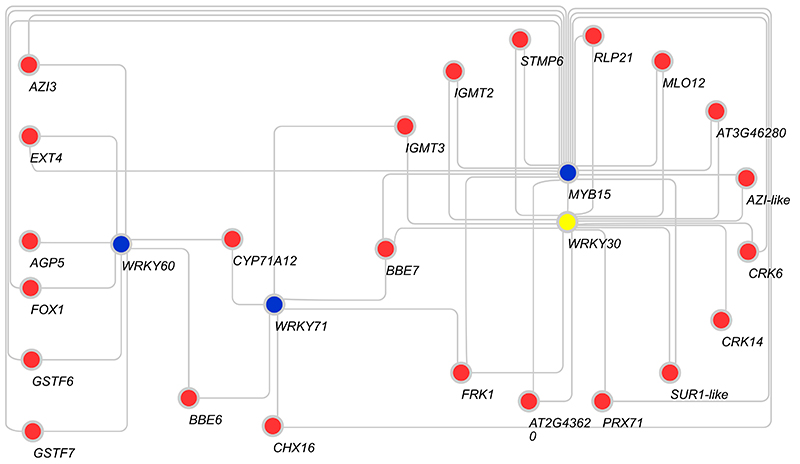
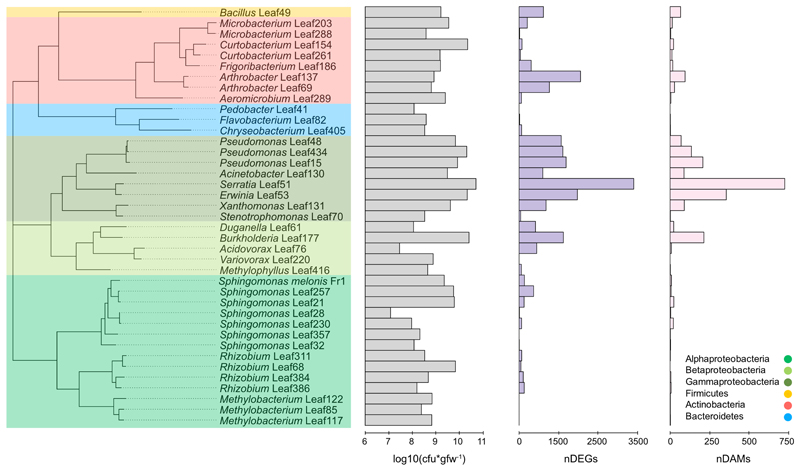
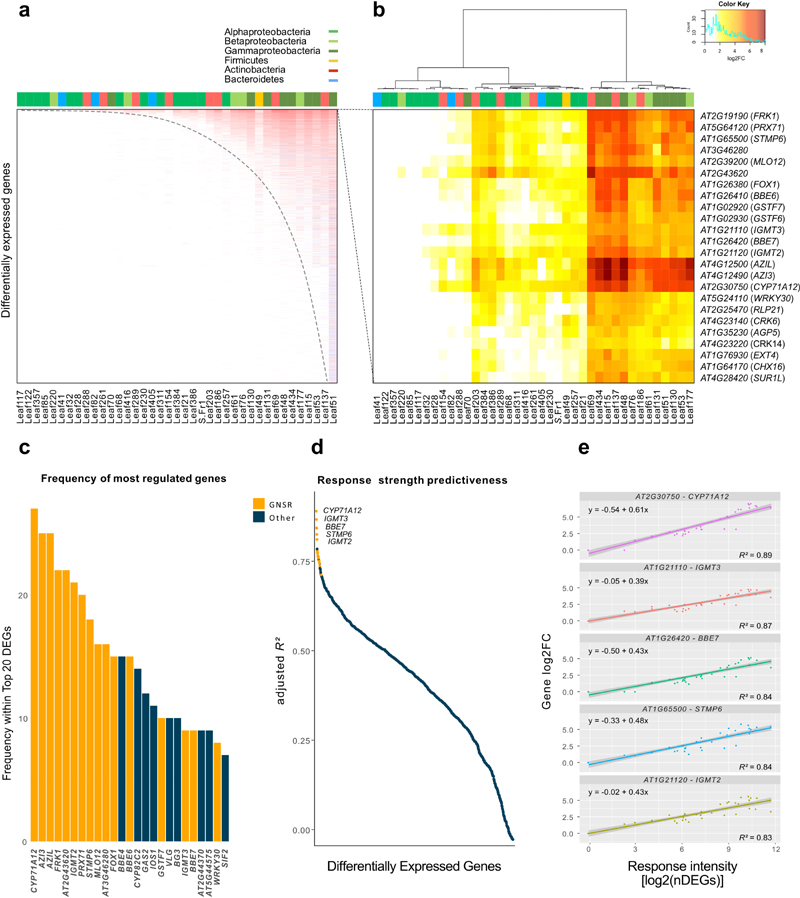
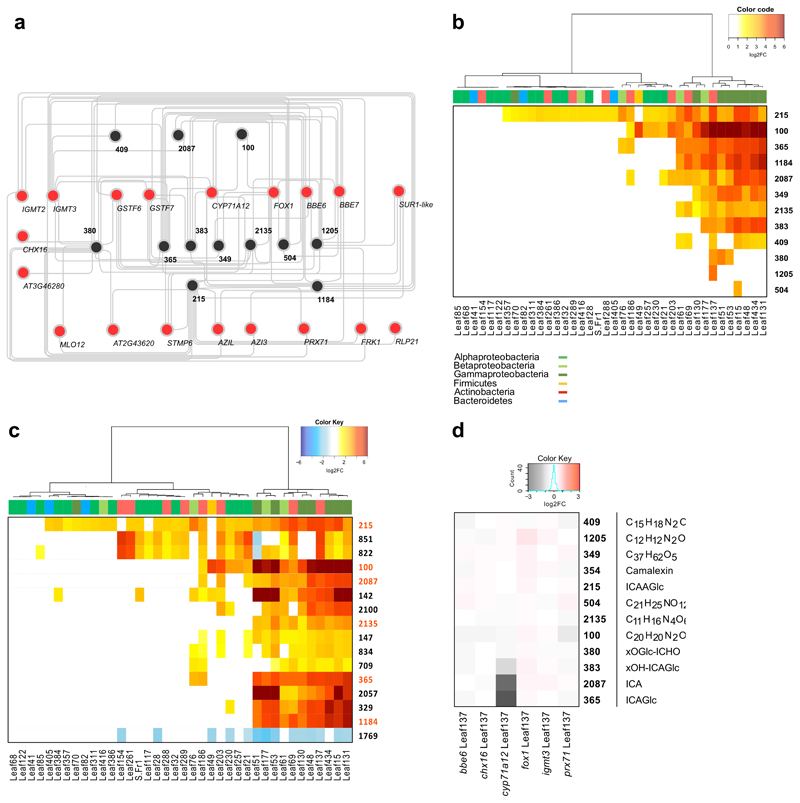
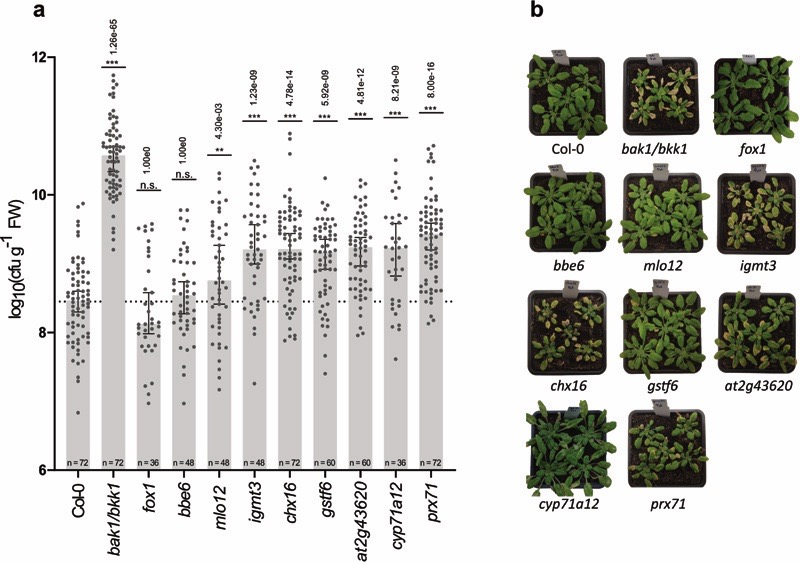
Plants, like other multicellular lifeforms, are colonized by microorganisms. How plants respond to their microbiota is currently not well understood. We used a phylogenetically diverse set of 39 endogenous bacterial strains from Arabidopsis thaliana leaves to assess host transcriptional and metabolic adaptations to bacterial encounters. We identified a molecular response, which we termed the general non-self response (GNSR) that involves the expression of a core set of 24 genes. The GNSR genes are not only consistently induced by the presence of most strains, they also comprise the most differentially regulated genes across treatments and are predictive of a hierarchical transcriptional reprogramming beyond the GNSR. Using a complementary untargeted metabolomics approach we link the GNSR to the tryptophan-derived secondary metabolism, highlighting the importance of small molecules in plant-microbe interactions. We demonstrate that several of the GNSR genes are required for resistance against the bacterial pathogen Pseudomonas syringae. Our results suggest that the GNSR constitutes a defence adaptation strategy that is consistently elicited by diverse strains from various phyla, contributes to host protection and involves secondary metabolism.


Conflict of interest statement

The authors declare no competing interests.

Figures

Extended Data Figure 1
Extended Data Figure 1. Phenotype of Arabidopsis inoculated with the 39 bacterial strains.
Representative phenotypes of 3-week-old Arabidopsis wild type plants (Col-0), 9 days after inoculation with individual bacterial strains.
Extended Data Figure 2
Extended Data Figure 2. Cluster analysis of DEGs and DAMs of Arabidopsis in response to bacterial treatments.
a-b, Heat-maps of total DEGs (|log2FC| > 1. FDR < 0.01) (a) and DAMs (|log2FC| > 1, FDR < 0.05) (b). Strains and DEGs/DAMs are clustered using Ward’s method. Top color bars indicate phylogeny. c-d, Principle component analysis (PCA) plot depicting distances based on gene expression counts (for DEGs) or metabolite areas under the curve (for DAMs). Colors represent bacterial phyla/classes. Selected treatments are annotated with strain name and replicate number. Data from five independent biological replicates (R1-R5), each representing 18-24 plants.
Extended Data Figure 3
Extended Data Figure 3. Correlation between phyllosphere colonization and host response intensity.
a-c, Linear regression of cfu*gfw−1 against nDEGs or nDAMs and nDEGs against nDAMs in the respective conditions. Axis scaled to log10 for improved readability. Dots are annotated by the strain used in the treatment. Colors represent bacterial phyla/class analogous to Fig. S2. Coefficients of variation from the linear regression (R2) value and Spearman’s ranked correlation values (ρ) are provided. Data from five independent biological replicates, each representing 18-24 plants.
Extended Data Figure 4
Extended Data Figure 4. Hierarchy heat-map of DAMs.
Sorted heat-maps of total DAMs (log2FC < 1, FDR < 0.05). Conditions were sorted by strains causing the weakest to strongest host-response based on the number of DAMs (x-axis, left to right) and amount of times a metabolite feature was differentially regulated from most frequent to least frequent (y-axis, top to bottom). Top color bars indicate bacterial phyla/classes analogous to Extended Data Fig. 2. Data from five independent biological replicates, each representing 18-24 plants.
Extended Data Figure 5
Extended Data Figure 5. Genevestigator analysis of GNSR genes.
Selected query results for GNSR genes in Genevestigator category “Perturbations’. Names adjusted to match names used in this study a, Results for mRNA seq datasets from various experiments (|FC| > 2, p-value < 0.01)) for biotic, chemical, hormonal, nutritional, photoperiod, temperature or other abiotic perturbations. b, Results for microarray datasets from various experiments (|FC| > 1.5, p-value < 0.001) for biotic, chemical, elicitor, light intensity, nutritional and other abiotic stress perturbations. All p-values were computed by two-sided t-test implemented in limma (for micro-array data) and by Voom’s algorithm (two-sided) for RNAseq data and are adjusted by Benjamini-Hochberg in order to compute the threshold under which the p-values are considered sufficiently small (https://genevestigator.com/userdocs/manual/GENEVESTIGATOR_UserManual.pdf).
Extended Data Figure 6
Extended Data Figure 6. Functional enrichment and subcellular location analysis.
Analysis of subcellular locations using SUBA4 prediction scores (left, colored) and summarized associated GO analysis of GNSR genes based on AgriGO2 functional enrichment (right, grey).
Extended Data Figure 7
Extended Data Figure 7. Tryptophan-derived secondary metabolism in Arabidopsis.
Simplified version of the TDSM with the three main branches, important intermediates and enzymes. GNSR genes are highlighted in green, genes homologous to GNSR genes are highlighted in yellow.
Extended Data Figure 8
Extended Data Figure 8. Targeted metabolomics on the cyp71a12 mutant.
Heat-map of log2-transformed metabolite fold-changes in the cyp71a12 mutant against the respective wild-type conditions. Only changes in 349, 365 and 383 are significant (two-sided t-test, Benjamini-Hochberg adjusted p-value < 0.05). Data from ten technical replicates, each representing 1 plant.
Extended Data Figure 9
Extended Data Figure 9. Phyllosphere colonization by bacteria native to the potting soil used in this experiment.
a, Median cfu*gfw−1 with 95% confidence interval of 30 different plants (n = 30) in one experiment. b, Representative picture of bacterial colonies extracted from leaves, grown on R2-A agar with 0.5% (v/v) methanol and supplemented with cycloheximide to prevent fungal growth.
Extended Data Figure 10
Extended Data Figure 10. Gene expression correlation of GNSR and transcription factor encoding genes.
Network graph showing significant, positive correlations (Spearman correlation, ρ ≥ 0.85, best two correlations) between GNSR genes and transcription factors of the defense associated MYB and WRKY families. GNSR genes are displayed in red, transcription factor genes in blue. WRKY30 in yellow as it is both a GNSR and a transcription factor gene.
Figure 1
Figure 1. Magnitude of the Arabidopsis response to bacterial colonization at the transcriptional and metabolic levels.
Phylogenetic tree of bacterial strains colored according to phyla and class (see legend). First bar-chart (grey) displays the average cell number reached in the phyllosphere in cfu*gfw-1 nine days after inoculation. The second (purple) and third (rose) bar-charts display the response strength in nDEGs and nDAM in the respective condition. Data from five independent biological replicates, each representing 18-24 plants.
Figure 2
Figure 2. General non-self response genes.
a, Heatmap of log2-transformed fold-changes sorted by frequency of differential expression (y-axis) and treatments with most differentially expressed genes (x-axis). Top color bar indicates bacterial phyla/class. Dotted line illustrates the hierarchical nature of the responses. Data represents results from five independent biological replicates (n=5) b, Heat-map of the log2-transformed fold-changes of the most consistently differentially regulated genes across all treatments (differentially expressed in > 70 % of treatments). GNSR genes with strains (x-axis) and individual genes (y-axis). Strains clustered by Ward’s method. The top color bar indicates the bacterial phyla/classes. Data represents results from five independent biological replicates (n=5). c, Frequency of the 25 genes most consistently detected among the 20 most differentially regulated genes across all conditions (based on log2FC). Color code indicates GNSR affiliation. d, Results of linear regressions (adjusted R2 value) of individual log2-transformed gene fold changes against log2-transformed nDEGs. Color code indicates GNSR affiliation e, Exemplary results of linear regressions with regression line, formula and 95% confidence intervals (grey bands) for the five most highly predictive GNSR genes for overall number of DEGs across all treatments.
Figure 3
Figure 3. Correlation-analysis of GNSR and metabolome.
a, Correlation network of GNSR genes (red) with metabolites (black). Edges signify the top 2 positive correlations (Spearman’s ranked correlation, ρ > 0.85, p-value < 0.01, p-value adjustment: Benjamini-Hochberg) between the log2-transformed normalized count data against the log2-transformed normalized peak area for each independent biological replicate (n = 5). b-c, Heat-map showing significant changes (log2FC > 1, FDR < 0.05) of compounds (as crids) against wild-type (Col-0) control plants within the dataset (n = 5 independent biological replicates). Strains clustered by Ward’s method. Strain phylogeny is depicted by top color bar. (b) depicts GNSR associated compounds, (c) shows the most abundant compounds in the entire data set, with GNSR associated compounds marked orange (y-axis) d, Heat-map of log2-transformed fold changes of metabolite abundances in GNSR gene mutants inoculated with Arthrobacter Leaf137 against equally treated wild-type plants. (n = 10 technical replicates of 3 plants). For each crid, either the compound name or the predicted molecular formula is provided.
Figure 4
Figure 4. Disease susceptibility phenotypes of GNSR mutants.
a, Cell numbers (cfu*gfw−1) of Pst on GNSR gene mutant plant lines. Data combined from at least three independent experiments. Number of data points is indicated in each bar (each experiment: n = 12). Bars depict median with 95 % confidence interval. Significance against the infected wild-type control (Col-0) is indicated above the bars by asterisks. Displayed p-values derive from the summary statistic of R’s linear model (Pearson’s correlation, batch adjusted) of mutant genotypes against the respective control (see Methods) and were adjusted by Bonferroni correction of p-values (*: adj. p-value < 0.01, **: adj. p-value < 0.01, ***: p-value < 0.001.) b, Representative plant phenotypes 7 days after infection with Pst.

Comment in

  • Different threats, same response.
    Cole BJ, Tringe SG. Cole BJ, et al. Nat Plants. 2021 May;7(5):544-545. doi: 10.1038/s41477-021-00915-z. Nat Plants. 2021. PMID: 34007034 No abstract available.

Similar articles

Cited by

References

    1. Vorholt JA. Microbial life in the phyllosphere. Nat Rev Microbiol. 2012;10:828–840. - PubMed
    1. Lindow SE, Brandl MT. Microbiology of the phyllosphere. Appl Environ Microbiol. 2003;69:1875–1883. - PMC - PubMed
    1. Müller DB, Vogel C, Bai Y, Vorholt JA. The plant microbiota: systems-level insights and perspectives. Annu Rev Genet. 2016;50:211–234. - PubMed
    1. Hacquard S, Spaepen S, Garrido-Oter R, Schulze-Lefert P. Interplay between innate immunity and the plant microbiota. Annu Rev Phytopathol. 2017;55:565–589. - PubMed
    1. Ditt RF, et al. The Arabidopsis thaliana transcriptome in response to Agrobacterium tumefaciens . Mol Plant Microbe Interact. 2006;19:665–681. - PubMed