. 2021 Sep;46(10):1746-1756.
doi: 10.1038/s41386-021-01027-0. Epub 2021 May 18.

Sex-specific nicotine sensitization and imprinting of self-administration in rats inform GWAS findings on human addiction phenotypes

Affiliations

Sex-specific nicotine sensitization and imprinting of self-administration in rats inform GWAS findings on human addiction phenotypes

Alena Kozlova et al. Neuropsychopharmacology. 2021 Sep.

Abstract

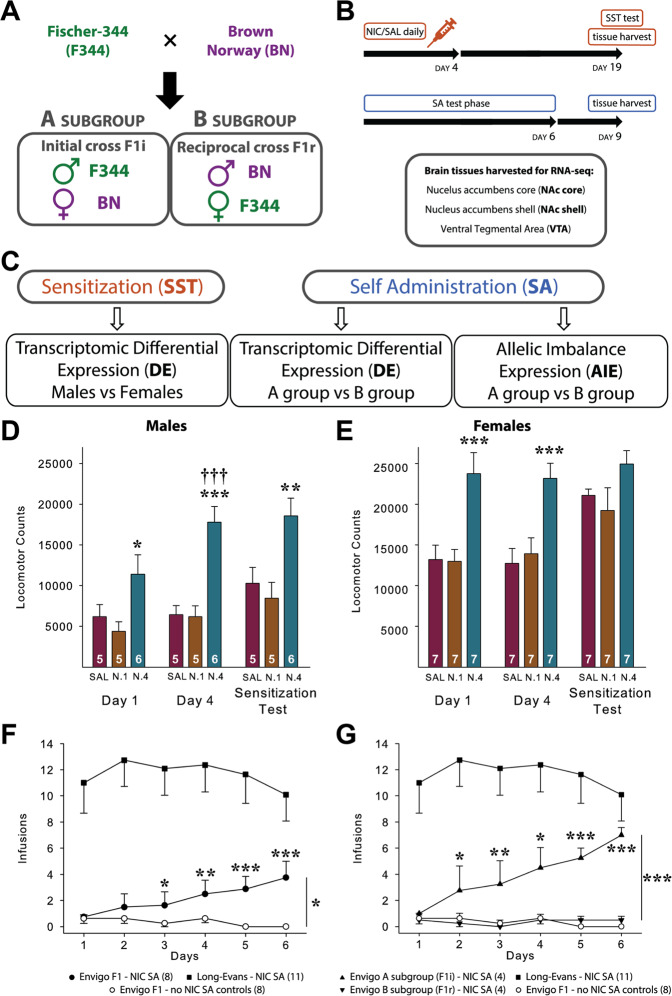
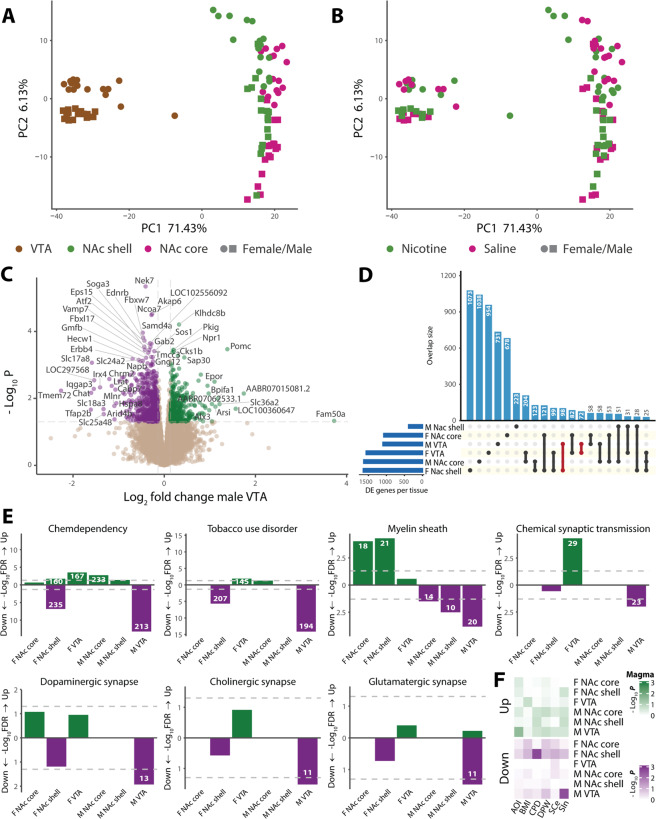
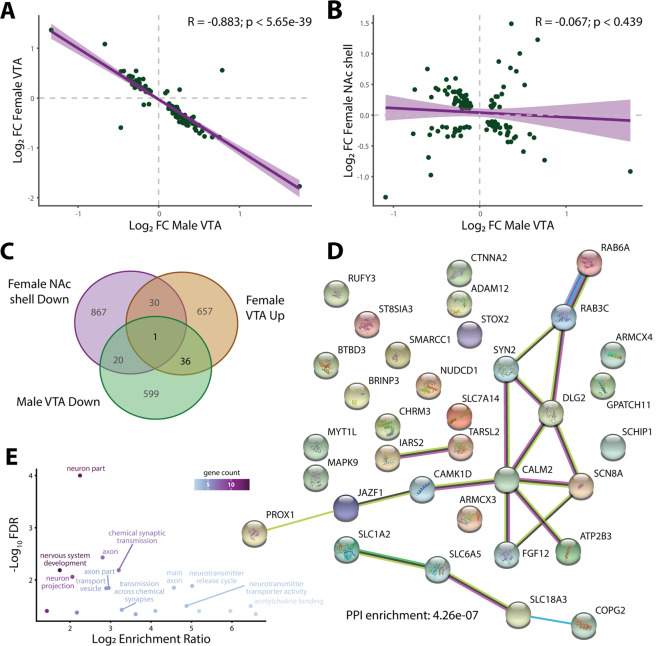
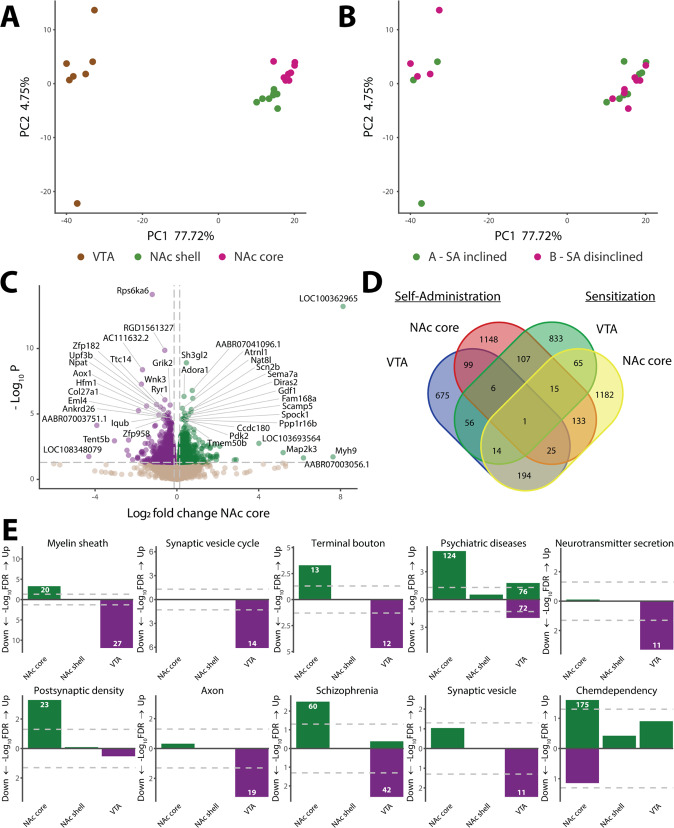
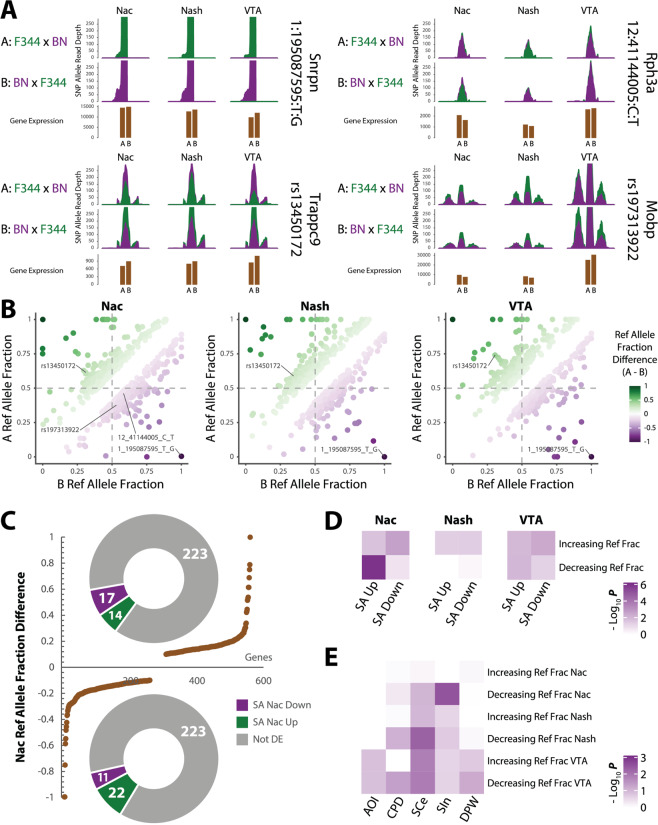
Repeated nicotine exposure leads to sensitization (SST) and enhances self-administration (SA) in rodents. However, the molecular basis of nicotine SST and SA and their biological relevance to the mounting genome-wide association study (GWAS) loci of human addictive behaviors are poorly understood. Considering a gateway drug role of nicotine, we modeled nicotine SST and SA in F1 progeny of inbred rats (F344/BN) and conducted integrative genomics analyses. We unexpectedly observed male-specific nicotine SST and a parental effect of SA only present in paternal F344 crosses. Transcriptional profiling in the ventral tegmental area (VTA) and nucleus accumbens (NAc) core and shell further revealed sex- and brain region-specific transcriptomic signatures of SST and SA. We found that genes associated with SST and SA were enriched for those related to synaptic processes, myelin sheath, and tobacco use disorder or chemdependency. Interestingly, SST-associated genes were often downregulated in male VTA but upregulated in female VTA, and strongly enriched for smoking GWAS risk variants, possibly explaining the male-specific SST. For SA, we found widespread region-specific allelic imbalance of expression (AIE), of which genes showing AIE bias toward paternal F344 alleles in NAc core were strongly enriched for SA-associated genes and for GWAS risk variants of smoking initiation, likely contributing to the parental effect of SA. Our study suggests a mechanistic link between transcriptional changes underlying the NIC SST and SA and human nicotine addiction, providing a resource for understanding the neurobiology basis of the GWAS findings on human smoking and other addictive phenotypes.


Figures

Fig. 1
Fig. 1. A schematic experimental design of NIC sensitization (SST) and self-administration (SA) and the behavioral tests.
A Genetically identical and heterozygous F1 progeny of two inbred strains (F344 and BN) from both initial (F1i) and reciprocal (F1r) crosses were used. B The paradigm of NIC treatment for SST and SA tests. For SST transcriptomic analysis, brain tissues from the NAc core, shell, and VTA were harvested without testing SST at day 19 to avoid assaying the acute effect of NIC. C Genomics analyses for NIC SST and SA. D, E F1 males (n = 5–6/group) and F1 females (n = 7/group) were administered NIC (0.1 [N.1] or 0.4 [N.4] mg/kg; base, IP) or SAL daily for 4 days and tested for SST 2 weeks later. Data are mean (+SEM) of 2-h total locomotor counts obtained on days 1 and 4, and on the test for SST when all rats were administered NIC (0.4 mg/kg). D Males showed a dose-dependent increase in NIC-induced locomotion and NIC SST. ANOVA of the day 1 and day 4 results in the males revealed significant effects of the group [F2,13 = 10.43 (p < 0.01)], days [F1,13 = 15.55 (p < 0.01)], and a significant group × days interaction [F2,13 = 7.11 (p < 0.01)]. ANOVA of the test for sensitization results in these rats showed a significant group effect [F2,13 = 7.25 (p < 0.01)]. The denoted p-values were from post hoc Scheffé comparisons: *p < 0.05, **p < 0.01, ***p < 0.001, N.4 vs two other groups at indicated days. †††p < 0.001, day 4 vs day 1 in N.4. E Females showed a dose-dependent increase in NIC-induced locomotion but did not exhibit NIC SST. ANOVA yielded only a significant effect of groups [F2,18 = 17.74 (p < 0.001)] for the exposure day 1 and 4 results in females. The denoted p values were from post hoc Scheffé comparisons: ***p < 0.001, N.4 vs two other groups at indicated days. F F1s with access to NIC as a group self-administered the drug significantly more than the non-NIC controls but much less than outbred Long-Evans rats. ANOVA of the results obtained in the two Envigo groups with and without access to NIC revealed a significant effect of groups [F1,14 = 9.35 (p < 0.05)] and a significant group × days interaction [F5,70 = 4.17 (p < 0.01)], with post Scheffé comparisons showing a progressively increasing and significantly higher intake in the rats with access to NIC starting on day 3 of SA (p < 0.05 − 0.001). G When the F1s with access to NIC were divided by type of reciprocal cross [F344 father/BN mother F1s (subgroup A) and F344 mother/ BN father F1s (subgroup B)] and the results reanalyzed, subgroup A F1 rats showed more inclined NIC SA that approached levels seen in the Long-Evans outbred rats by day 6. The ANOVA revealed significant effects of groups [F2,13 = 20.35 (p < 0.001)], days [F5,65 = 5.16 (p < 0.001)], and a significant groups × days interaction [F10,65 = 6.51 (p < 0.001)], with post hoc Scheffé comparisons showing a progressively increasing and significantly higher intake only in subgroup A relative to the other two groups starting on day 3: *p < 0.05, **p < 0.01, ***p < 0.001. Data in (F, G) are the group mean (±SEM) number of infusions rats self-administered. Data for the Long-Evans outbred rats are from [13].
Fig. 2
Fig. 2. Transcriptomic analysis of NIC sensitization (SST).
A, B Principal component analysis (PCA) of the top 500 differentially expressed (DE) genes in response to SST colored by (A) brain region, and by (B) NIC treatment; NAc nucleus accumbens, VTA ventral tegmental area. C Volcano plot of DE genes in the male VTA. D Upset plot of genes that are DE in different brain regions, with a nominal p < 0.05. Overlaps with n ≥ 25 are shown in vertical bars, while absolute DE gene counts for each tissue are represented in horizontal bars in the lower left. E DAVID gene set enrichment analysis of DE genes in each brain region, examining GAD diseases and disease classes, Online Mendelian Inheritance in Man (OMIM) diseases, KEGG pathways and GO terms. FDR-significant gene sets include the number of class genes (inset in the bar). F MAGMA enrichment analysis of genes harboring GWAS risk variants of five addiction phenotypes among DE genes in each brain region. Gene interval—100 kb window around the gene. AOI age of initiation, BMI body mass index, CPD cigarettes per day, DPW drinks per week, SCe smoking cessation, SIn smoking initiation; Up upregulated genes, Down downregulated genes, M male, F female.
Fig. 3
Fig. 3. Comparison of sensitization (SST)-associated differential expression (DE) between males and females.
A Fold change comparison of genes with nominally significant (p < 0.05) DE in both ventral tegmental areas (VTAs) between males and females. B Fold change comparison of genes with nominally significant (p < 0.05) DE in the male VTA and female NAc shell. C Venn diagram of nominally significant (p < 0.05) DE genes in directions/regions enriched for addiction phenotypes. Note: male VTA downregulated, female VTA upregulated, and female NAc shell downregulated genes are most relevant to NIC addiction based on DAVID and MAGMA enrichment analyses (Fig. 3, Figs. S2, S5). D STRING analysis of human orthologs of 37 genes with opposite direction of DE (p < 0.05) in male (down) and female (up) VTAs. Number of nodes: 34, number of edges: 18, average node degree: 1.06, avg. local clustering coefficient: 0.305, expected number of edges: 4, PPI enrichment p < 4.3 × 10-7. E Ontological enrichments from the STRING analysis, colored by gene count in each term.
Fig. 4
Fig. 4. Transcriptomic analysis of NIC self-administration (SA).
To mitigate the possible confounding effect of NIC exposure, all rats received ten infusions of NIC per session by providing a sufficient number of passively administered priming infusions (see “Materials and methods”), and brain tissues were harvested 3 days following the last SA session. A, B PCA analysis of the top 500 differentially expressed (DE) genes in response to SA colored by (A) brain region and by (B) F1 cross subgroup (which experimentally was also the SA inclined/disinclined distinction); NAc nucleus accumbens, VTA ventral tegmental area. C Volcano plot of 15,443 DE genes in the male NAc core. D Venn diagram of the DE (p < 0.05) genes in different brain regions. NAc core and VTA of SA experiments are compared to NAc core and VTA of SST experiments. E DAVID gene set enrichment analysis of DE genes in each brain region, examining GAD diseases and disease classes, OMIM diseases, KEGG pathways, and GO terms. FDR-significant gene sets include the number of genes (inset in the bar). Shown on the y-axis are enrichment significance (−Log10 FDR), Up upregulated genes, Down downregulated genes.
Fig. 5
Fig. 5. Allelic imbalance of expression (AIE) analysis of parental effect on self-administration (SA).
A RNA-seq read pileup plots of example loci (transcribed SNPs) showing AIE in each brain region with a 500 bp window centered on the SNP. The sequencing reads of the Fischer-344 (F344) allele are in green and those from the Brown Norway (BN) allele are in purple. Upper row depicts read depth of AIE of A subgroup (SA inclined), middle row depicts read depth of AIE of B subgroup (SA disinclined), and lower row depicts the mean normalized gene expression (DESeq normalized mean RNA-seq read count) in A and B subgroups (shown in brown) for the SNP. B In each brain region (NAc core, shell and VTA; from left to right), correlation of the reference allele (BN copy) fraction of all AIE SNPs (binomial test, FDR < 0.05; ref allele fraction difference>0.1) between the subgroup A and B rats. C Distribution of the reference allele (BN copy) fraction differences (A subgroup–B subgroup) of AIE genes in the NAc core (brown line). Donut plots show the number of genes in each DE category (upregulated—green; downregulated—purple; no change—gray) associated with AIE SNPs that showed either increased (above, >0.1) or decreased (below,<-0.1) reference allele fraction in subgroup A vs. B. D Heatmap showing the Fisher’s exact test enrichment of up- or downregulated genes in NIC SA among genes showing differential AIE (increasing or decreasing reference allele fraction; 2-sample proportion test, FDR < 0.05) in subgroup A vs. B in each brain region. E Heatmap showing the Fisher’s exact test enrichment of genes harboring risk variants (r2 > 0.3 with GWAS index SNPs) of NIC addiction phenotypes among AIE genes with significantly increasing or decreasing reference allele fraction (2-sample proportion test, FDR < 0.05) in subgroup A vs. B in each brain region.

Similar articles

Cited by

References

    1. Caille S, Clemens K, Stinus L, Cador M. Modeling nicotine addiction in rats. Methods Mol Biol. 2012;829:243–56. doi: 10.1007/978-1-61779-458-2_15. - DOI - PubMed
    1. Vezina P, McGehee DS, Green WN. Exposure to nicotine and sensitization of nicotine-induced behaviors. Prog Neuro-Psychopharmacol Biol Psychiatry. 2007;31:1625–38. doi: 10.1016/j.pnpbp.2007.08.038. - DOI - PMC - PubMed
    1. Levine A, Huang Y, Drisaldi B, Griffin EA, Jr, Pollak DD, Xu S, et al. Molecular mechanism for a gateway drug: epigenetic changes initiated by nicotine prime gene expression by cocaine. Sci Transl Med. 2011;3:107ra09. doi: 10.1126/scitranslmed.3003062. - DOI - PMC - PubMed
    1. Wain LV, Shrine N, Miller S, Jackson VE, Ntalla I, Soler Artigas M, et al. Novel insights into the genetics of smoking behaviour, lung function, and chronic obstructive pulmonary disease (UK BiLEVE): a genetic association study in UK Biobank. Lancet Respir Med. 2015;3:769–81. doi: 10.1016/S2213-2600(15)00283-0. - DOI - PMC - PubMed
    1. Tobacco, Genetics C. Genome-wide meta-analyses identify multiple loci associated with smoking behavior. Nat Genet. 2010;42:441–7. doi: 10.1038/ng.571. - DOI - PMC - PubMed

Publication types