

Effect of oxymatrine on liver gluconeogenesis is associated with the regulation of PEPCK and G6Pase expression and AKT phosphorylation
- PMID: 34007449
- PMCID: PMC8120346
- DOI: 10.3892/br.2021.1432
Effect of oxymatrine on liver gluconeogenesis is associated with the regulation of PEPCK and G6Pase expression and AKT phosphorylation
Abstract
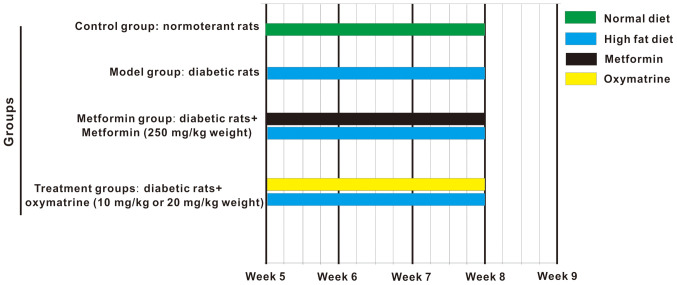
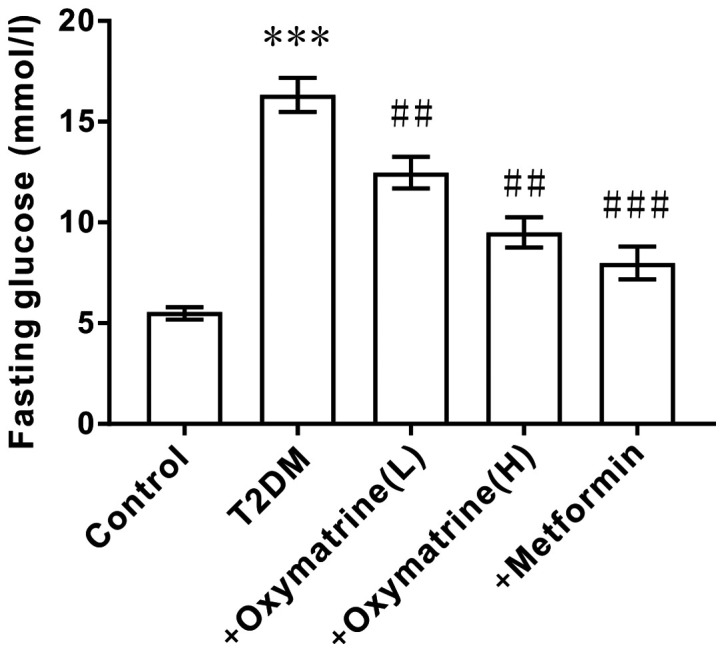
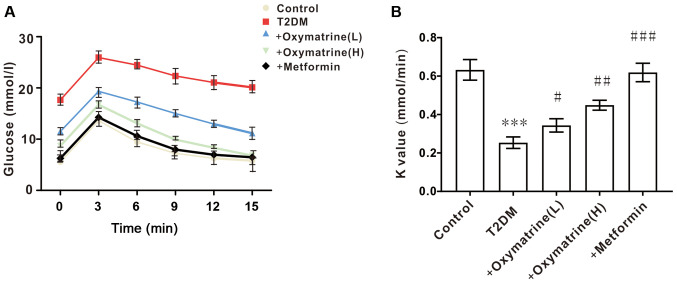
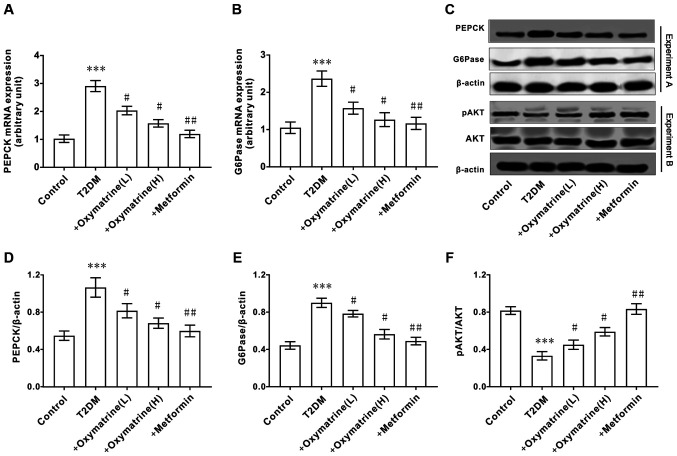
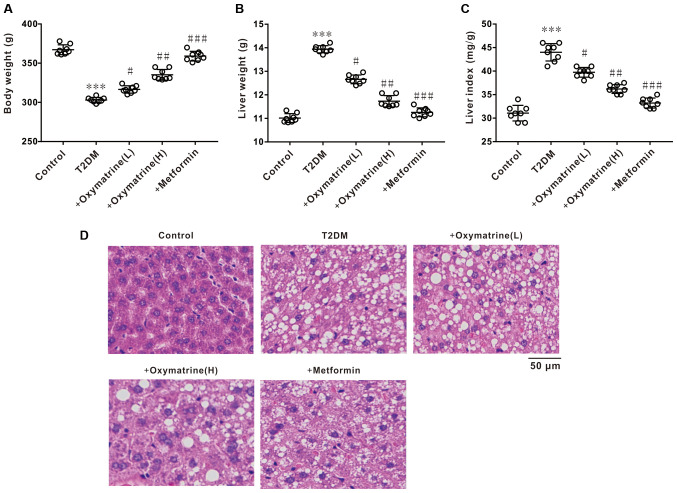
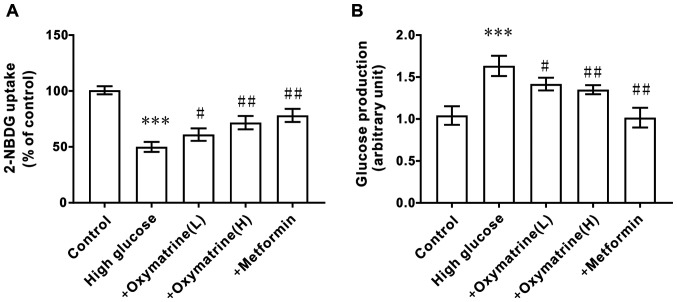
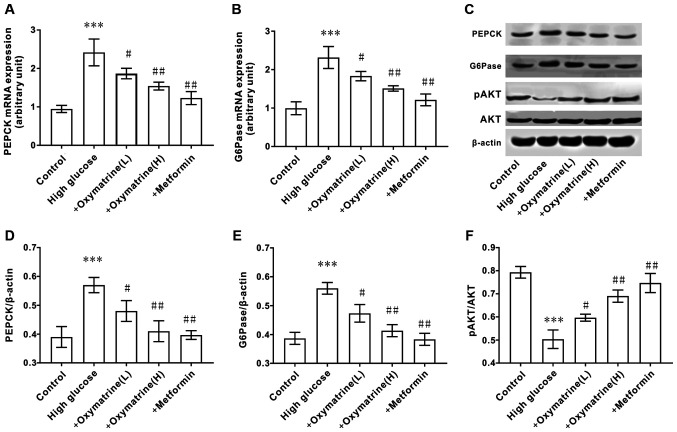
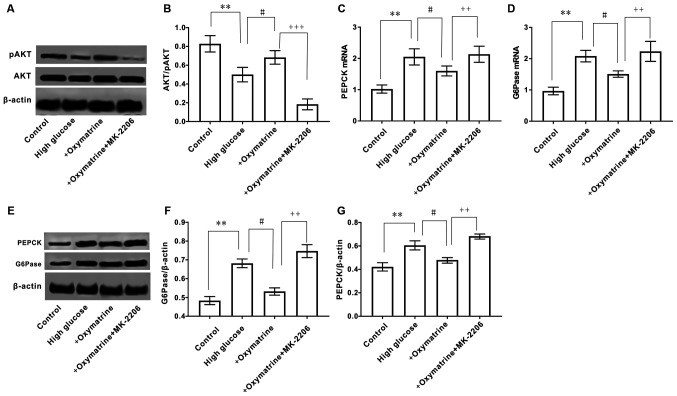
An increase in liver gluconeogenesis is an important pathological phenomenon in type 2 diabetes mellitus (T2DM) and oxymatrine is an effective natural drug used for T2DM treatment. The present study aimed to explore the effect of oxymatrine on gluconeogenesis and elucidate the underlying mechanism. Male Sprague-Dawley rats were treated with a high-fat diet and streptozotocin for 4 weeks to induce T2DM, and HepG2 cells were treated with 55 mM glucose to simulate T2DM in vitro. T2DM rats were treated with oxymatrine (10 or 20 mg/kg weight) or metformin for 4 weeks, and HepG2 cells were treated with oxymatrine (0.1 or 1 µM), metformin (0.1 µM), or oxymatrine combined with MK-2206 (AKT inhibitor) for 24 h. Fasting blood glucose and insulin sensitivity of rats were measured to evaluate insulin resistance. Glucose production and uptake ability were measured to evaluate gluconeogenesis in HepG2 cells, and the expression of related genes was detected to explore the molecular mechanism. Additionally, the body weight, liver weight and liver index were measured and hematoxylin and eosin staining was performed to evaluate the effects of the disease. The fasting glucose levels of T2DM rats was 16.5 mmol/l, whereas in the control rats, it was 6.1 mmol/l. Decreased insulin sensitivity (K-value, 0.2), body weight loss (weight, 300 g), liver weight gain, liver index increase (value, 48) and morphological changes were observed in T2DM rats, accompanied by reduced AKT phosphorylation, and upregulated expression of phosphoenolpyruvate carboxykinase (PEPCK) and glucose-6-phosphatase (G6Pase). High-glucose treatment significantly increased glucose production and decreased glucose uptake in HepG2 cells, concomitant with a decrease in AKT phosphorylation and increase of PEPCK and G6Pase expression. In vivo, oxymatrine dose-dependently increased the sensitivity of T2DM rats to insulin, increased AKT phosphorylation and decreased PEPCK and G6Pase expression in the liver, and reversed the liver morphological changes. In vitro, oxymatrine dose-dependently increased AKT phosphorylation and glucose uptake of HepG2 cells subjected to high-glucose treatment, which was accompanied by inhibition of the expression of the gluconeogenesis-related genes, PEPCK and G6Pase. MK-2206 significantly inhibited the protective effects of oxymatrine in high-glucose-treated cells. These data indicated that oxymatrine can effectively prevent insulin resistance and gluconeogenesis, and its mechanism may be at least partly associated with the regulation of PEPCK and G6Pase expression and AKT phosphorylation in the liver.
Keywords: AKT; gluconeogenesis; glucose-6-phosphatase; oxymatrine; phosphoenolpyruvate carboxykinase; type 2 diabetes mellitus.
Copyright: © Zhu et al.
Conflict of interest statement
The authors declare that they have no competing interests.
Figures
Similar articles
-
Irisin inhibits hepatic gluconeogenesis and increases glycogen synthesis via the PI3K/Akt pathway in type 2 diabetic mice and hepatocytes.Clin Sci (Lond). 2015 Nov;129(10):839-50. doi: 10.1042/CS20150009. Epub 2015 Jul 13. Clin Sci (Lond). 2015. PMID: 26201094
-
Roux-en-Y Gastric Bypass Improves Metabolic Conditions in Association with Increased Serum Bile Acids Level and Hepatic Farnesoid X Receptor Expression in a T2DM Rat Model.Obes Surg. 2019 Sep;29(9):2912-2922. doi: 10.1007/s11695-019-03918-0. Obes Surg. 2019. PMID: 31079286
-
Roux-en-Y Gastric Bypass Surgery Suppresses Hepatic Gluconeogenesis and Increases Intestinal Gluconeogenesis in a T2DM Rat Model.Obes Surg. 2016 Nov;26(11):2683-2690. doi: 10.1007/s11695-016-2157-5. Obes Surg. 2016. PMID: 27038047
-
[Novel aspects in the mechanisms of steroid diabetes and the regulation of hepatic glucose production by insulin and steroids].Med Klin (Munich). 2003 Apr 25;98(5):283-6. doi: 10.1007/s00063-003-1258-9. Med Klin (Munich). 2003. PMID: 12721674 Review. German.
-
Recent advances of long non-coding RNAs in control of hepatic gluconeogenesis.Front Endocrinol (Lausanne). 2023 Mar 31;14:1167592. doi: 10.3389/fendo.2023.1167592. eCollection 2023. Front Endocrinol (Lausanne). 2023. PMID: 37065737 Free PMC article. Review.
Cited by
-
Tyrosol-loaded Nano-niosomes Attenuate Diabetic Injury by TargetingGlucose Metabolism, Inflammation, and Glucose Transfer.Pharm Nanotechnol. 2024;12(4):351-364. doi: 10.2174/0122117385251271231018104311. Pharm Nanotechnol. 2024. PMID: 37927074
-
Anti-Obesity and Anti-Hyperglycemic Effects of Meretrix lusoria Protamex Hydrolysate in ob/ob Mice.Int J Mol Sci. 2022 Apr 5;23(7):4015. doi: 10.3390/ijms23074015. Int J Mol Sci. 2022. PMID: 35409375 Free PMC article.
-
Oxymatrine impedes Alzheimer's progression via the attenuation of hypercholesterolemia and fibrosis.Metab Brain Dis. 2025 Apr 17;40(5):187. doi: 10.1007/s11011-025-01606-w. Metab Brain Dis. 2025. PMID: 40244482
-
Hydroxy Selenomethionine Improves Meat Quality through Optimal Skeletal Metabolism and Functions of Selenoproteins of Pigs under Chronic Heat Stress.Antioxidants (Basel). 2021 Sep 29;10(10):1558. doi: 10.3390/antiox10101558. Antioxidants (Basel). 2021. PMID: 34679693 Free PMC article.
-
Thymoquinone attenuates diabetes-induced hepatic damage in rat via regulation of oxidative/nitrosative stress, apoptosis, and inflammatory cascade with molecular docking approach.Sci Rep. 2024 Jun 6;14(1):13016. doi: 10.1038/s41598-024-62780-y. Sci Rep. 2024. PMID: 38844763 Free PMC article.
References
LinkOut - more resources
Full Text Sources