. 2021 May 1;2(2):100489.
doi: 10.1016/j.xpro.2021.100489. eCollection 2021 Jun 18.

Protocols for endothelial cell isolation from mouse tissues: small intestine, colon, heart, and liver

Affiliations

Protocols for endothelial cell isolation from mouse tissues: small intestine, colon, heart, and liver

Liliana Sokol et al. STAR Protoc. .

Abstract

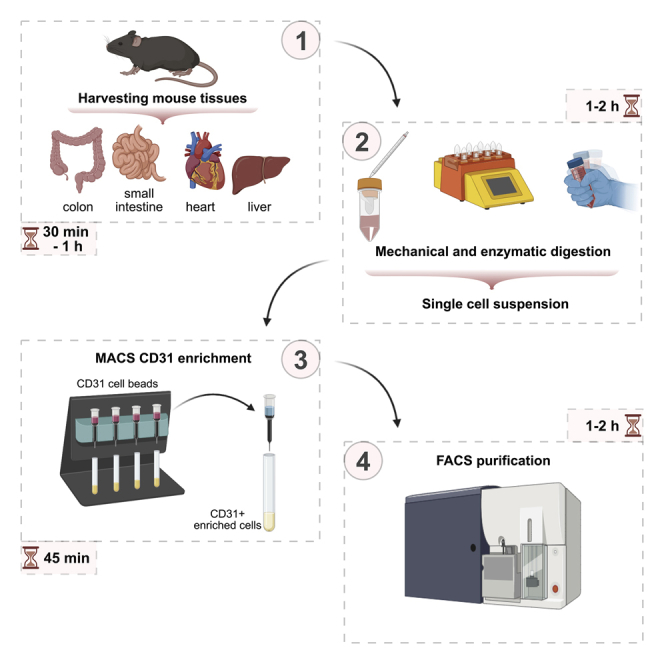
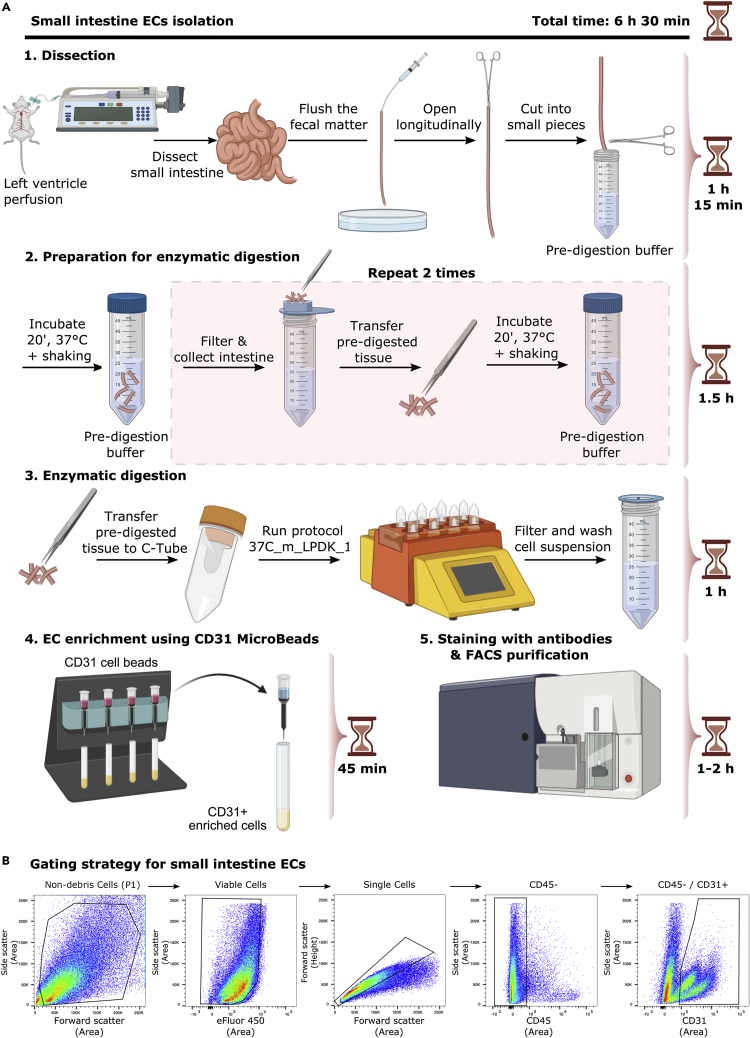
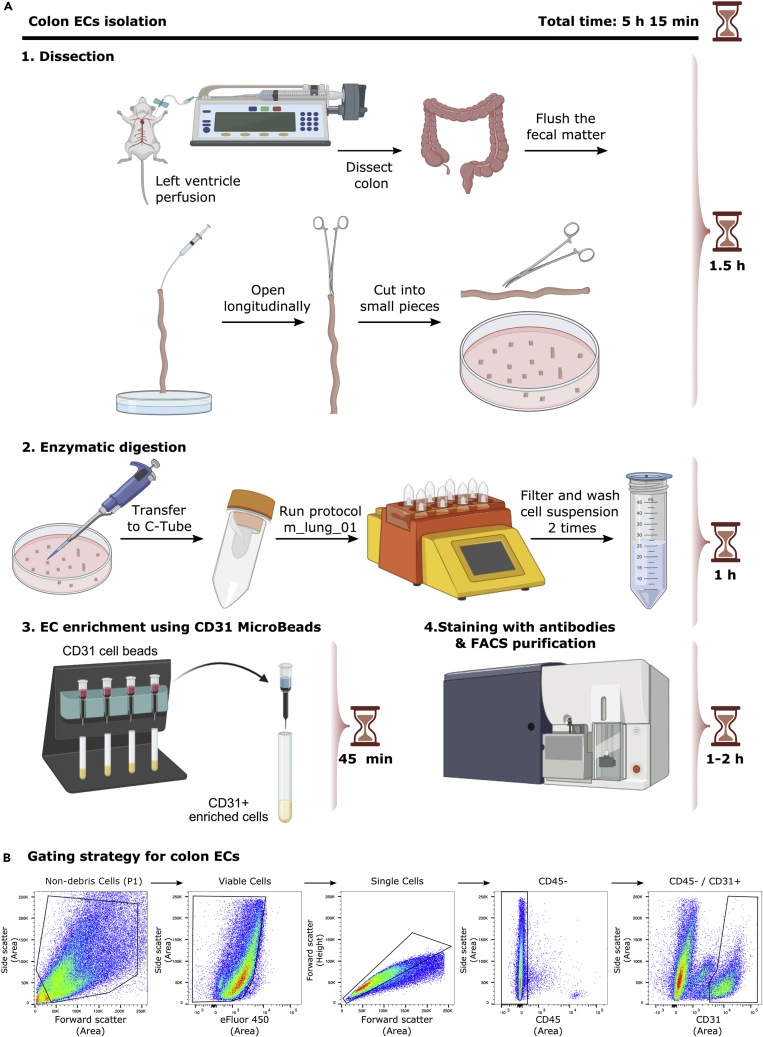
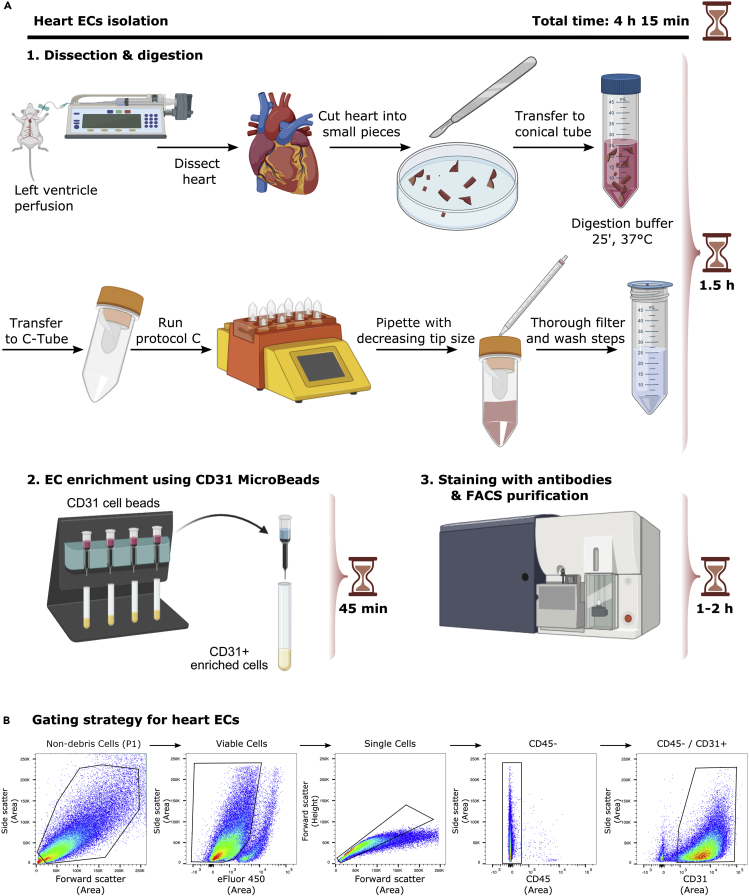
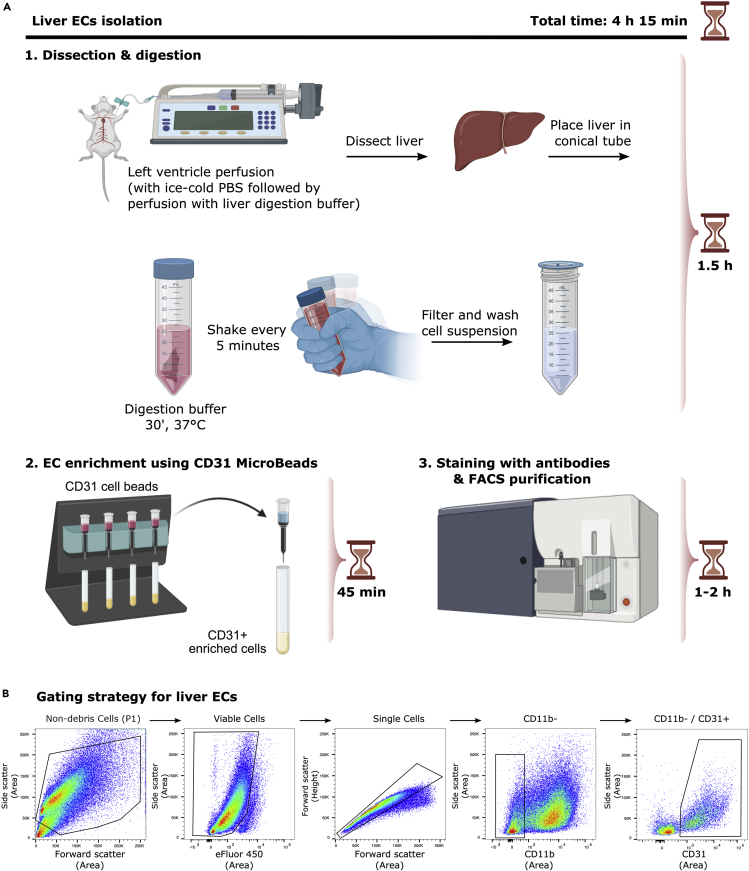
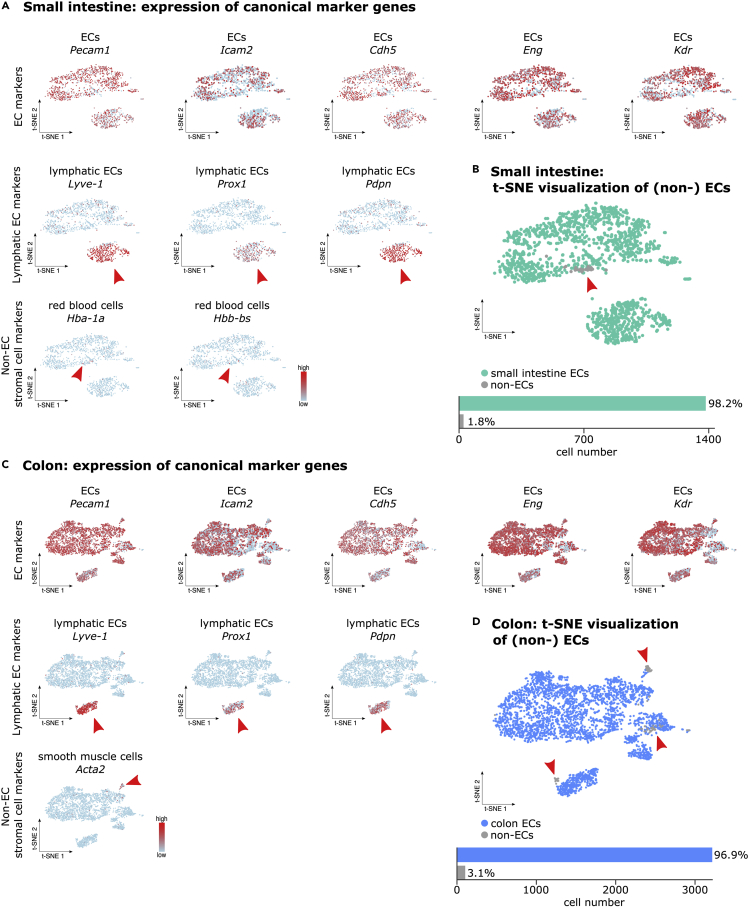
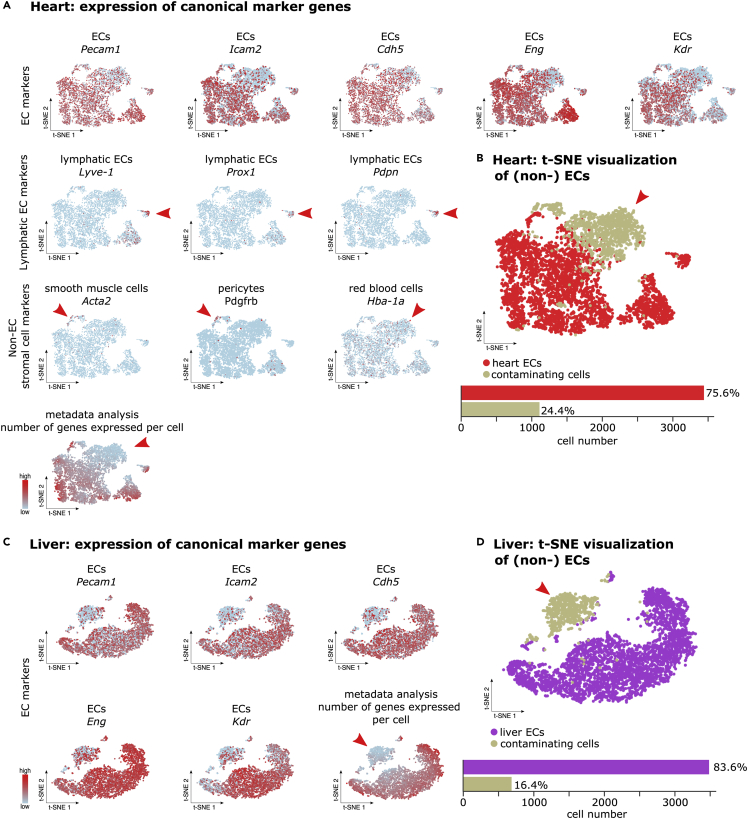
Endothelial cells (ECs) from the small intestine, colon, liver, and heart have distinct phenotypes and functional adaptations that are dependent on their physiological environment. Gut ECs adapt to low oxygen, heart ECs to contractile forces, and liver ECs to low flow rates. Isolating high-purity ECs in sufficient quantities is crucial to study their functions. Here, we describe protocols combining magnetic and fluorescent activated cell sorting for rapid and reproducible EC purification from four adult murine tissues. For complete details on the use and execution of these protocols, please refer to Kalucka et al. (2020).

Keywords: Cell isolation; Flow Cytometry/Mass Cytometry; Single Cell.


Conflict of interest statement

The authors declare no competing interests.

Figures

None
Graphical abstract
Figure 1
Figure 1
EC isolation from mouse small intestine (A) Detailed scheme illustrating isolation of ECs from small intestine. (B) Representative FACS plots for the gating strategy to sort ECs from small intestine based on sorting live/CD45-/CD31+ cells.
Figure 2
Figure 2
EC isolation from mouse colon (A) Detailed scheme illustrating isolation of ECs from colon. (B) Representative FACS plots for the gating strategy to sort ECs from colon based on sorting live/CD45-/CD31+ cells.
Figure 3
Figure 3
EC isolation from mouse heart (A) Detailed scheme illustrating isolation of ECs from heart. (B) Representative FACS plots for the gating strategy to sort ECs from heart based on sorting live/CD45-/CD31+ cells.
Figure 4
Figure 4
EC isolation from mouse liver (A) Detailed scheme illustrating isolation of ECs from liver. (B) Representative FACS plots for the gating strategy to sort ECs from liver based on sorting live/CD11b-/CD31+ cells.
Figure 5
Figure 5
Characterization of the small intestine and colon EC sample purity (A) t-SNE (t-distributed stochastic neighbor embedding) visualization of scRNA-seq analyses on ECs isolated from mouse small intestine showing representative EC and non-EC gene markers expression. Red arrowheads are pointing at cells highly expressing the marker gene. Color scale: red, high expression; blue, low expression. (B) Top: t-SNE visualization of small intestine (non-) ECs color coded per condition. Red arrowheads are pointing at non-ECs. Bottom: bar plot illustrating the quantification of EC and non-ECs. (C) t-SNE visualization of scRNA-seq analyses on ECs isolated from mouse colon showing representative EC and non-EC gene markers expression.Red arrowheads are pointing at cells highly expressing the marker gene. Color scale: red, high expression; blue, low expression. (D) Top: t-SNE visualization of colon (non-) ECs color coded per condition. Red arrowheads are pointing at non-ECs. Bottom: bar plot illustrating the quantification of EC and non-ECs.
Figure 6
Figure 6
Characterization of the heart and liver EC sample purity (A) t-SNE visualization of scRNA-seq analyses on ECs isolated from mouse heart showing representative EC and non-EC gene markers expression and t-SNE visualization of the number of genes expressed per cell. Red arrowheads are pointing at cells highly expressing the marker gene (or cells with low gene number expression). Color scale: red, high expression; blue, low expression. (B) Top: t-SNE visualization of heart (non-) ECs color coded per cell type. Red arrowheads are pointing at non-ECs. Bottom: bar plot illustrating the quantification of EC and non-ECs. (C) t-SNE visualization of scRNA-seq analyses on ECs isolated from mouse liver showing representative EC and non-EC gene markers expression and t-SNE visualization of the number of genes expressed per cell. Red arrowheads are pointing at cells highly expressing the marker gene (or cells with low gene number expression). Color scale: red, high expression; blue, low expression. (D) Top: t-SNE visualization of liver (non-) ECs color coded per cell type. Red arrowheads are pointing at non-ECs. Bottom: bar plot illustrating the quantification of EC and non-ECs

References

    1. Abraham G., Qiu Y., Inouye M. FlashPCA2: principal component analysis of Biobank-scale genotype datasets. Bioinformatics. 2017;33:2776–2778. - PubMed
    1. Crosswhite P. Isolation of LYVE-1+ endothelial cells from mouse embryos. Bio-protocol. 2018;8:e2962. - PMC - PubMed
    1. Fujimoto N., He Y., D’ADDIO M., Tacconi C., Detmar M., Dieterich L.C. Single-cell mapping reveals new markers and functions of lymphatic endothelial cells in lymph nodes. bioRxiv. 2020 2020.01.09.900241. - PMC - PubMed
    1. Kalucka J., De Rooij L.P.M.H., Goveia J., Rohlenova K., Dumas S.J., Meta E., Conchinha N.V., Taverna F., Teuwen L.-A., Veys K. Single-cell transcriptome atlas of murine endothelial cells. Cell. 2020;180:764–779.e20. - PubMed
    1. Satija R., Farrell J.A., Gennert D., Schier A.F., Regev A. Spatial reconstruction of single-cell gene expression data. Nat. Biotechnol. 2015;33:495–502. - PMC - PubMed

Publication types

LinkOut - more resources