Observational Study
. 2021 Jul 13;106(8):2208-2220.
doi: 10.1210/clinem/dgab349.

Normal Adrenal and Thyroid Function in Patients Who Survive COVID-19 Infection

Affiliations
Observational Study

Normal Adrenal and Thyroid Function in Patients Who Survive COVID-19 Infection

Sophie A Clarke et al. J Clin Endocrinol Metab. .

Abstract

Context: The COVID-19 pandemic continues to exert an immense burden on global health services. Moreover, up to 63% of patients experience persistent symptoms, including fatigue, after acute illness. Endocrine systems are vulnerable to the effects of COVID-19 as many glands express the ACE2 receptor, used by the SARS-CoV-2 virion for cellular access. However, the effects of COVID-19 on adrenal and thyroid gland function after acute COVID-19 remain unknown.

Objective: Our objectives were to evaluate adrenal and thyroid gland function in COVID-19 survivors.

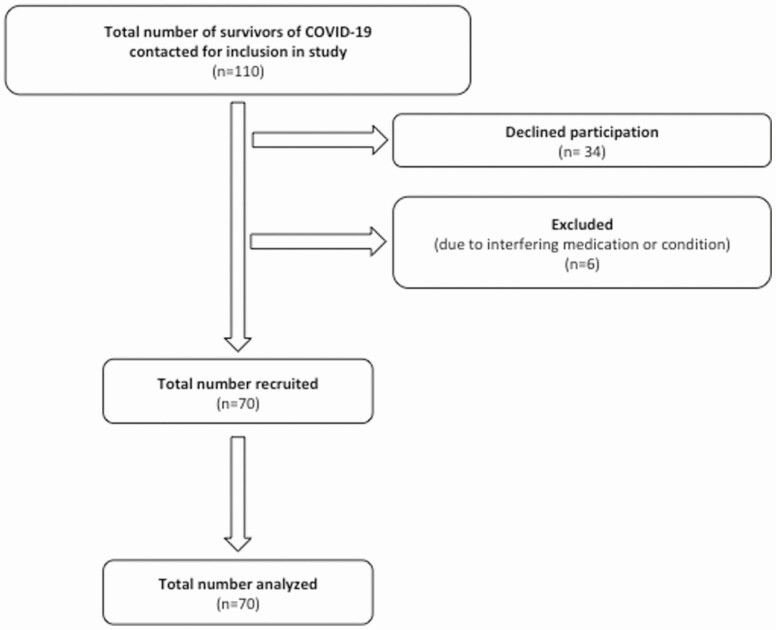
Methods: A prospective, observational study was undertaken at the Clinical Research Facility, Imperial College NHS Healthcare Trust, including 70 patients ≥18 years of age, at least 3 months after diagnosis of COVID-19. Participants attended a research study visit (8:00-9:30 am), during which a short Synacthen test (250 µg IV bolus) and thyroid function assessments were performed.

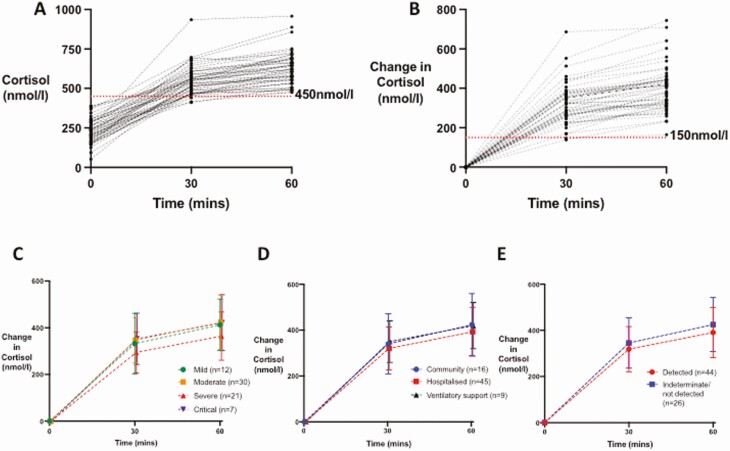
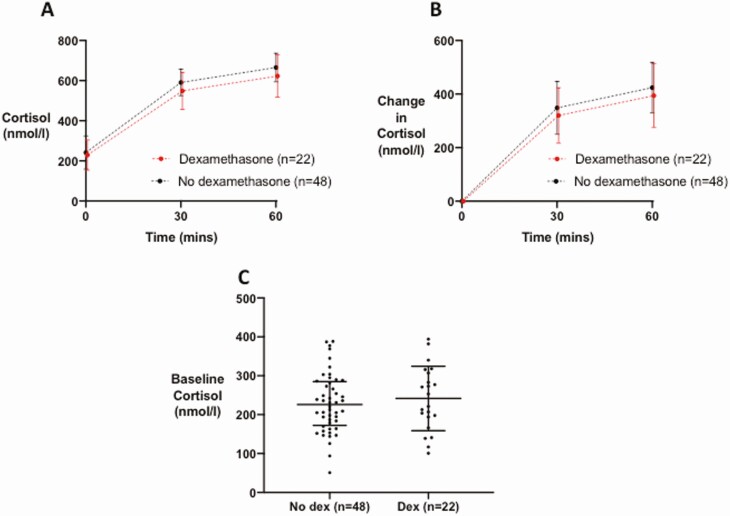
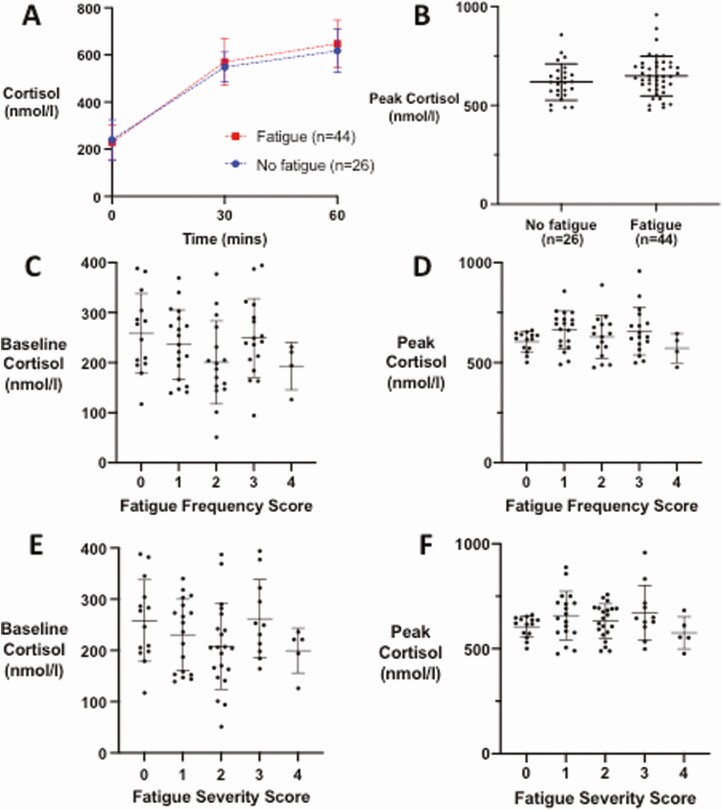
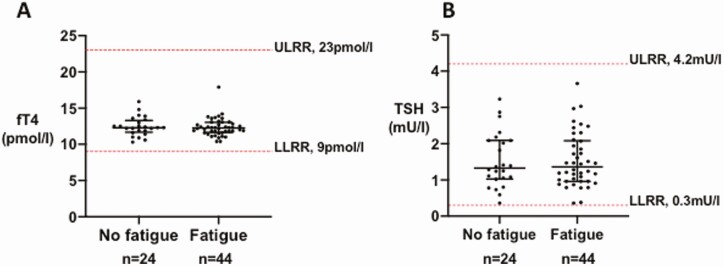
Results: All patients had a peak cortisol ≥450 nmol/L after Synacthen, consistent with adequate adrenal reserve. Basal and peak serum cortisol did not differ according to disease severity or history of dexamethasone treatment during COVID-19. There was no difference in baseline or peak cortisol after Synacthen or in thyroid function tests, or thyroid status, in patients with fatigue (n = 44) compared to those without (n = 26).

Conclusion: Adrenal and thyroid function ≥3 months after presentation with COVID-19 was preserved. While a significant proportion of patients experienced persistent fatigue, their symptoms were not accounted for by alterations in adrenal or thyroid function. These findings have important implications for the clinical care of patients after COVID-19.

Keywords: COVID-19; SARS-CoV-2; adrenal function; adrenal insufficiency; thyroid function; thyroid gland.


Figures

Figure 1.
Figure 1.
STROBE diagram showing patients meeting inclusion criteria (n = 70).
Figure 2.
Figure 2.
Serum cortisol response to Synacthen 250 µg in patients 3 months after COVID-19 (n = 70). (A) Individual responses of serum cortisol at 30 and 60 minutes after an IV bolus of 250 µg of Synacthen in patients ≥3 months after presentation with COVID-19 are presented. (B) Individual responses in change in serum cortisol from baseline at 30 and 60 minutes after an IV bolus of 250 µg of Synacthen in patients assessed ≥3 months after presentation with COVID-19 are presented. (C) Mean and SD change in cortisol from baseline (nmol/L) after an IV bolus of 250 µg of Synacthen in patients recovering from COVID-19 by WHO Disease Severity (mild, n = 12 represented by green symbols and line; moderate, n = 30, represented by orange symbols and lines; severe, n = 21, represented by red symbols and line; critical, n = 7, represented by purple symbols and line). (D) Mean (error bars show SD) change in cortisol from baseline (nmol/L) after Synacthen 250 µg in patients recovering from COVID-19 by level of care required: community care (n = 16), represented by blue symbols and line; hospitalized and not requiring ventilatory support (n = 45), represented by red symbols and lines; ventilatory support required (n = 9), represented by black symbols and lines. (E) Mean and SD change in cortisol from baseline (nmol/L) after Synacthen 250 µg in patients recovering from COVID-19 by antibody status as determined by Abbott Architect IgG to SARS-CoV-2 (detected, n = 44, represented by blue symbols and lines; not detected/indeterminate, n = 26, represented by red symbols and lines).
Figure 3.
Figure 3.
Serum cortisol response to 250 µg Synacthen in patients who received dexamethasone as part of their treatment for COVID-19 (n = 22, represented by red symbols and lines) vs those who did not (n = 48, represented by black symbols and lines). (A) Data presented are mean (error bars show SD) cortisol (nmol/L) at 30 and 60 minutes following Synacthen 250 µg. (B) Data presented are mean (error bars show SD) change in serum cortisol from baseline (nmol/L) at 30 and 60 minutes following Synacthen 250 µg. (C) Graph of baseline serum cortisol (nmol/L).
Figure 4.
Figure 4.
Serum cortisol response to 250 µg Synacthen in patients 3 months after COVID-19 with persistent fatigue (n = 44) compared with those without (n = 26). (A) Mean (error bars show SD) for serum cortisol (nmol/L) at 30 and 60 minutes following Synacthen, comparing patients with persistent fatigue (n = 44, red lines and symbols) vs those with no persistent fatigue (n = 26, blue lines and symbols). (B) Graph of peak serum cortisol in patients with persistent fatigue and those without persistent fatigue. Individual data points plotted with horizontal line representing mean, whiskers represent SD. (C) Graph of baseline cortisol in groups classified by tiredness frequency graded 0 (not present), 1 (present a little of the time), 2 (present about half of the time), 3 (present most of the time), 4 (present all of the time). (D) Graph of peak cortisol in groups classified by tiredness frequency graded 0 (not present), 1 (present a little of the time), 2 (present about half of the time), 3 (present most of the time), 4 (present all of the time). (E) Graph of baseline cortisol in groups classified by tiredness severity graded 0 (not present), 1 (mild), 2 (moderate), 3 (severe), 4 (very severe). (F) Graph of peak cortisol (nmol/L) in groups classified by tiredness severity score graded 0 (not present), 1 (mild), 2 (moderate), 3 (severe), 4 (very severe).
Figure 5.
Figure 5.
Thyroid function tests in patients with persistent fatigue. (A) Graph of individual TSH (mU/L) values in patients with fatigue (n = 44) compared with those without (n = 24), in those with no preexisting thyroid disease (n = 68). Individual data points plotted with horizontal line representing median, whiskers represent upper and lower interquartile range (IQR). The normal reference range for TSH using Abbott Architect assay (0.3-4.2 mU/L) is depicted using the red dashed line. Abbreviations: LLRR, lower limit reference range; ULRR, upper limit reference range. (B) Graph of individual fT4 (pmol/L) values in patients with fatigue (n = 44) compared with those without (n = 24) in those with no preexisting thyroid disease (n = 68). Individual data points plotted with horizontal line representing median, whiskers represent upper and lower IQR. The normal reference range for fT4 using Abbott Architect assay (9-23 pmol/L) is depicted using the red dashed line. Abbreviations: LLRR, lower limit reference range; ULRR, upper limit reference range.

References

    1. World Health Organization. World Health Organisation Coronavirus Disease (COVID-19) Dashboard. Accessed February 11, 2021. https://covid19.who.int
    1. Lundholm MD, Poku C, Emanuele N, Emanuele MA, Lopez N. SARS-CoV-2 (COVID-19) and the endocrine system. J Endocr Soc. 2020;4(11):1-13. - PMC - PubMed
    1. Li M-Y, Li L, Zhang Y, Wang X-S. Expression of the SARS-CoV-2 cell receptor gene ACE2 in a wide variety of human tissues. Infect Dis Poverty. Published online April 28, 2020;9(1):45. doi:10.1186/s40249-020-00662-x - DOI - PMC - PubMed
    1. Donoghue M, Hsieh F, Baronas E, et al. . A novel angiotensin-converting enzyme-related carboxypeptidase (ACE2) converts angiotensin I to angiotensin 1-9. Circ Res. 2000;87(5):E1-E9. - PubMed
    1. Ding Y, He L, Zhang Q, et al. . Organ distribution of severe acute respiratory syndrome (SARS) associated coronavirus (SARS-CoV) in SARS patients: implications for pathogenesis and virus transmission pathways. J Pathol. 2004;203(2):622-630. - PMC - PubMed

Publication types

MeSH terms