Observational Study
. 2021 Jun 7;18(6):2263-2273.
doi: 10.1021/acs.molpharmaceut.1c00083. Epub 2021 May 19.

Abundance of P-glycoprotein and Breast Cancer Resistance Protein Measured by Targeted Proteomics in Human Epileptogenic Brain Tissue

Affiliations
Observational Study

Abundance of P-glycoprotein and Breast Cancer Resistance Protein Measured by Targeted Proteomics in Human Epileptogenic Brain Tissue

Aniv Mann Brukner et al. Mol Pharm. .

Abstract

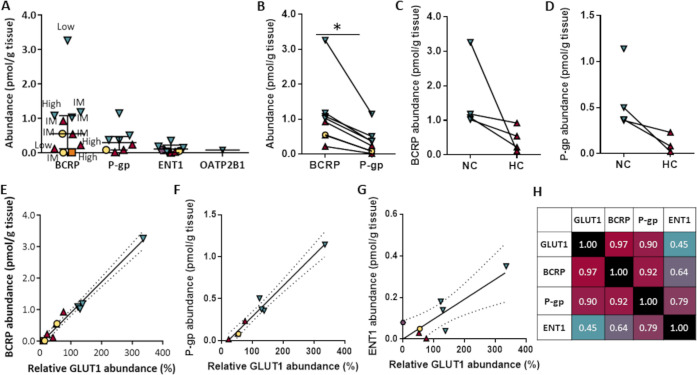
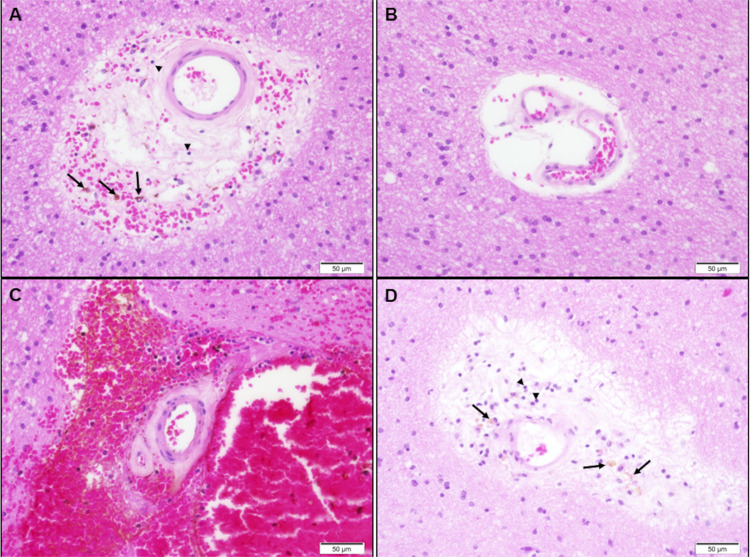
Our goal was to measure the absolute differential abundance of key drug transporters in human epileptogenic brain tissue and to compare them between patients and at various distances from the epileptogenic zone within the same patient. Transporter protein abundance was quantified in brain tissue homogenates from patients who underwent epilepsy surgery, using targeted proteomics, and correlations with clinical and tissue characteristics were assessed. Fourteen brain samples (including four epileptogenic hippocampal samples) were collected from nine patients. Among the quantifiable drug transporters, the abundance (median, range) ranked: breast cancer resistance protein (ABCG2/BCRP; 0.55, 0.01-3.26 pmol/g tissue) > P-glycoprotein (ABCB1/MDR1; 0.30, 0.02-1.15 pmol/g tissue) > equilibrative nucleoside transporter 1 (SLC29A1/ENT1; 0.06, 0.001-0.35 pmol/g tissue). The ABCB1/ABCG2 ratio (mean 0.27, range 0.08-0.47) was comparable with literature values from nonepileptogenic brain tissue (mean 0.5-0.8). Transporter abundance was lower in the hippocampi than in the less epileptogenic neocortex of the same patients. ABCG2/BCRP and ABCB1/MDR1 expression strongly correlated with that of glucose transporter 1 (SLC2A1/GLUT1) (r = 0.97, p < 0.001; r = 0.90, p < 0.01, respectively). Low transporter abundance was found in patients with overt vascular pathology, whereas the highest abundance was seen in a sample with normally appearing blood vessels. In conclusion, drug transporter abundance highly varies across patients and between epileptogenic and less epileptogenic brain tissue of the same patient. The strong correlation in abundance of ABCB1/MDR1, ABCG2/BCRP, and SLC2A1/GLUT1 suggests variation in the content of the functional vasculature within the tissue samples. The epileptogenic tissue can be depleted of key drug transport mechanisms, warranting consideration when selecting treatments for patients with drug-resistant epilepsy.

Keywords: P-glycoprotein; antiepileptic drugs; antiseizure medications; breast cancer resistance protein; epilepsy; targeted proteomics.


Conflict of interest statement

The authors declare the following competing financial interest(s): Sara Eyal has received speaker honoraria from Megapharm, Israel. The remaining authors have no conflicts of interest.

Figures

Figure 1
Figure 1
Transporter protein abundance in epileptogenic brain tissue (based on the data presented on Table 2). (A) Comparative levels of ABCG2/BCRP, ABCB1/MDR1 (P-gp), SLC29A1/ENT1, and SLC21A9/OATP2B1. Results are presented as median and interquartile range of 11, 8, and 8 samples in which ABCG2/BCRP, ABCB1/MDR1 (P-gp), and SLC29A1/ENT1 were quantifiable, respectively. SLC21A9/OATP2B1 was above the LLOQ in one sample. Triangles, hippocampal (HC) tissue from patients with hippocampal sclerosis; inverse triangles, temporal neocortex from the same patients; circles, two samples from a patient with right temporal dysplasia (no. 9); hexagon, temporo-occipital lobe tissue from a patient with meningioangiomatosis (no. 2); and square, occipito-temporal lobe tissue from a patient with an ischemic lesion (no. 7). Most patients continued antiseizure medications throughout the surgery, but one (no. 7) underwent drug withdrawal 4 days before the surgery, after implantation of the subdural electrodes. Also shown are relative seizure frequencies before surgery with regard to each sample. High, ≥1 seizure/day; IM, intermediate, <1 seizure day–>1 seizure week; and low, an average of <1 seizure/week. (B) Abundance of ABCG2/BCRP and ABCB1/MDR1 in individual tissue samples. *Statistically significant difference, p < 0.01, Wilcoxon matched-pairs signed-rank test. (C, D) ABCG2/BCRP (C) and ABCB1/MDR1 (D) abundance in hippocampal (HC; right) and adjacent neocortical (NC; left) tissue in four patients with hippocampal sclerosis. Each line connects data from individual patients. ABCB1/MDR1 was below the lower limit of quantification (LLOQ) in one hippocampal tissue sample. SLC29A1/ENT1 was below LLOQ in two hippocampal samples and is not shown. (E) GLUT1-BCRP correlation. (F) GLUT1-MDR1 correlation. (G). GLUT1-ENT1 correlation. The dashed lines in (E–G) represent the 95% confidence band. (H) Heatmap of protein–protein correlation coefficients (r; Spearman) across the four studied transporters.
Figure 2
Figure 2
[18F]-activity in epileptogenic and reference brain tissue. (A) Correlation between relative SLC2A1/GLUT1 expression and [18F]FDG activity ([18F]FDG in resected tissue/cerebellar signal) across patients and samples. (B) Presurgical [18F]FDG-PET brain image of patient 3 (highest neocortical SLC2A1/GLUT1 expression) superimposed on postsurgical MRI, showing resection of the right anterior temporal lobe and of the right amygdala and hippocampus. Numerical values represent the [18F]FDG activity within respective VOIs and SLC2A1/GLUT1 abundance in tissue resected from the hippocampus and the posterior temporal lobe (bold). The [18F]FDG activity in the right hippocampus was lower than in the left hippocampus (93%), the right posterior temporal lobe (69%), and right anterior temporal lobe (87%). No asymmetry was observed in the cerebellum (not shown). In comparison, SLC2A1/GLUT1 abundance in the right hippocampus was 12.5% of the abundance in the right posterior temporal lobe.
Figure 3
Figure 3
Pathological examination of arterioles within resected epileptogenic tissue from patient 1. Hematoxylin- and eosin-stained, paraffin-embedded sections display white matter blood vessels, with some degree of wall thickening/hyalinization (most prominent in A and C), associated with variable perivascular neuropil loosening (most prominent in B and D), hemorrhage (C), and few hemosiderophages (arrows) and few lymphocytes (arrowheads). Magnification 40×; the scale bar is shown in the lower right corner of each image.

Similar articles

Cited by

References

    1. Kwan P.; Arzimanoglou A.; Berg A. T.; Brodie M. J.; Allen Hauser W.; Mathern G.; et al. Definition of drug resistant epilepsy: consensus proposal by the ad hoc Task Force of the ILAE Commission on Therapeutic Strategies. Epilepsia 2010, 51, 1069–1077. 10.1111/j.1528-1167.2009.02397.x. - DOI - PubMed
    1. Kwan P.; Schachter S. C.; Brodie M. J. Drug-resistant epilepsy. N. Engl. J. Med. 2011, 365, 919–926. 10.1056/NEJMra1004418. - DOI - PubMed
    1. Bauer M.; Karch R.; Zeitlinger M.; Liu J.; Koepp M. J.; Asselin M. C.; et al. In vivo P-glycoprotein function before and after epilepsy surgery. Neurology 2014, 83, 1326–1331. 10.1212/WNL.0000000000000858. - DOI - PMC - PubMed
    1. Dombrowski S. M.; Desai S. Y.; Marroni M.; Cucullo L.; Goodrich K.; Bingaman W.; et al. Overexpression of multiple drug resistance genes in endothelial cells from patients with refractory epilepsy. Epilepsia 2001, 42, 1501–1506. 10.1046/j.1528-1157.2001.12301.x. - DOI - PubMed
    1. Lazarowski A.; Czornyj L. Potential role of multidrug resistant proteins in refractory epilepsy and antiepileptic drugs interactions. Drug Metab. Drug Interact. 2011, 26, 21–26. 10.1515/dmdi.2011.006. - DOI - PubMed

Publication types

MeSH terms

Substances

LinkOut - more resources