

Airway compliance measurements in mouse models of respiratory diseases
- PMID: 34009049
- PMCID: PMC8321862
- DOI: 10.1152/ajplung.00470.2020
Airway compliance measurements in mouse models of respiratory diseases
Abstract
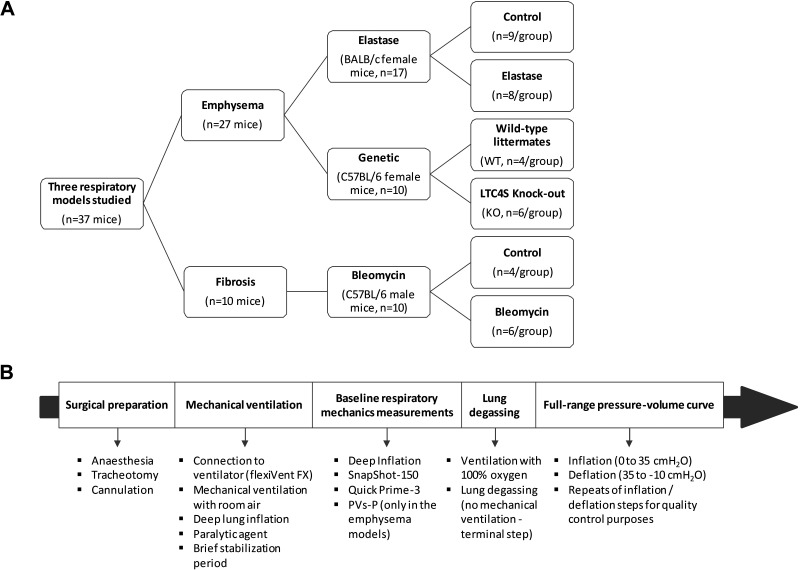
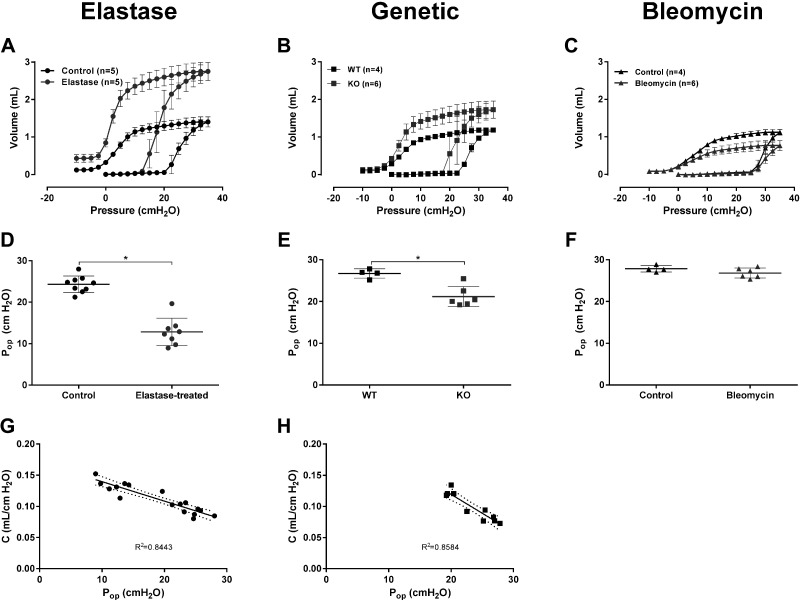
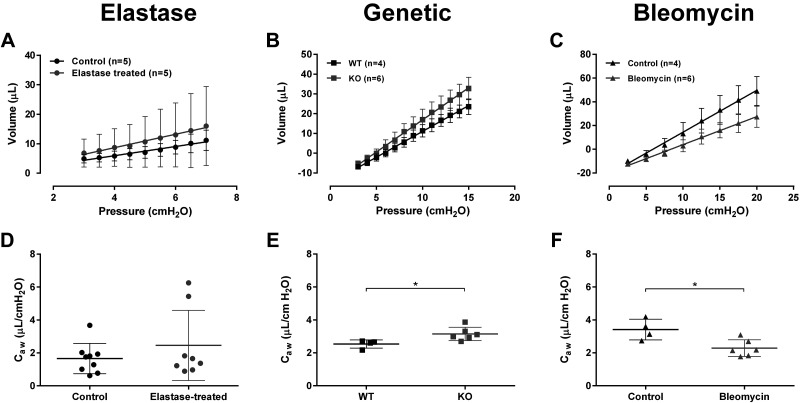
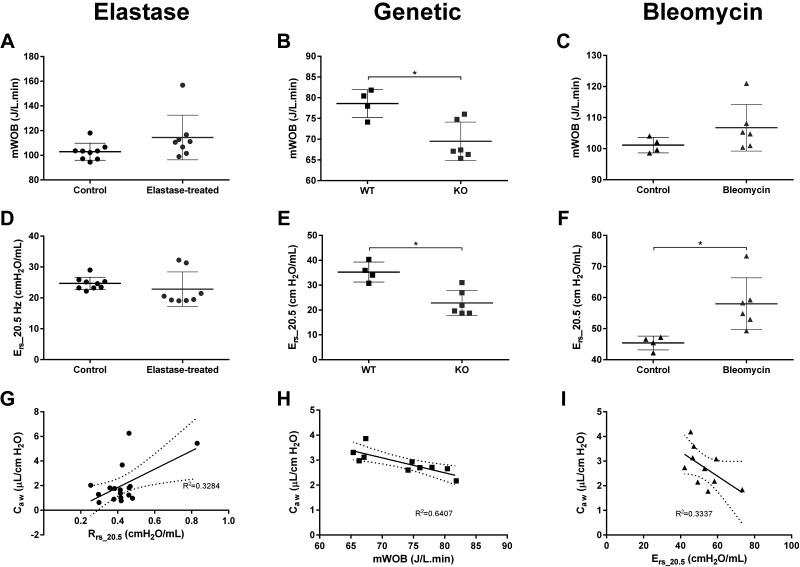
The quantification of airway compliance (Caw) is essential to the study of airway alterations in disease models. However, the required measurements of airway pressure and volume are difficult to acquire in mice. We hypothesized that the inflation limb of full-range pressure-volume (PV) curves could be used to quantify Caw, as it contains a segment where only the airway tree is distended. The study objective was to assess the feasibility of the approach by analysis of full-range PV curves previously collected in three mouse models: an elastase model of emphysema, a genetic model spontaneously developing emphysema (leukotriene C4 synthase knockout; LTC4S-KO), and a bleomycin model of lung fibrosis. Attempts to validate results included Caw change relative to respiratory system compliance (ΔCaw/ΔC), the minute work of breathing (mWOB), and the elastance at 20.5 Hz (Ers_20.5) from prior respiratory mechanics measurements in the same subjects. Caw was estimated at 3% of total compliance in healthy mice or 2.3 ± 1 μL/cmH2O (n = 17). The technique detected changes in models of respiratory obstructive and restrictive diseases relative to control mice as well as differences in the two emphysema models studied. The changes in Caw were consistent with those seen in ΔCaw/ΔC, mWOB, or Ers_20.5, with some variations according to the model, as well as with results reported in the literature in humans and mice. Direct Caw measurements in subjects as small as mice could prove useful to further characterize other respiratory disease models associated with airway remodeling or to assess treatment effects.
Keywords: LTC4 synthase; airway compliance; emphysema; fibrosis; pressure-volume curves.
Conflict of interest statement
A. Robichaud and L. Fereydoonzad are employed by SCIREQ Inc., a commercial entity with interests in a subject area related to the content of this article. SCIREQ Inc. is an emka TECHNOLOGIES company. None of the other authors has any conflicts of interest, financial or otherwise, to disclose.
Figures
Similar articles
-
Fibrotic and emphysematous murine lung mechanics under negative-pressure ventilation.Am J Physiol Lung Cell Mol Physiol. 2025 Mar 1;328(3):L443-L455. doi: 10.1152/ajplung.00087.2024. Epub 2025 Jan 15. Am J Physiol Lung Cell Mol Physiol. 2025. PMID: 39812236 Free PMC article.
-
Static and dynamic mechanics of the murine lung after intratracheal bleomycin.BMC Pulm Med. 2011 May 31;11:33. doi: 10.1186/1471-2466-11-33. BMC Pulm Med. 2011. PMID: 21627835 Free PMC article.
-
Forced expiration measurements in mouse models of obstructive and restrictive lung diseases.Respir Res. 2017 Jun 19;18(1):123. doi: 10.1186/s12931-017-0610-1. Respir Res. 2017. PMID: 28629359 Free PMC article.
-
Bleomycin-induced lung injury in mice investigated by MRI: model assessment for target analysis.Magn Reson Med. 2012 Feb;67(2):499-509. doi: 10.1002/mrm.23009. Epub 2011 Jun 7. Magn Reson Med. 2012. PMID: 21656559
-
Male sex hormones exacerbate lung function impairment after bleomycin-induced pulmonary fibrosis.Am J Respir Cell Mol Biol. 2008 Jul;39(1):45-52. doi: 10.1165/rcmb.2007-0340OC. Epub 2008 Feb 14. Am J Respir Cell Mol Biol. 2008. PMID: 18276795 Free PMC article.
Cited by
-
Adam19 Deficiency Impacts Pulmonary Function: Human GWAS Follow-up in a Mouse Knockout Model.Lung. 2024 Oct;202(5):659-672. doi: 10.1007/s00408-024-00738-7. Epub 2024 Aug 17. Lung. 2024. PMID: 39153120 Free PMC article.
-
Intranasal dupilumab improves responsiveness to steroid in an asthma mouse model.Inflamm Res. 2025 Feb 19;74(1):43. doi: 10.1007/s00011-024-01991-5. Inflamm Res. 2025. PMID: 39969581
-
Fibrotic and emphysematous murine lung mechanics under negative-pressure ventilation.Am J Physiol Lung Cell Mol Physiol. 2025 Mar 1;328(3):L443-L455. doi: 10.1152/ajplung.00087.2024. Epub 2025 Jan 15. Am J Physiol Lung Cell Mol Physiol. 2025. PMID: 39812236 Free PMC article.
-
Wild-type bone marrow cells repopulate tissue resident macrophages and reverse the impacts of homozygous CSF1R mutation.PLoS Genet. 2025 Jan 27;21(1):e1011525. doi: 10.1371/journal.pgen.1011525. eCollection 2025 Jan. PLoS Genet. 2025. PMID: 39869647 Free PMC article.
-
Mouse lung mechanical properties under varying inflation volumes and cycling frequencies.Sci Rep. 2022 May 2;12(1):7094. doi: 10.1038/s41598-022-10417-3. Sci Rep. 2022. PMID: 35501363 Free PMC article.
References
Publication types
MeSH terms
Substances
Grants and funding
LinkOut - more resources
Full Text Sources
Other Literature Sources
Medical
Molecular Biology Databases
Research Materials
Miscellaneous