

A Bayesian Framework for Patient-Level Partitioned Survival Cost-Utility Analysis
- PMID: 34009065
- PMCID: PMC8488644
- DOI: 10.1177/0272989X211012348
A Bayesian Framework for Patient-Level Partitioned Survival Cost-Utility Analysis
Abstract
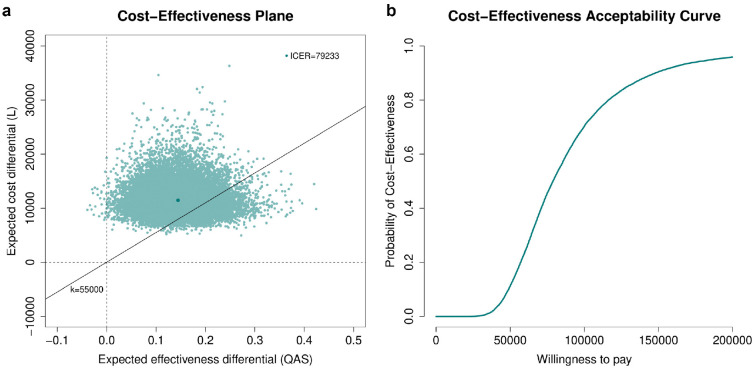
Patient-level health economic data collected alongside clinical trials are an important component of the process of technology appraisal. For end-of-life treatments, the modeling of cost-effectiveness data may involve some form of partitioned survival analysis, in which measures of quality of life and survival for pre- and postprogression periods are combined to generate aggregate measures of clinical benefits (e.g., quality-adjusted survival). In addition, resource use data are often collected and costs are calculated for each type of health service (e.g., treatment, hospital, or adverse events costs). A critical problem in these analyses is that effectiveness and cost data present some complexities, such as nonnormality, spikes, and missingness, which should be addressed using appropriate methods to avoid biased results. This article proposes a general Bayesian framework that takes into account the complexities of trial-based partitioned survival cost-utility data to provide more adequate evidence for policy makers. Our approach is motivated by, and applied to, a working example based on data from a trial assessing the cost-effectiveness of a new treatment for patients with advanced non-small-cell lung cancer.[Box: see text].
Keywords: Bayesian statistics; STAN; economic evaluations; hurdle models; missing data; partitioned survival cost-utility analysis.
Conflict of interest statement
The author declared no potential conflicts of interest with respect to the research, authorship, and/or publication of this article.
Figures
Similar articles
-
A full Bayesian model to handle structural ones and missingness in economic evaluations from individual-level data.Stat Med. 2019 Apr 15;38(8):1399-1420. doi: 10.1002/sim.8045. Epub 2018 Nov 22. Stat Med. 2019. PMID: 30565727
-
Cost-effectiveness of atezolizumab versus docetaxel and nivolumab in the treatment of non-small cell lung cancer as a second line in France.J Med Econ. 2020 May;23(5):464-473. doi: 10.1080/13696998.2020.1718156. Epub 2020 Feb 13. J Med Econ. 2020. PMID: 31951770
-
Utility values associated with advanced or metastatic non-small cell lung cancer: data needs for economic modeling.Expert Rev Pharmacoecon Outcomes Res. 2017 Apr;17(2):153-164. doi: 10.1080/14737167.2017.1311210. Expert Rev Pharmacoecon Outcomes Res. 2017. PMID: 28335636 Review.
-
Cost-Effectiveness of First-Line Pembrolizumab Monotherapy Versus Chemotherapy in High Programmed Death-Ligand 1 Advanced Non-Small Cell Lung Cancer in the Irish Healthcare Setting.Value Health. 2023 Mar;26(3):402-410. doi: 10.1016/j.jval.2022.10.012. Epub 2022 Nov 8. Value Health. 2023. PMID: 36368626
-
Modelling approaches for histology-independent cancer drugs to inform NICE appraisals: a systematic review and decision-framework.Health Technol Assess. 2021 Dec;25(76):1-228. doi: 10.3310/hta25760. Health Technol Assess. 2021. PMID: 34990339
References
-
- Glick HA, Doshi JA, Sonnad SS, Polsky D. Economic Evaluation in Clinical Trials. Oxford (UK): OUP; 2014.
-
- Van Reenen M, Oppe M.EQ-5D-3L user guide basic information on how to use the EQ-5D-3L instrument. 2015. Available from: https://euroqol.org/wp-content/uploads/2016/09/EQ-5D-3L_UserGuide_2015.pdf
-
- Dolan P.Modeling valuations for EuroQol health states. Med Care. 1997;34(11):1095–108. - PubMed
-
- Drummond MF, Schulpher MJ, Claxton K, Stoddart GL, Torrance GW.Methods for the Economic Evaluation of Health Care Programmes. 3rd ed.Oxford (UK): Oxford University Press; 2005.
-
- Glasziou PP, Simes RJ, Gelber RD.Quality adjusted survival analysis. Stat Med. 1990;9(11):1259–76. - PubMed
MeSH terms
LinkOut - more resources
Full Text Sources
Other Literature Sources
Medical
