. 2021 May 19:10:e64013.
doi: 10.7554/eLife.64013.

Onset of taste bud cell renewal starts at birth and coincides with a shift in SHH function

Affiliations

Onset of taste bud cell renewal starts at birth and coincides with a shift in SHH function

Erin J Golden et al. Elife. .

Abstract

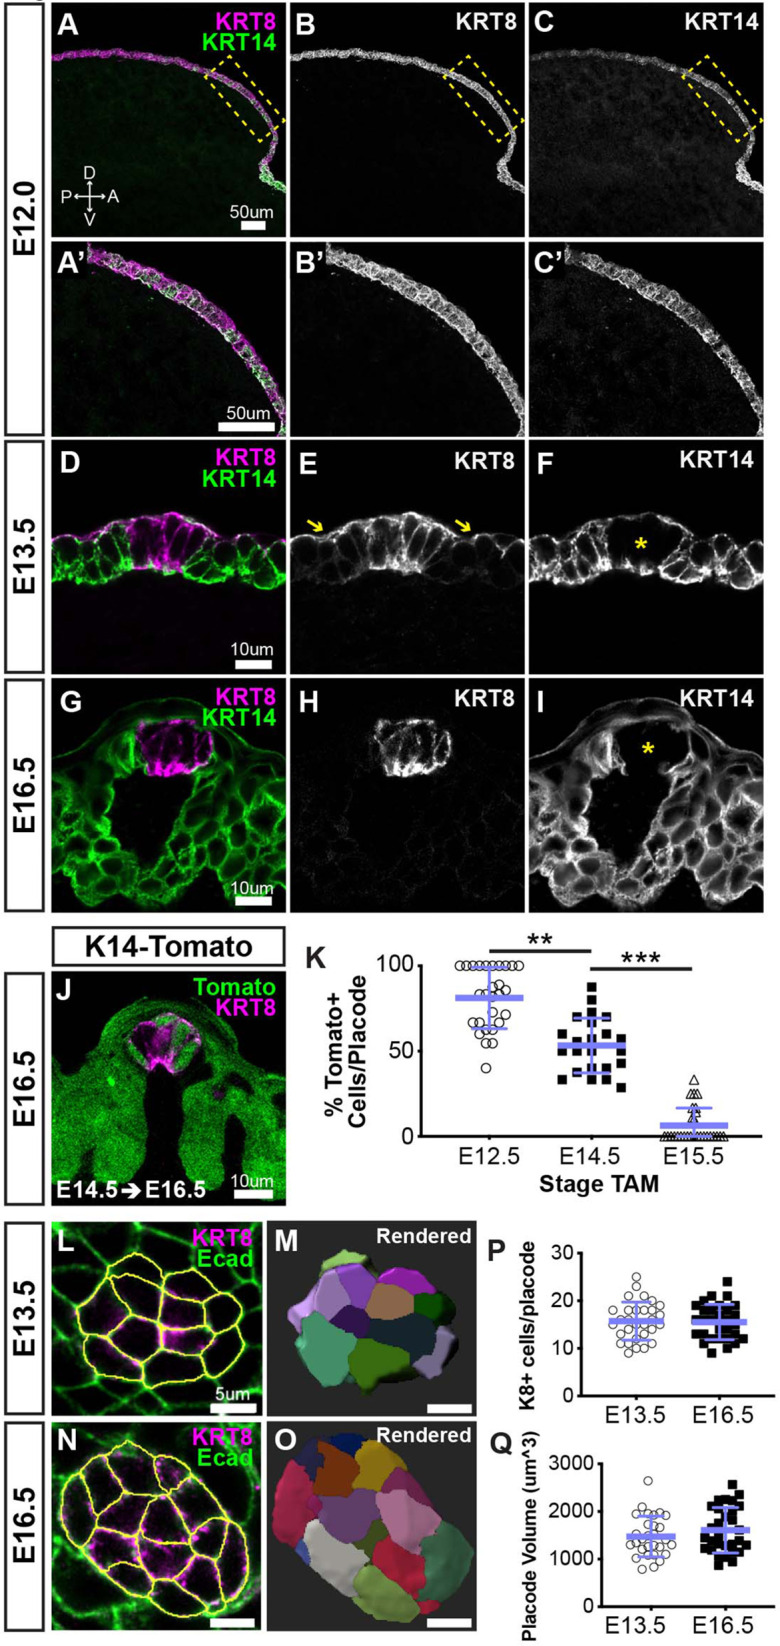
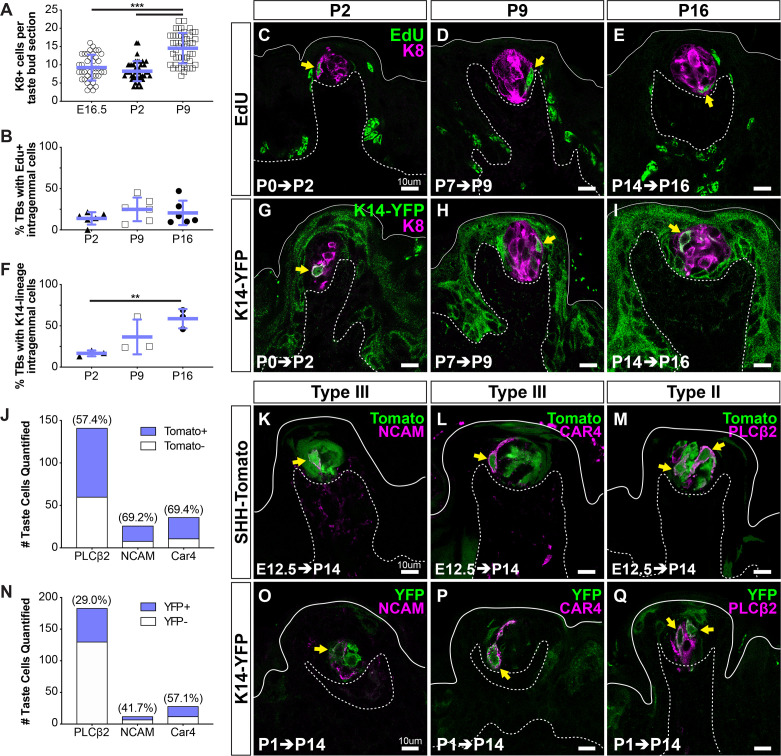
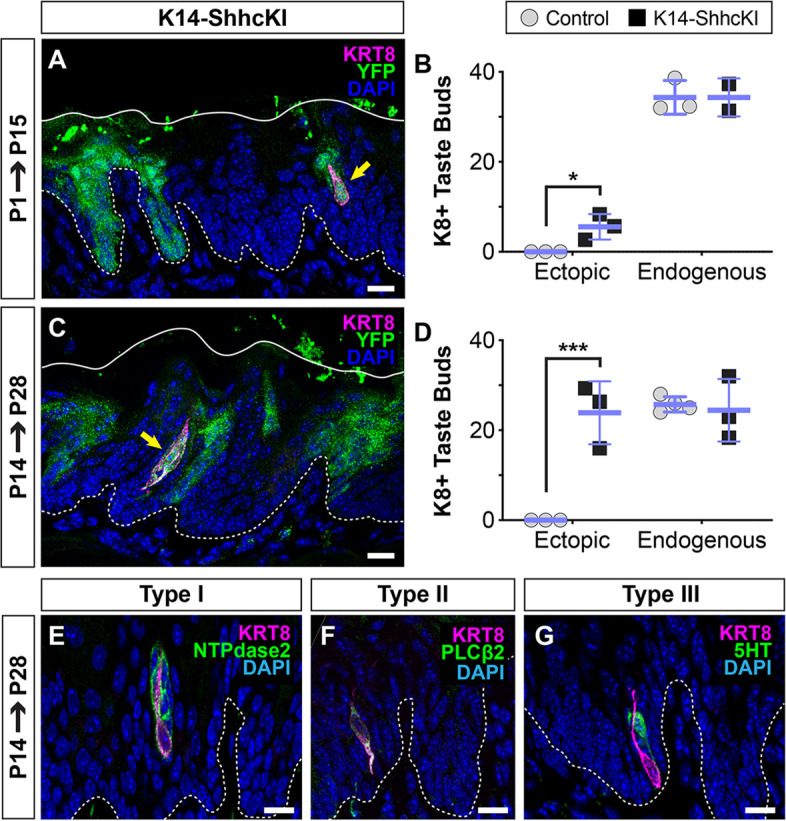
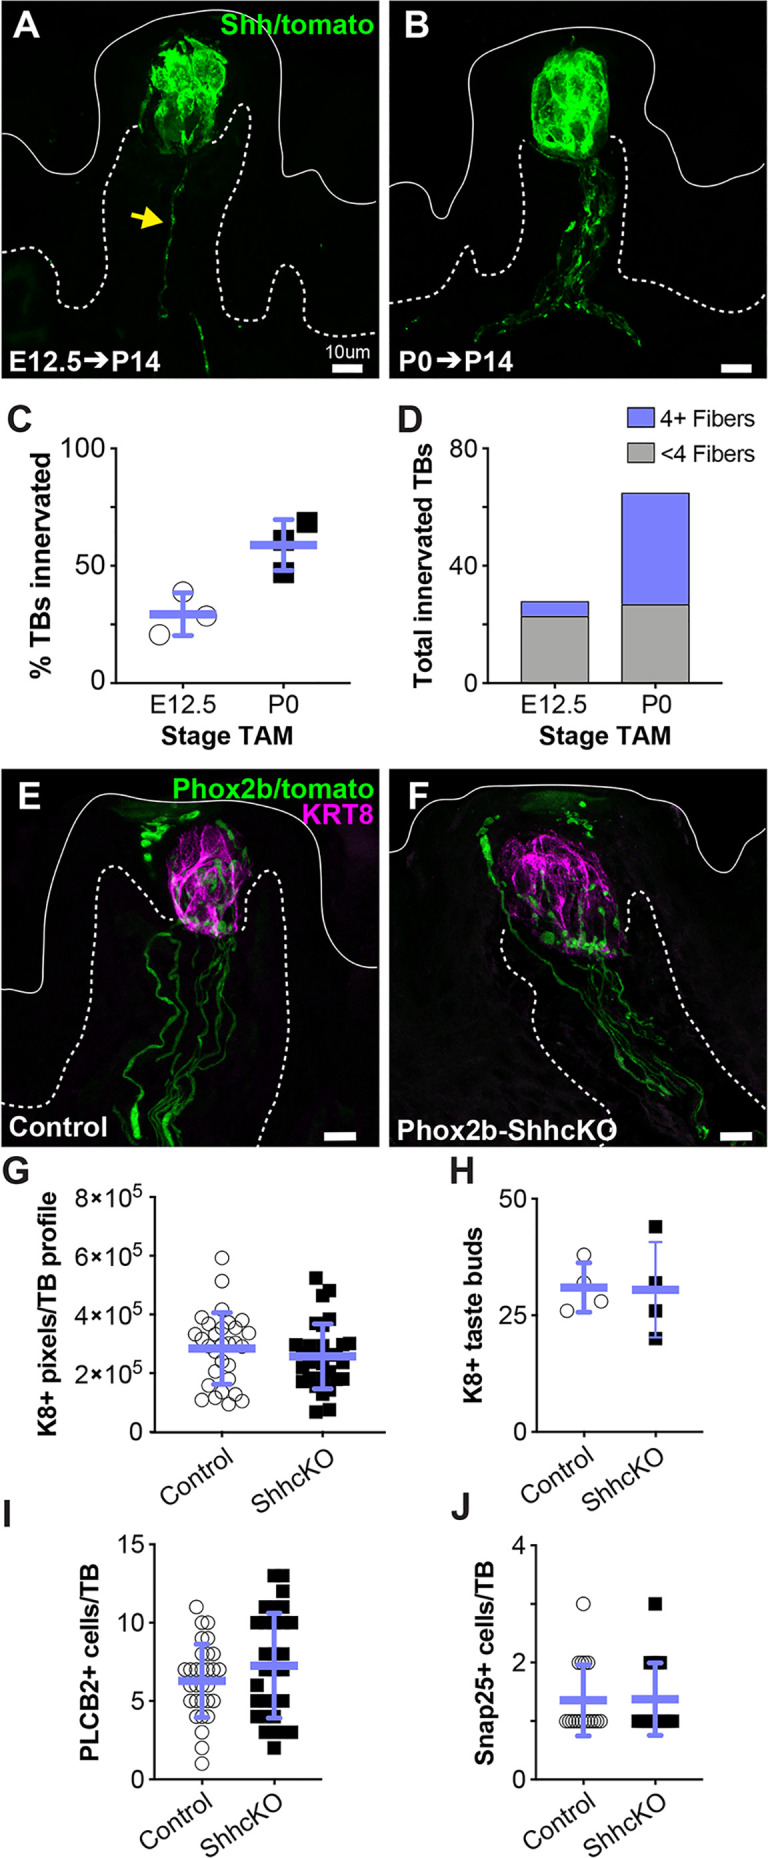
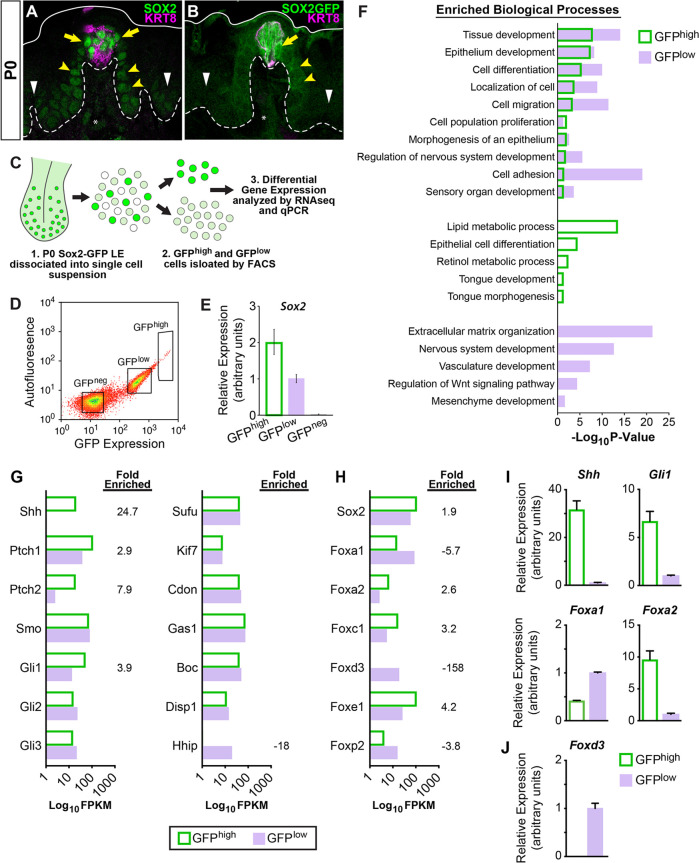
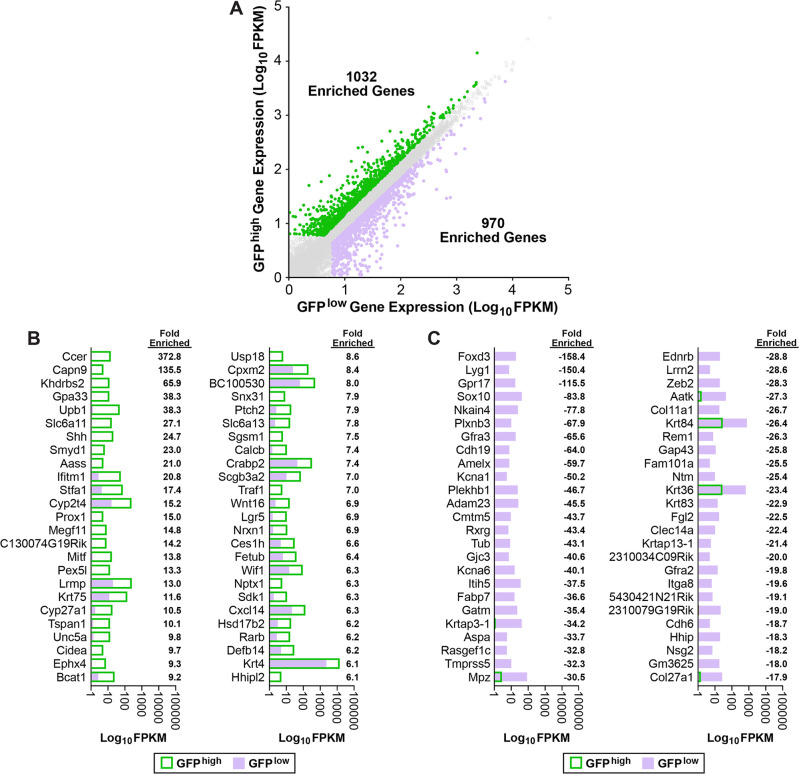
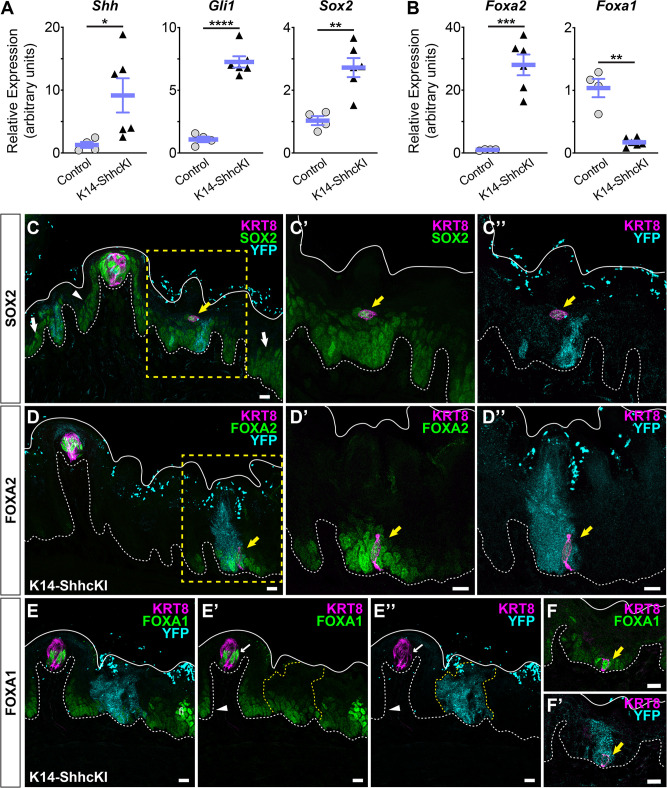
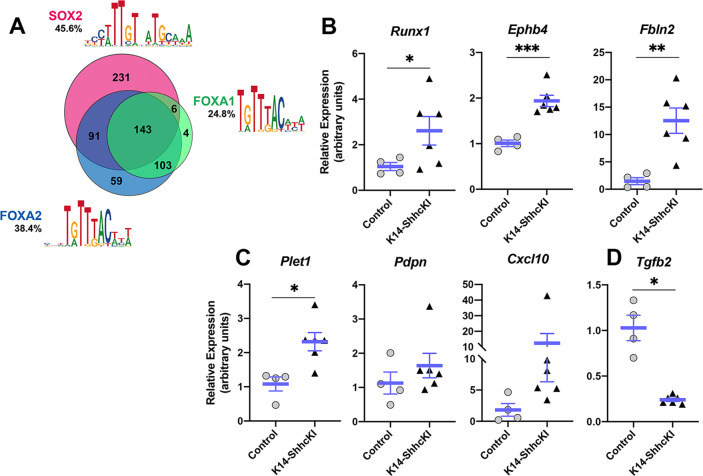
Embryonic taste bud primordia are specified as taste placodes on the tongue surface and differentiate into the first taste receptor cells (TRCs) at birth. Throughout adult life, TRCs are continually regenerated from epithelial progenitors. Sonic hedgehog (SHH) signaling regulates TRC development and renewal, repressing taste fate embryonically, but promoting TRC differentiation in adults. Here, using mouse models, we show TRC renewal initiates at birth and coincides with onset of SHHs pro-taste function. Using transcriptional profiling to explore molecular regulators of renewal, we identified Foxa1 and Foxa2 as potential SHH target genes in lingual progenitors at birth and show that SHH overexpression in vivo alters FoxA1 and FoxA2 expression relevant to taste buds. We further bioinformatically identify genes relevant to cell adhesion and cell locomotion likely regulated by FOXA1;FOXA2 and show that expression of these candidates is also altered by forced SHH expression. We present a new model where SHH promotes TRC differentiation by regulating changes in epithelial cell adhesion and migration.

Keywords: Hedgehog signaling; RNAseq; SOX2; developmental biology; mouse; regeneration; regenerative medicine; stem cells; taste; taste bud.


Conflict of interest statement

EG, EL, LS, GT, DG, TF, JS, KJ, LB No competing interests declared

Figures

Figure 1.
Figure 1.. Taste placodes arise from KRT14+ progenitors that do not contribute further to taste bud primordia during embryogenesis.
(A–C’) Before taste placodes are evident (E12.0), KRT14 (green) and KRT8 (magenta) are co-expressed in lingual epithelium. (D–F) At E13.5, KRT8 expression is expressed by taste placodes (asterisk in F), and surface periderm (E, yellow arrows). KRT14 is evident only basally and apically in placodes (asterisk in F) but remains well expressed in non-taste epithelium. (G–I) At E16.5, KRT8 is expressed exclusively by taste bud primordia (H), which lack KRT14, while non-taste basal epithelial cells are robustly KRT14+. (J) Krt14CreERT2; R26RtdTomato (KRT14-tomato; green) induced at E12.5 labels a subset of KRT8+ (magenta) placode cells at E14.5. (AJ are confocal optical sections acquired at 0.75 µm.) (K) Quantification of placodal KRT14-Tomato+ cells 48 hr after tamoxifen induction at progressive stages, for example tamoxifen at E12.5, analysis at E14.5. Blue bars: mean ± SD (n = 3 animals per stage, 6–11 placodes per animal, open and shaded shapes). Student’s t-test **p<0.01, ***p<0.0001. (L–O) E13.5 and E16.5 taste placodes (KRT8+, magenta) in E-cadherin (Ecad) immunostained whole tongues were imaged through their apical-to-basal extent, 3D reconstructed and individual cells defined in Imaris (see Materials and methods). White outlines (L, N) and randomly assigned colors (M, O) indicate individual placode cells. (P, Q) Total cell number and placode volume did not differ between stages. Blue bars: mean ± SD (n = 3 animals per stage, 10 placodes per animal, open and shaded shapes).
Figure 2.
Figure 2.. KRT14+ progenitor contribution of new cells to taste buds begins at birth.
(A) Quantification of KRT8+ cells per FFP section reveals taste bud cell number does not increase until P9. Blue bars: mean ± SD (n = 3 animals per stage, 8–18 taste buds per animal, open and shaded shapes) Student’s t-test ***p<0.001. (B–E) In pups that received EdU at P0, P7, or P9, analysis at 48 hr revealed comparable proportions of taste buds housed newly generated EdU+/KRT8+ cells (yellow arrows in C–E) regardless of postnatal day of labeling (EdU green, KRT8 magenta). (F–I) Lineage tracing with Krt14CreERT2; R26RYFP (KRT14-YFP) initiated at P0, P7, or P14 assessed at 48 hr showed extensive YFP expression (green) in FFP non-taste epithelium as well as YFP+/KRT8+ cells in taste buds (magenta, yellow arrows in G–I). (C–E, G–I) Dashed lines delimit the basement membrane; solid lines delimit the epithelial surface. (B, F) Blue bars: mean ± SD Student’s t-test **p<0.005 (B: n = 6 animals per stage, 14–28 taste buds per animal; F: n = 3 animals per stage, 10–24 taste buds per animal). (J–M) SHH+ taste precursor cells are not lineage restricted. ShhCreERT2; R26RtdTomato (SHH-Tomato, green) mice treated with TAM at E12.5 reveals similar proportions of type III (NCAM+, CAR4+ magenta in K, L) and type II (PLCß2+ magenta in M) taste cells are tomato+ (green) (N = 3 mice, counts from 24 NCAM+, 30 CAR4+ and 30 PLCß2+ total TBs). (N–Q) Postnatally activated KRT14+ progenitors are not lineage restricted. Krt14CreERT2;R26RYFP (K14-YFP, green) mice treated with TAM at P1 labels both type III (NCAM+, CAR4+ magenta in O, P) and type II (PLCß2 magenta in Q). Double labeled cells indicated with yellow arrows in all image panels. Dashed lines delimit the basement membrane; solid lines delimit the epithelial surface.
Figure 3.
Figure 3.. The timing of genetic deletion of Shh determines its impact on taste development in vivo.
(A) Shh and Gli1 are reduced in tongues of ShhCreERT2/fl embryos at E18.5, induced at E13.5. (B) SHH deletion at E12.5 results in more KRT8+ taste buds at E18.5, but deletion at E16.5 does not alter taste bud number (N = 3–5 embryos per timepoint per genotype; Student’s t-test **p<0.01). (C, D) Genetic deletion of SHH at E12.5 increases KRT8+ (green) taste bud profile diameter (yellow dash with arrows) and FFP diameter (white dash). Dotted line indicates basement membrane. Scale bar: 10 μm. (E, F) Taste bud and papilla diameter increases significantly in ShhCreERT2/fl induced at E12.5 and assayed at E18.5 (N = 3–4 embryos per genotype, 20 taste buds per animal, Students t-test, ***p<0.001, **p<0.01). (G–I) The proportion of E18.5 taste buds housing type I (NTPdase2+), II (PLCß2+), and III (NCAM+) TRCs is significantly increased by SHH deletion at E12.5 (N = 5–8 animals per genotype, Student t-test, *p<0.05). (J, K) SHH deletion at E16.5 does not change taste bud number or size assayed at E20. (L–N) SHH deletion at E16.5 does not lead to precocious differentiation of type I (NTPdase2+), II (PLCß2+), and III (NCAM+) TRCs at E20. Black bars: mean ± SD for all plots.
Figure 3—figure supplement 1.
Figure 3—figure supplement 1.. Taste receptor cell differentiation begins before birth.
(A, B) NTPDase2+ (green) type I TRCs are detected in taste bud primordia at E17.5 and taste buds at P2. (C) The proportion of taste buds housing type I cells increases around birth, such that ~100% contain NTPDase2+ cells at P4. (D, E) PLCß2+ (green) type II cells are detected in taste bud primordia and immature buds at E17.5 and P4, respectively. (F) The proportion of taste buds housing type II cells increases to ~100% by P4. (G, H) Small numbers of NCAM+ (green) type III cells (arrowheads), in addition to NCAM+ gustatory neurites (yellow arrows), are detected in taste bud primordia and immature taste buds at E17.5 and P2, respectively. (I) Type III cells are detected rarely before birth but found in ~50% of buds by P2. (A, B, G, H) Single 0.75 µm optical sections; (D, E) compressed Z-stacks (11 × 0.75 µm optical sections). Draq5 nuclear counterstain (magenta). Dashed lines delimit FFP core and encircle taste primordia (A, D, G) or buds (B, E, H). N = 3–4 mice per time point, 65–120 taste buds per animal.
Figure 4.
Figure 4.. SHH promotes taste fate at birth.
(A, B) KRT14-SHHcKI-YFP induction at P1 drives production of small numbers of ectopic KRT+ cells (magenta, yellow arrow) in patches of YFP+ non-taste lingual epithelium at P14 but does not impact the number of endogenous taste buds (n = 3 mice per timepoint) (Student’s t-test *p<0.03). (C, D) KRT14-SHHcKI-YFP induction at P14 induces more and larger ectopic KRT8+ taste cell clusters at P28, with endogenous taste bud number unaffected (n = 3 mice per timepoint) (Student’s t-test ***p<0.005). (E–G) Ectopic taste buds at P28 house cells expressing markers of type I (NTPdase2 E), II (PLCß2, F), and III (5HT, G) taste cells. (A, C, E–G) Dashed lines delimit the basement membrane; solid lines delimit the epithelial surface; yellow arrows indicate ectopic KRT8+ taste cells. Nuclei counter stained with DAPI. Scale bar: 10 µm.
Figure 4—figure supplement 1.
Figure 4—figure supplement 1.. Forced expression of SHH in embryonic lingual epithelium represses development of endogenous taste buds but does not induce ectopic taste buds.
(A–D) Tamoxifen induction of K14-SHHcKI-YFP at E12.5 leads to mosaic YFP expression at P14 (A, B: green), but ectopic KRT8+ taste buds do not form in these patches (white C, D, E). Endogenous FFP KRT8+ taste buds are detected (C: asterisk) but are reduced in number in mutants compared to controls (E). (A, B, F, G) SOX2 expression (magenta A, B; white F, G) appears upregulated (arrowheads F, G) in the larger SHHcKI-YFP+ patches in non-taste epithelium (white H, I), consistent both with the upregulation of SOX2 by ectopic SHH in adult tongues (Castillo et al., 2014) and the report that overexpression of SOX2 in embryonic lingual epithelium in insufficient to drive taste bud differentiation (Okubo et al., 2006). Scale bar: 10 μm.
Figure 5.
Figure 5.. Embryonic gustatory neurons express SHH, but neural SHH is not required for taste development or postnatal taste bud maintenance.
(A) ShhCreERT2; R26RtdTomato (SHH-tomato) induction at E12.5 drives tomato expression (green) in taste cells and sparse gustatory neurites (yellow arrow) at P14. (B) Induction of SHH-tomato at P0 results in tomato+ taste cells and more numerous reporter-expressing gustatory neurites at P14. (C) More taste buds are innervated at P14 by P0 SHH-tomato lineage traced fibers compared to fibers lineage traced starting at E12.5. Student’s t-test p=0.02. (D) At P14, individual taste buds are innervated more densely when lineage trace is initiated at P0 compared to initiation at E12.5 (n = 3 mice per stage, E12.5 induction – 98 taste buds, P0 induction – 111 taste buds). (E, F) Phox2bCre drives tomato expression (green) in gustatory neurites innervating KRT8+ taste buds (magenta) in control (Phox2bCre;R26RtdTomato) and Phox2b-SHHcKO (Phox2bCre;Shhfl/fl;R26RtdTomato) mice. (G, H) Taste bud size (KRT8+ pixels per taste bud profile) and number do not differ between controls and Phox2b-SHHcKO mice at 10 weeks postnatal. (I–K) Phox2b-SHHcKO does not disrupt differentiation of PLCß2+ type II (I) or SNAP25+ type III (J) taste cells. Blue bars: mean ± SD (n = 3–4 mice per condition; 10 taste buds per animal; open and shaded shapes).
Figure 6.
Figure 6.. SHH pathway associated genes are differentially expressed in SOX2-GFP lingual epithelial cells.
(A, B) At P0, SOX2 and SOX2-GFP (green) are expressed highly in KRT8+ taste buds (magenta) and perigemmal cells (yellow arrows), at lower levels in FFP epithelium (yellow arrowheads) and least intensely in non-taste epithelial basal cells (white arrowheads). Dashed lines delimit basement membrane, solid lines delimit apical epithelial surface. (C) Experimental procedure to isolate SOX2-GFPhigh and SOX2-GFPlow lingual epithelial cells of P0 pups for RNAseq and qPCR analysis. (D) SOX2-GFPhigh, SOX2-GFPlow, and SOX2-GFPneg FAC sorted lingual epithelial cells were collected in discrete fluorescence bins from an expression continuum. (E) qPCR for Sox2 confirms expression is highest in SOX2-GFPhigh cells and absent in SOX2-GFPneg cells. (F) GO term analysis of differentially expressed genes revealed processes enriched in SOX2-GFPhigh vs SOX2-GFPlow populations (see text for details). (G) SHH pathway genes are enriched in SOX2-GFP epithelial cells. (H) Transcription factors associated with SHH signaling are differentially expressed in SOX2-GFPhigh vs SOX2-GFPlow epithelial cells. (I) qPCR for SHH pathway associated genes confirms Shh, Gli1, and Foxa2 are upregulated in SOX2-GFPhigh cells, while Foxa1 is more highly expressed in SOX2-GFPlow cells. (J) Foxd3 is expressed only in the SOX2-GFPlow cells, consistent with the inclusion of mesenchymal cells in this population.
Figure 6—figure supplement 1.
Figure 6—figure supplement 1.. Summary of SOX2-GFPhigh vs SOX2-GFPlow differentially expressed genes.
(A) A scatter plot of the log10 distribution of DEGs enriched in each subpopulation. Fold enrichment of the top 50 genes enriched in (B) SOX2-GFPhigh and (C) SOX2-GFPlow P0 lingual epithelial cells.
Figure 6—figure supplement 2.
Figure 6—figure supplement 2.. Changes in expression of SOX2, FOXA2, and FOXA1 in developing FFP and taste buds may underlie changes in the lingual epithelial response to HH signaling.
(A–C) E13.5. (A) SOX2 (green) is highly expressed in specified taste placodes (KRT8, magenta, asterisk) and more dimly expressed in adjacent keratinocytes (white arrowheads). FOXA2 (green) (B) and FOXA1 (green) (C) are expressed at comparable levels by taste placodes (asterisk) and non-taste epithelium (white arrowheads). (D–F) E16.5. (D) SOX2 is more highly expressed by KRT8+ taste bud primordia (magenta) and adjacent perigemmal cells (yellow arrows), with lower expression in FFP and non-taste epithelium (white arrows and arrowheads, respectively). (E) FOXA2 persists in KRT8+ taste primordia (magenta) but not perigemmal or apical FFP epithelial cells (yellow arrowheads); low expression is detected in basal FFP keratinocytes (white arrows) and non-taste epithelium (white arrowheads). (F) FOXA1 is lowly expressed by subsets of cells in KRT8+ taste primordia (magenta), is absent from perigemmal and apical FFP epithelial cells (yellow arrowheads) but is expressed in FFP basally (white arrows), developing filiform papillae (fi) and interpapillary epithelial cells (ip). (G–I) P0. (G) SOX2 remains strongly expressed in KRT8+ taste buds and perigemmal cells (yellow arrows), is detected at lower levels in FFP basal keratinocytes (white arrows), and is expressed dimly by non-taste basal cells (white arrowheads). (H) FOXA2 expression is restricted to KRT8+ taste buds (magenta) and FFP basal cells at the base of the papilla (white arrows), and absent from perigemmal and apical FFP cells (yellow arrowheads) and non-taste epithelium. (I) FOXA1 is evident KRT8+ taste buds, cells at the base of FFP (white arrows), and absent from apical FFP epithelium and perigemmal cells (yellow arrowheads). Epithelial surface indicated by solid line; dashed lines delimit basement membrane. pc: papilla core. Scale bar: 10 μm.
Figure 7.
Figure 7.. Sox2, FoxA2, and FoxA1 expression in lingual epithelium are altered by postnatal induction of SHH.
(A) Shh, Gli1, and Sox2 are increased in lingual epithelium harvested from P14 Krt14CreERT2;ShhcKI-YFP (KRT14-SHHcKI) pups induced with tamoxifen at P0. (B) Foxa2 expression is increased in SHHcKI epithelium, while Foxa1 is significantly reduced. (A, B): n = 4–6 mice per genotype, Student’s t-test *p<0.05; **p<0.01; ***p<0.001; ****p<0.0001. (C–C”) SOX2 expression (green) is upregulated in and around patches of SHH-YFP+ cells (teal) in lingual epithelium of P14 mice induced with tamoxifen at P0. Ectopic KRT8+ taste cells (magenta) express elevated SOX2 (yellow arrow). (D–D”) FOXA2 is upregulated in and around patches of SHHcKI-YFP+ cells and is detected in ectopic KRT8+ taste cells (yellow arrow). (E–E”) FOXA1 expression appears unaffected in and around patches of SHHcKI-YFP+ cells (dashed yellow lines) but is also detected in occasional ectopic KRT8+ taste cells in SHHcKI-YFP+ domains (F, F’). Scale bars: 10 µm. Basement membrane delimited by dashed white line; solid white lines mark epithelial surface.
Figure 8.
Figure 8.. Expression of putative FOXA2;FOXA1 target genes associated with cell adhesion and movement is altered in response to forced SHH expression.
(A) Motif analysis of DEGs in SOX2-GFP+ cells identified candidate target genes of SOX2, FOXA2, and FOXA1 in lingual epithelium at P0. See text for details. (B–D) Expression of putative target genes of FOXA2 and FOXA1 is altered in P14 lingual epithelium from KRT14-SHHcKI mice induced at P0. (B) Runx1, Ephb4, and Fbln2 are significantly upregulated in KRT14-SHHcKI epithelium compared to controls. (C) Plet1 is upregulated and Pdpn and Cxcl10 trend upward following KRT14-SHHcKI induction. (D) Tgfb2 is significantly downregulated by KRT14-SHHcKI. (B–D): n = 4–6 mice per genotype, Student’s t-test, *p<0.05, **p<0.005, ***p<0.0005.

References

    1. Ang SL. Foxa1 and Foxa2 transcription factors regulate differentiation of midbrain dopaminergic neurons. Advances in Experimental Medicine and Biology. 2009;651:58–65. doi: 10.1007/978-1-4419-0322-8_5. - DOI - PubMed
    1. Arnold K, Sarkar A, Yram MA, Polo JM, Bronson R, Sengupta S, Seandel M, Geijsen N, Hochedlinger K. Sox2(+) adult stem and progenitor cells are important for tissue regeneration and survival of mice. Cell Stem Cell. 2011;9:317–329. doi: 10.1016/j.stem.2011.09.001. - DOI - PMC - PubMed
    1. Bar C, Cohen I, Zhao D, Pothula V, Litskevitch A, Koseki H, Zheng D, Ezhkova E. Polycomb repressive complex 1 controls maintenance of fungiform papillae by repressing sonic hedgehog expression. Cell Reports. 2019;28:257–266. doi: 10.1016/j.celrep.2019.06.011. - DOI - PMC - PubMed
    1. Barlow LA. Progress and renewal in gustation: new insights into taste bud development. Development. 2015;142:3620–3629. doi: 10.1242/dev.120394. - DOI - PMC - PubMed
    1. Barlow LA, Klein OD. Developing and regenerating a sense of taste. Current Topics in Developmental Biology. 2015;111:401–419. doi: 10.1016/bs.ctdb.2014.11.012. - DOI - PMC - PubMed

Publication types

MeSH terms

Associated data